

Geography of Indian Butterflies: Patterns Revealed by Checklists of Federal States
- PMID: 37367366
- PMCID: PMC10299651
- DOI: 10.3390/insects14060549
Geography of Indian Butterflies: Patterns Revealed by Checklists of Federal States
Abstract
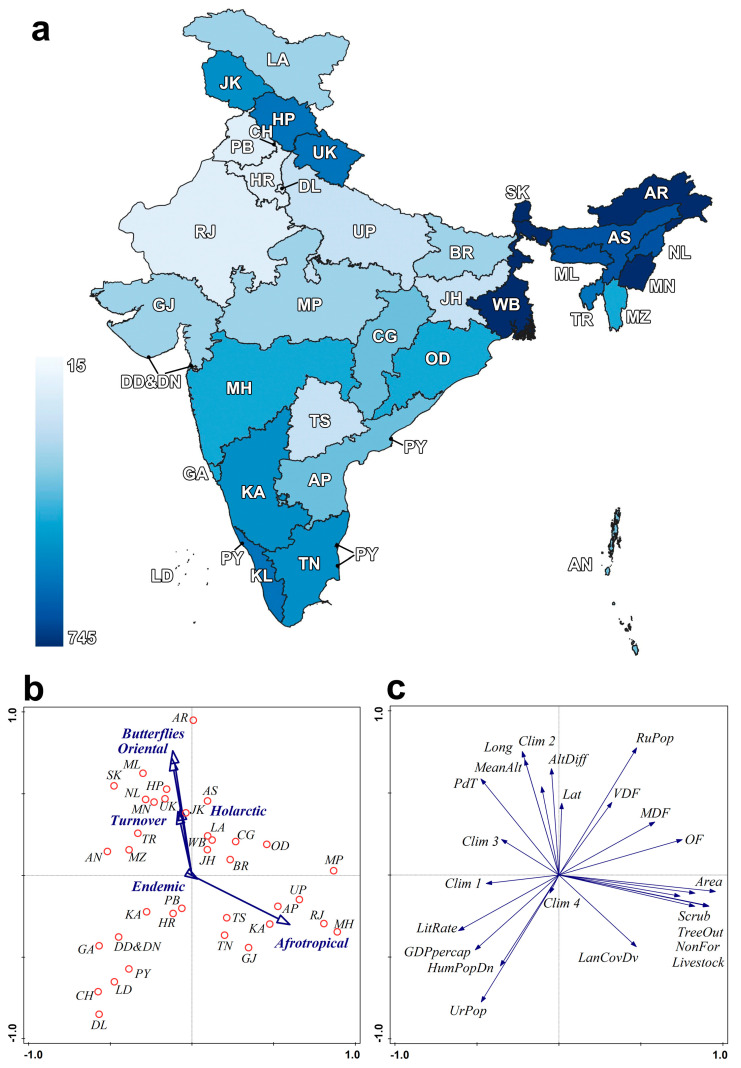
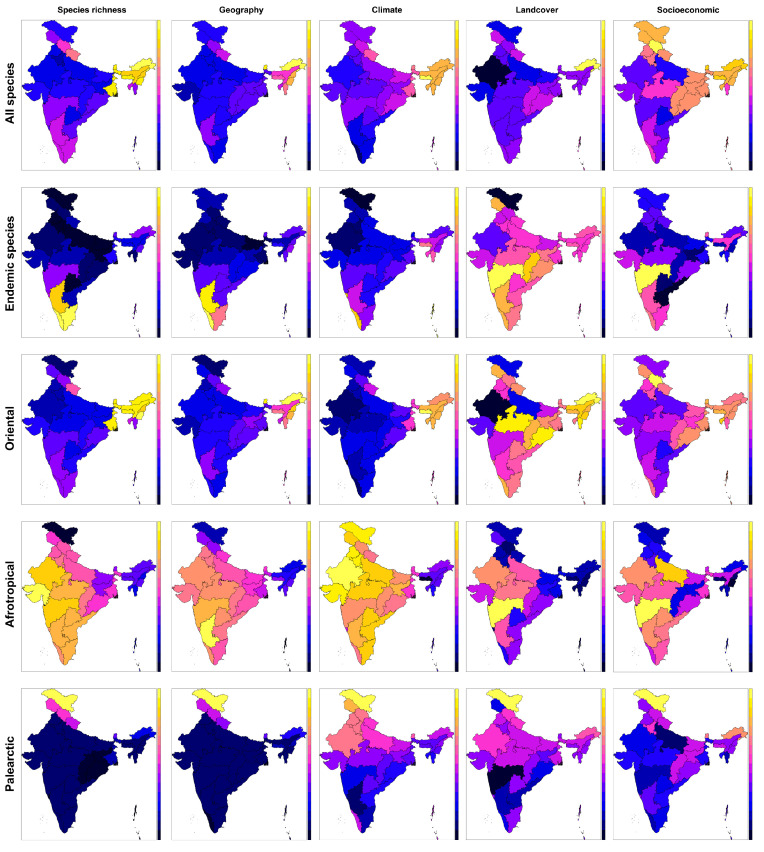
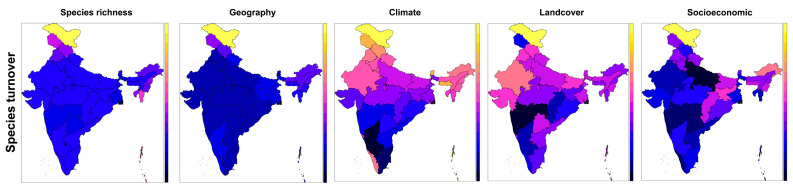
Butterflies are widely used to analyze biogeographical patterns, both at the global and regional scales. Thus far, most of the latter originated from well-surveyed northern regions, while the species-rich tropical areas lag due to a lack of appropriate data. We used checklists of 1379 butterfly species recorded in 36 federal states of the Republic of India (1) to explore the basic macroecological rules, and (2) to relate species richness and the distribution of endemics and geographic elements to geography, climate, land covers and socioeconomic conditions of the states. The area, land covers diversity and latitude did not affect species richness, whereas topographic diversity and the precipitation/temperature ratio (energy availability) were positive predictors. This is due the geographic and climatic idiosyncrasies of the Indian subcontinent, with its highest species richness in the small, densely forested mountainous northeast that receives summer monsoons. The peninsular effect that decreases the richness towards the tip of subcontinent is counterbalanced by the mountainous forested Western Ghats. Afrotropical elements are associated with savannahs, while Palearctic elements are associated with treeless habitats. The bulk of Indian butterfly richness, and the highest conservation priorities, overlap with global biodiversity hotspots, but the mountainous states of the Western Himalayas and the savannah states of peninsular India host distinctive faunas.
Keywords: Oriental realm; biogeographic elements; climate; faunal turnover; latitudinal gradient; peninsular effect.
Conflict of interest statement
The authors declare no conflict of interest.
Figures
Similar articles
-
Testing the causal mechanism of the peninsular effect in passerine birds from South Korea.PLoS One. 2021 Jan 29;16(1):e0245958. doi: 10.1371/journal.pone.0245958. eCollection 2021. PLoS One. 2021. PMID: 33513166 Free PMC article.
-
Climatic stability drives latitudinal trends in range size and richness of woody plants in the Western Ghats, India.PLoS One. 2020 Jul 16;15(7):e0235733. doi: 10.1371/journal.pone.0235733. eCollection 2020. PLoS One. 2020. PMID: 32673330 Free PMC article.
-
Contribution of urban expansion and a changing climate to decline of a butterfly fauna.Conserv Biol. 2014 Jun;28(3):773-82. doi: 10.1111/cobi.12241. Epub 2014 Feb 13. Conserv Biol. 2014. PMID: 24527888
-
Low-intensity agricultural landscapes in Transylvania support high butterfly diversity: implications for conservation.PLoS One. 2014 Jul 24;9(7):e103256. doi: 10.1371/journal.pone.0103256. eCollection 2014. PLoS One. 2014. PMID: 25058307 Free PMC article.
-
Global diversity patterns of larger benthic foraminifera under future climate change.Glob Chang Biol. 2023 Feb;29(4):969-981. doi: 10.1111/gcb.16535. Epub 2022 Nov 29. Glob Chang Biol. 2023. PMID: 36413112 Review.
References
-
- Rangel T.F., Edwards N.R., Holden P.B., Diniz-Filho J.A.F., Gosling W.D., Coelho M.T.P., Cassemiro F.A.S., Rahbek C., Colwell R.K. Modeling the ecology and evolution of biodiversity: Biogeographical cradles, museums, and graves. Science. 2018;361:eaar5452. doi: 10.1126/science.aar5452. - DOI - PubMed
-
- Biber M.F., Voskamp A., Niamir A., Hickler T., Hof C. A comparison of macroecological and stacked species distribution models to predict future global terrestrial vertebrate richness. J. Biogeogr. 2020;47:114–129. doi: 10.1111/jbi.13696. - DOI
Grants and funding
LinkOut - more resources
Full Text Sources
