Review
. 2023 May 23;10(6):227.
doi: 10.3390/jcdd10060227.

Balloon Dilatation in the Management of Congenital Obstructive Lesions of the Heart: Review of Author's Experiences and Observations-Part I

Affiliations
Review

Balloon Dilatation in the Management of Congenital Obstructive Lesions of the Heart: Review of Author's Experiences and Observations-Part I

P Syamasundar Rao. J Cardiovasc Dev Dis. .

Abstract

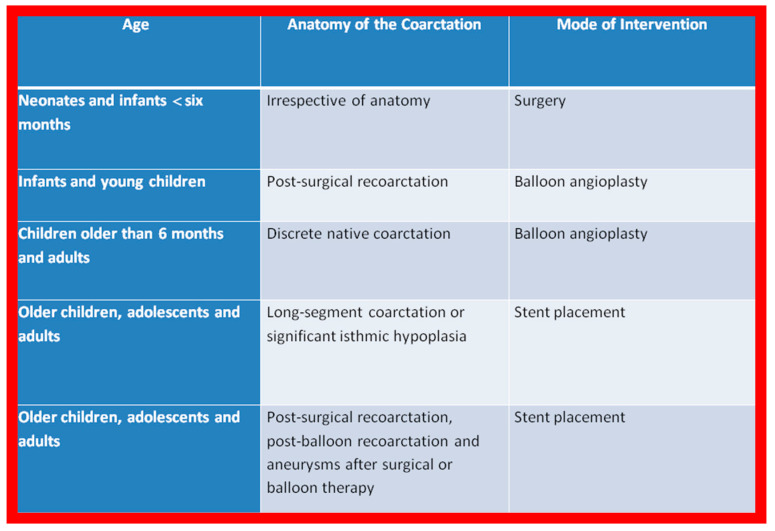
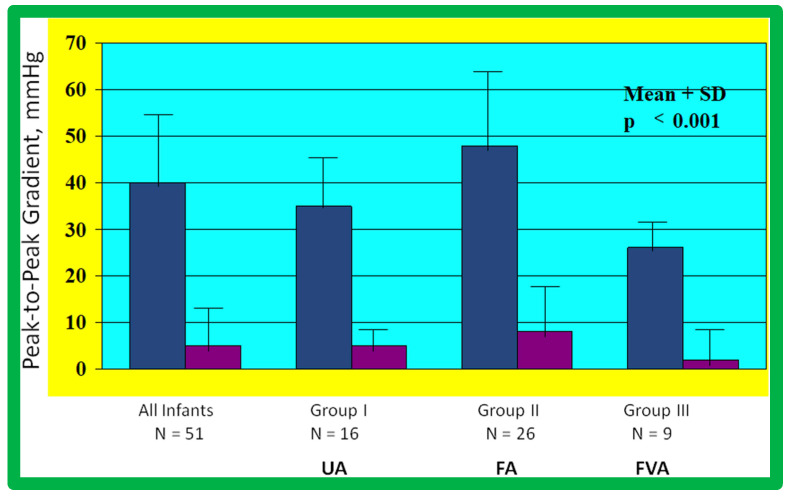
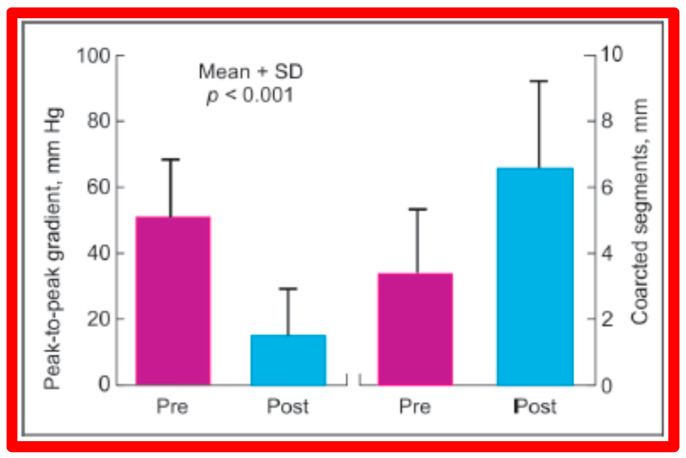
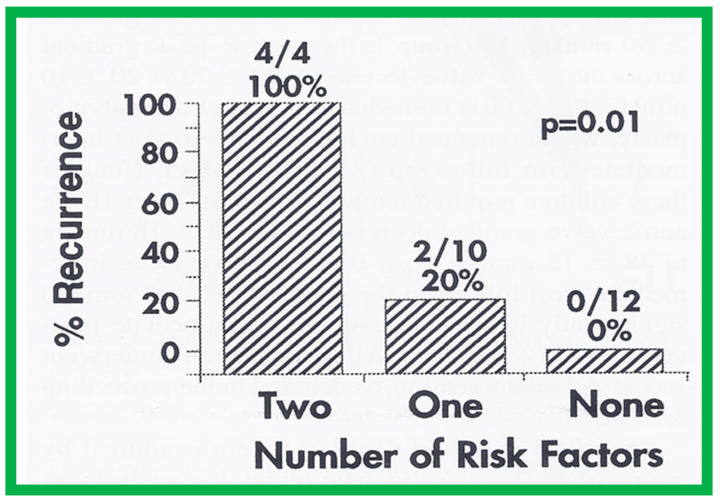
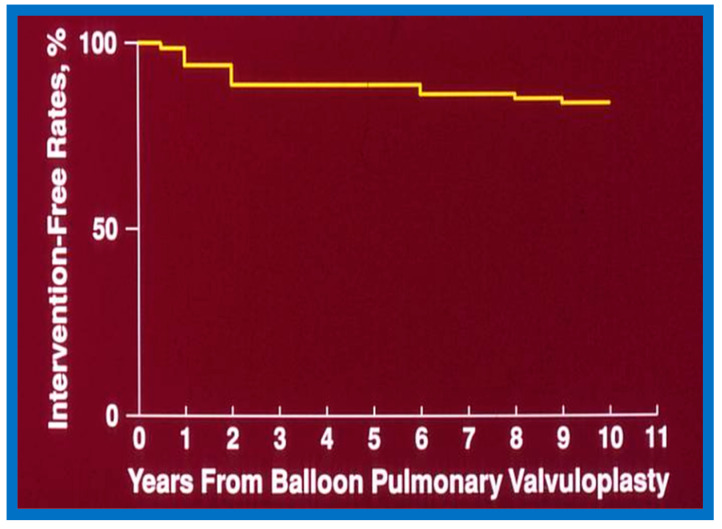
Balloon dilatation techniques became available to treat congenital obstructive lesions of the heart in the early/mid-1980s. The purpose of this review is to present the author's experiences and observations on the techniques and outcomes of balloon dilatation of pulmonary stenosis (PS), aortic stenosis (AS) and aortic coarctation (AC), both native and postsurgical re-coarctations. Balloon dilatation resulted in a reduction of peak pressure gradient across the obstructive lesion at the time of the procedure as well as at short-term and long-term follow-ups. Complications such as recurrence of stenosis, valvar insufficiency (for PS and AS cases) and aneurysm formation (for AC cases) have been reported, but infrequently. It was recommended that strategies be developed to prevent the reported complications.

Keywords: aortic aneurysm; aortic coarctation; aortic insufficiency; aortic stenosis; balloon angioplasty; balloon valvuloplasy; long-term results; pulmonary insufficiency; pulmonary stenosis.


Conflict of interest statement

The authors declare no conflict of interest.

Figures

Figure 1
Figure 1
The author’s recommendations specify the type of therapy depending upon the patient’s age and type of coarctation. Reproduced from Reference [94].
Figure 2
Figure 2
Selected frames from right ventricular (RV) cine-angiograms in a sitting-up (15° left anterior oblique and 35° cranial) view before (A) and immediately after (B) balloon pulmonary valvuloplasty. Note the thin jet (arrows in (A)) prior to valvuloplasty which increased in width (arrows in (B)) after valvuloplasty. C, Catheter; MPA, main pulmonary artery. Reproduced from Reference [62].
Figure 3
Figure 3
Selected frames from right ventricular (RV) cine-angiograms in lateral views before (A) and immediately after (B) balloon pulmonary valvuloplasty. Note the thin jet (barely seen) (arrow in (A)) prior to valvuloplasty which increased in width (arrow in (B)) after valvuloplasty. C, Catheter; MPA, main pulmonary artery. Reproduced from Reference [32].
Figure 4
Figure 4
Balloon dilatation catheter placed across the pulmonary valve showing “waisting” of the balloon (A) in the early phases of inflation (thick arrows) which is almost completely abolished with further balloon inflation (B) (thin arrows). Modified from Reference [62].
Figure 5
Figure 5
(A) A selected cine frame in 15° left anterior oblique with a 35° cranial angulated view demonstrates the position of a balloon angioplasty catheter across the stenotic pulmonary valve. Note the waisting of the balloon (arrow) during the early phase of balloon inflation. (B) The waist has been completely abolished on further inflation of the balloon. Note that the guide wire is passing through the ductus into the descending aorta (DAo). ET, endotracheal tube; NG, nasogastric tube. Reproduced from Reference [100].
Figure 6
Figure 6
Selected cine-radiographic frames in lateral view, demonstrating two balloon catheters placed across the pulmonary valve, showing “waisting” of the balloons (arrows) during the initial phases of balloon inflation (A), which was completely abolished after the complete inflation of the balloons (B). Reproduced from Reference [62].
Figure 7
Figure 7
Selected cine frames from left ventricular (LV) cine-angiograms in posterior-anterior view in two neonates with severe aortic stenosis. (A) A pigtail (PG) catheter was introduced into the LV retrogradely; (B) A Berman angiographic (BA) catheter was advanced from the right atrium (RA), across a patent foramen ovale (not marked) into the left atrium (not marked) and from there into the LV. These angiograms demonstrate the aortic valve annulus (arrows in (A,B)). Note the domed and thickened aortic valve leaflets. Reproduced from Reference [127].
Figure 8
Figure 8
Selected cine frames in posterior–anterior projections illustrating a balloon dilatation catheter across the stenosed aortic valve. Waisting of the balloon (arrow) was seen during the early phases of inflation of the balloon (A) which was completely abolished on further inflation of the balloon (B). Ao, aorta; DAo, descending aorta; GW, guide wire; LV, left ventricle; MC, marker catheter. Reproduced from Reference [84].
Figure 9
Figure 9
Selected cine frames from ascending aortic (AAo) cine-angiogram in 20° left anterior oblique projection demonstrating (A) narrowed coarcted aortic segment (arrow) prior to balloon angioplasty (B) which increased following balloon angioplasty. Note mild hypoplasia of the distal transverse aortic arch and isthmus. DAo, descending aorta; LCC, left common carotid artery; LSA, left subclavian artery; NG, nasogastric tube; PG, pigtail catheter; RInn, right innominate artery. Reproduced from Reference [94].
Figure 10
Figure 10
Selected aortic cine-angiographic frames in 20° left anterior oblique projection demonstrating (A) narrowed coarcted aortic segment (arrow) prior to balloon angioplasty (B) which increased following balloon angioplasty. DAo, descending aorta; LCC, left common carotid artery; LSA, left subclavian artery; PG, pigtail catheter; RCC, right common carotid artery; RInn, right innominate artery. Reproduced from Reference [94].
Figure 11
Figure 11
Selected cine-fluorographic frames in posteroanterior projection in a child demonstrating (A) an angioplasty balloon across the aortic coarctation with waisting (arrow) of the balloon (B) during the initial phases of balloon inflation; the waist has completely disappeared with further balloon inflation. The guidewire (GW) is positioned in the ascending aorta (AAo). Modified from Reference [64].
Figure 12
Figure 12
Line graph showing the immediate results of balloon pulmonary valvuloplasty. Note a significant (p < 0.001) decrease in the right ventricular peak systolic pressure (left panel) and the peak-to-peak systolic pressure gradient across the pulmonary valve (middle panel). Additionally shown is a slight but significant (p < 0.001) increase in the peak systolic pressure in the pulmonary artery (right panel). The mean ± standard deviation (SD) is shown. Reproduced from Reference [75].
Figure 13
Figure 13
Bar graph showing the immediate results of balloon pulmonary valvuloplasty in 85 consecutive patients. Note a significant (p < 0.001) decrease in the peak-to-peak systolic pressure gradient across the pulmonary valve (left panel), a significant (p < 0.001) increase in the peak systolic (syst) pressure in the pulmonary artery (PA) (middle panel) and a significant (p < 0.001) decrease in the right ventricle (RV) to left ventricle (LV) systolic pressure (Pr.) ratio (right panel). The mean + standard deviation (SD) is shown. Pre, prior to balloon pulmonary valvuloplasty; Post, following balloon pulmonary valvuloplasty. Reproduced from Reference [136].
Figure 14
Figure 14
Selected video frames of two-dimensional images from parasternal long axis view prior to (A) and following (B) balloon pulmonary valvuloplasty, demonstrating a decrease in the size of the right ventricle (RV). Ao, aorta; LA, left atrium; LV, left ventricle. Reproduced from Reference [136].
Figure 15
Figure 15
Selected m-mode tracings from parasternal long axis view prior to (A) and following (B) balloon pulmonary valvuloplasty, demonstrating a decrease in the size of the right ventricle (RV). LV, left ventricle. Reproduced from Reference [136].
Figure 16
Figure 16
Selected video frames of the atrial septum, demonstrating a right-to-left shunt by color Doppler, across the patent foramen ovale prior to balloon pulmonary valvuloplasty (A) which has changed to a left-to-right shunt (B) 24 h later. LA, left atrium; RA, right atrium. Reproduced from Reference [75].
Figure 17
Figure 17
Aortic (Ao) and left ventricular (LV) pressure tracings prior to (A,B) and fifteen minutes following (C) balloon aortic valvuloplasty demonstrating almost complete abolition of the peak-to-peak pressure gradient across the aortic valve. Reproduced from Reference [63].
Figure 18
Figure 18
Simultaneous pressure recordings from the left ventricle and aorta prior to (PRE—(A)) and fifteen minutes following (POST—(B)) balloon aortic valvuloplasty demonstrating no residual gradient. There is a slight decrease in aortic diastolic pressure (B) suggesting aortic insufficiency. Reproduced from Reference [84].
Figure 19
Figure 19
Bar graph demonstrating immediate and follow-up results after balloon aortic valvuloplasty. Note a significant (p < 0.001) decrease in peak-to-peak systolic pressure gradients across the aortic valve after balloon valvuloplasty (Pre, before vs. Post, immediately after). Gradient measured during repeat catheterization in 15 patients increased (p < 0.01) at intermediate-term follow-up (ITFU) of mean of 16 months. Reproduced from Reference [48].
Figure 20
Figure 20
Bar graph illustrating immediate results of balloon aortic valvuloplasty for aortic valve stenosis. Significant (p = 0.001) decrease in the peak-to-peak systolic pressure gradients (left panel) and percent reduction (right panel) were shown. Mean + standard deviation (SD) is marked. Pre, prior to; post, following balloon aortic valvuloplasty. Reproduced from Reference [84].
Figure 21
Figure 21
Bar graph showing maximal peak instantaneous Doppler gradients before (Pre) and 1 day after (Post) balloon aortic valvuloplasty and at intermediate-term (ITFU) and late (LTFU) follow-up. There was a significant reduction (p < 0.001) in the gradient after balloon aortic valvuloplasty which remained essentially unchanged (p > 0.1) at ITFU (12 ± 5 months) and at LTFU (3 to 9 years [mean 6 years]). Doppler-derived maximal peak instantaneous gradients at follow-up continued to be lower (p < 0.001) than pre-valvuloplasty gradients. Reproduced from Reference [48].
Figure 22
Figure 22
Bar graph demonstrating the prevalence of grade III aortic insufficiency prior to (Pre), immediately following (Post) balloon aortic valvuloplasty, and at late follow-up (FU). No change in aortic insufficiency is seen immediately after balloon valvuloplasty. However, a significant increase occurred at late follow-up. Modified from Reference [83].
Figure 23
Figure 23
Bar graph demonstrating left ventricular (LV) end-diastolic dimension (EDD) in mm (left panel), LV posterior wall thickness in diastole (PWTd) in mm (middle panel), and LV shortening fraction (SF) in % (right panel) prior to (Pre), on the day after (Post) balloon aortic valvuloplasty, and at late follow-up (FU). Mean + standard deviations (SD) are marked. Note that LVEDD, LVPWTd, and LVSF did not change (p > 0.1) immediately after balloon aortic valvuloplasty. At late follow-up the LVEDD increased (p < 0.001) while the LVPWTd and LVSF remain unchanged (p > 0.05). Reproduced from Reference [116].
Figure 24
Figure 24
Pressure pullback recordings across the aortic coarctation (A) prior to, (B) immediately following, and (C) 1 year after balloon angioplasty. Note the reduction of the peak-to-peak systolic gradient across the coarctation site (B) immediately following balloon angioplasty which (C) persisted one year later. Pressures are marked in mmHg. ECG, electrocardiogram. Reproduced from Reference [94].
Figure 25
Figure 25
A bar graph of results following balloon angioplasty of native aortic coarctation is shown. Peak-to-peak systolic pressure gradients across the coarctation (shown as mean + SEM (standard error of mean)) decreased significantly (p < 0.001) from prior to (Pre) immediately after (Post) balloon angioplasty. However, the gradient increased (p < 0.05) slightly at intermediate-term follow-up (FU). However, these gradients continue to be lower (p < 0.001) than pre-angioplasty values. At long-term follow-up (LFU) arm-leg peak systolic pressure difference, measured by blood pressures is lower than coarctation gradients prior to (p < 0.001) and at intermediate-term follow-up (p < 0.01). SEM, standard error of mean; N, number of patients undergoing balloon angioplasty. Reproduced from Reference [94].
Figure 26
Figure 26
Selected left ventricular (LV) and aortic (Ao) cine-angiographic frames of a nine-month-old baby (A) prior to, (B) immediately after and (C) 1-year following balloon angioplasty are shown. The coarcted aortic segment (arrow) improved remarkably (B) after angioplasty (C) which continues to be wide open at follow-up. C, catheter. Reproduced from Reference [64].
Figure 27
Figure 27
Selected left ventricular (LV) and descending aortic (DAo) cine frames from a posteroanterior view demonstrating (A) discrete aortic coarctation (white arrow) in a 10-year-old child (B) with remarkable improvement after balloon angioplasty (black arrow). Ao, aorta. Reproduced from Reference [64].
Figure 28
Figure 28
A bar graph of results following balloon angioplasty of native aortic coarctation in different age groups is shown. Peak-to-peak systolic pressure gradients across the coarctation (shown as mean + SEM) decreased significantly (p < 0.001) from prior to (Pre-red) immediately after (Post-orange) balloon angioplasty in each age group. SEM, standard error of mean; N, number of patients undergoing balloon angioplasty in each age group. Reproduced from Reference [94].
Figure 29
Figure 29
A bar graph of results following balloon angioplasty of native aortic coarctation in different age groups is shown. Diameter of the coarctation segment (shown as mean + SEM) increased significantly (p < 0.001) from prior to (Pre-red) immediately after (Post-orange) balloon angioplasty in each age group. SEM, standard error of mean; N, number of patients undergoing balloon angioplasty in each age group. Reproduced from Reference [94].
Figure 30
Figure 30
Selected cine-angiographic frames from a posteroanterior view of aortograms (A) before and (B) after balloon angioplasty, demonstrating aortic coarctation (white arrow) and many collateral vessels in (A). (B) Immediately after balloon angioplasty, the aortogram shows a marked decrease in collateral vessels. The site of dilated coarctation segment (arrows in (B)) is wide open. Additionally, note a better opacification of the descending aorta (DAo) in (B) than in (A). A catheter is seen in the right pulmonary artery (RPA). Ao, aorta. Reproduced from Reference [64].
Figure 31
Figure 31
Bar graph showing reduction (p < 0.001) of peak-to-peak systolic pressure gradients (in mmHg) across the aortic coarctation after balloon angioplasty. The fall in the gradients was seen for the entire group (left panel) and for all three subgroups, namely trans-umbilical arterial (UA), trans-femoral arterial (FA), and trans-femoral venous anterograde (FVA). Mean + standard deviation (SD) is shown. N represents the number of subjects in each group. Modified from Reference [98].
Figure 32
Figure 32
Selected aortic (Ao) and left ventricular (LV) cine-angiographic frames of a one-month-old baby prior to (A), immediately after (B), and 1 year following (C) balloon angioplasty are shown. The coarcted aortic segment (arrowhead) shown in “A” improved remarkably after angioplasty (arrowhead in (B)) which continues to be wide open at follow-up (arrowhead in (C)). DAo, descending aorta. Reproduced from Reference [131].
Figure 33
Figure 33
Bar graph demonstrating re-coarctation rates during follow-up after balloon angioplasty of native coarctation in infants. The rate of recurrence is not related (p > 0.05) to the route through which balloon angioplasty was performed (left panel). However, when the patients were divided into neonates (≤30 days) and infants between 31 and 90 days, the rate of recurrence was significantly higher (p < 0.001) in neonates than in infants (right panel). Number of subjects with recurrence/number of subjects in that group is shown on the top of each bar. The data indicate that age at angioplasty plays a major role in re-coarctation and not the route of balloon angioplasty. d, days; FA, femoral artery; FVA, femoral venous, anterograde; UA, umbilical artery. Modified from Reference [98].
Figure 34
Figure 34
Aortic arch (AA) cine-angiogram in posteroanterior projection prior to (A), immediately after (B) balloon angioplasty demonstrating severe post-operative aortic re-coarctation (arrow in (A)). Balloon angioplasty resulted in an improvement in angiographic diameter (arrow in (B)). Repeat left ventricular (LV) cine twelve months later continues to show wide open aortic segment (arrow in (C)). DAo, descending aorta; LV, left ventricle. Reproduced from Reference [65].
Figure 35
Figure 35
Left ventricular cine-angiogram in lateral projection demonstrating severe post-operative aortic coarctation (arrows in (a)). Balloon angioplasty resulted in an improvement in angiographic diameter (arrows in (b)). Repeat aortic (Ao) root cine one year later continues to show wide open aortic segment (arrows in (c)). DAo, descending aorta. Reproduced from Reference [65].
Figure 36
Figure 36
Selected aortic (Ao) cine-angiographic frames in posteroanterior and lateral views of a young child (A,C) prior to and (B,D) immediately after balloon angioplasty of postsurgical aortic re-coarctation. The coarcted aortic segment (arrows) (B,D) improved remarkably after angioplasty. DAo, descending aorta. Reproduced from Reference [65].
Figure 37
Figure 37
A bar graph of results following balloon angioplasty of postsurgical aortic re-coarctation is shown. Peak-to-peak systolic pressure gradients across the coarctation decreased significantly (p < 0.001) from prior to (Pre) to immediately after (Post) balloon angioplasty. Similarly, the diameter of the coarcted aortic segment increased significantly (p < 0.001) after balloon angioplasty. Mean + SD (standard deviation) is shown. Modified from Reference [49].
Figure 38
Figure 38
Selected aortic (Ao) cine-angiographic frames in lateral view of a young child (A) prior to and (B) immediately after balloon angioplasty of postsurgical aortic re-coarctation. The coarcted aortic segment (white arrow in (A)) (B) improved remarkably after angioplasty. DAo, descending aorta; LCC, left common carotid artery; LSC, left subclavian artery; RI, right innominate artery. Reproduced from Reference [94].
Figure 39
Figure 39
Left ventricular cine-angiogram in anteroposterior projection demonstrating severe post-operative aortic coarctation (arrowhead in (a)). Balloon angioplasty resulted in improvement in angiographic diameter (arrowhead in (b)). Repeat aortic (Ao) root cine one year later continues to show wide open aortic segment (arrowhead in (c)). DAo, descending aorta. Reproduced from Reference [49].
Figure 40
Figure 40
Bar graph shows Doppler flow velocities across the coarctation site prior to (Pre) and immediately after (Post) balloon angioplasty of postsurgical aortic re-coarctation and at long-term follow-up (LFTU). Note significant (p < 0.001) fall in Doppler flow velocities after balloon angioplasty. At LFTU, the Doppler flow velocities continue to be lower (p < 0.001) than those prior to balloon angioplasty. Mean + SD (standard deviation) is shown. Modified from Reference [94].
Figure 41
Figure 41
Bar graph showing the immediate and follow-up peak-to-peak pulmonary valve systolic pressure gradients in 45 unselected patients who underwent cardiac catheterization at a mean of 11 months following balloon pulmonary valvuloplasty. Note the significant (p < 0.001) fall in the gradient immediately after (Pre vs. Post) balloon dilatation, which remained unchanged (p > 0.1) at follow-up (FU). N, number of patients. The mean + standard deviation (SD) is shown. Reproduced from Reference [62].
Figure 42
Figure 42
Doppler flow velocity recordings from the main pulmonary artery prior to (A), one day (B) and eight months (C) after balloon pulmonary valvuloplasty are shown. Note that there was a remarkable decrease in the peak flow velocity and calculated gradient (92 mmHg vs. 17 mmHg) one day after the procedure, and these remained low (20 mmHg) at follow-up. Reproduced from Reference [69].
Figure 43
Figure 43
Bar graph demonstrating maximum peak instantaneous Doppler gradients prior to (Pre) and one day following (Post) balloon pulmonary valvuloplasty, and at intermediate-term follow-up (ITFU) (Short-term). Note the significant reduction (p < 0.001) after valvuloplasty which remains unchanged (p > 0.1) at ITFU. The mean + standard deviation (SD) is shown. Modified from Reference [50].
Figure 44
Figure 44
The size of the heart prior to (A) and 1 year following (B) balloon pulmonary valvuloplasty, demonstrating the decreased size of the heart at follow-up. Reproduced from Reference [136].
Figure 45
Figure 45
Right ventricular (RV) cine-angiographic frames prior to (A) and 1 year following (B) balloon pulmonary valvuloplasty, demonstrating the almost complete disappearance of tricuspid insufficiency. C, catheter; PA, pulmonary artery, RA, right atrium. Reproduced from Reference [62].
Figure 46
Figure 46
Selected cine frames from right ventricular (RV) angiogram in lateral view, showing severe infundibular stenosis (arrow) (A) immediately after balloon pulmonary valvuloplasty. Note the wide open right ventricular outflow tract (B) at cardiac catheterization 10 months after balloon valvuloplasty. The peak-to-peak pulmonary valvar pressure gradient at follow-up catheterization was 20 mmHg; there was no infundibular gradient. C, catheter; PA, pulmonary artery. Reproduced from Reference [69].
Figure 47
Figure 47
The main pulmonary artery Doppler flow velocities prior to (A), one day (B), and ten months (C) following balloon pulmonary valvuloplasty are shown. Note that there is a significant fall in the peak flow velocity immediately after valvuloplasty, but a moderate (48 mmHg) gradient that has a characteristic triangular pattern, highly suggestive of infundibular obstruction (corresponding to Figure 20 left) persisted. At the 10-month follow-up, the flow velocity has markedly diminished, indicating the resolution of the infundibular obstruction (corresponding to Figure 20 right). The residual calculated gradients are shown at the bottom of each panel. Reproduced from Reference [69].
Figure 48
Figure 48
Line graph showing pulmonary valve gradients prior to (Pre) and immediately following (Post) balloon pulmonary valvuloplasty (BPV), and at follow-up (FU). The patients with good results are shown in green while those with poor results are shown in orange. Repeat BPV was performed in five patients; the gradients fell and remained low at the second FU. Modified from Reference [25].
Figure 49
Figure 49
Bar graph showing the immediate (IMM) and follow-up (FU) results of balloon pulmonary valvuloplasty in Group I (with good results) (left panel) and in Group II (with poor results) (right panel). In Group I, the pulmonary valve gradient decreased significantly (p < 0.001) immediately after valvuloplasty and remained low (p < 0.001) at follow-up. In Group II, the pulmonary valve gradient fell slightly (p > 0.05) immediately after valvuloplasty and returned to the pre-valvuloplasty values (p > 0.1) at follow-up. The mean + standard error of mean (SEM) is shown. Reproduced from Reference [75].
Figure 50
Figure 50
Bar graph demonstrating the influence of the balloon/annulus ratio (B/A) on rates of recurrence of pulmonary valve stenosis after balloon pulmonary valvuloplasty. Note that the rate of restenosis decreases as the balloon/annulus ratio increases (p = 0.001 to 0.002). Percentages are marked within the bars and actual numbers are shown on the top of each bar. Modified from Reference [62].
Figure 51
Figure 51
Bar graph like Figure 50, except that the immediate post-valvuloplasty peak-to-peak pulmonary valve gradients are used instead of balloon/annulus ratios. Note the higher (p = 0.001) rate of recurrence at follow-up when the gradient is >30 mmHg. Percentages are marked within the bars and actual numbers are shown on the top of each bar. Modified from Reference [62].
Figure 52
Figure 52
Results of repeat balloon pulmonary valvuloplasty of patients who had restenosis after initial balloon valvuloplasty. The initial gradients were reduced (p < 0.05) significantly after valvuloplasty (pre vs. post) but returned toward pre-valvuloplasty values (p > 0.1) at intermediate-term follow-up (ITFU). Repeat valvuloplasty (RE-BAL) again reduced the gradient (p < 0.01), which had decreased further (p < 0.05) at long-term follow-up (LFU) and continued to be lower than the gradients prior to the first (p < 0.001) and second (p < 0.001) balloon procedures. The mean + standard deviation (SD) is shown. Modified from Reference [144].
Figure 53
Figure 53
Line graph showing aortic valve peak-to-peak systolic pressure gradients prior to (Pre), immediately following (Post) and at follow-up (FU) after balloon aortic valvuloplasty. Patients with good results are shown in green while those with poor results are shown in orange. Re-intervention (RI) (balloon valvuloplasty) was performed in some patients and the gradients fell. On further follow-up (2FU), the residual gradients remained low. When the severity of the gradients was examined, the severity grade of the stenosis decreased in all patients going from severe to moderate, mild or trivial, and from moderate to mild or trivial. Reproduced from Reference [116]. Solid green lines indicate good results; Orange lines indicate poor results.
Figure 54
Figure 54
Bar graph showing immediate (IMM) and follow-up (FU) results of balloon aortic valvuloplasty in Group I with good results (left panel) and in Group II with poor results (right panel). In Group I with good results, the aortic valve gradient decreased significantly (p < 0.001) immediately after valvuloplasty and remained low (p < 0.001) at follow-up. In Group II with poor results, the aortic valve gradient fell (p < 0.01) immediately after valvuloplasty and returned to pre-valvuloplasty values (p > 0.1) at follow-up. Mean + standard error of mean (SEM) is shown. Reproduced from Reference [116].
Figure 55
Figure 55
Bar graph demonstrating the influence of multiple risk factors on rates of recurrence of aortic stenosis after balloon aortic valvuloplasty. Note that the larger the number of risk factors, the greater is the probability for restenosis. Percentages and actual numbers are shown on the top of each bar. Reproduced from Reference [83].
Figure 56
Figure 56
Bar graph showing aortic valve peak-to-peak systolic pressure gradients before (Pre), after initial balloon valvuloplasty (1st B), at follow-up (FU), after repeated balloon dilatation (2nd B), and at late follow-up at 6 and 7 years, respectively, in 2 patients with restenosis. Note a significant decrease in gradient after each balloon valvuloplasty. Gradients remained low after the second balloon valvuloplasty by Doppler (D) and at late follow-ups 6 and 7 years later. Reproduced from Reference [144].
Figure 57
Figure 57
Bar graph illustrates prevalence of re-coarctation following balloon angioplasty. Percent prevalence is marked within the bar while the actual numbers are shown on the top of the bar. The prevalence is low at 8.3% in children, while it is high (83%) in neonates. D, days; I, infants; mo, months; N, neonates; Yr, years. Reproduced from Reference [94].
Figure 58
Figure 58
Line graph shows coarctation gradients prior to (Pre), immediately following (Post) and at follow-up (FU) after balloon angioplasty (BA). Patients with good results are shown in green while those with poor results are shown in orange. Repeat BA was performed in some patients and the gradients fell. Reproduced from Reference [94].
Figure 59
Figure 59
Bar graph showing immediate (IMM) and follow-up (FU) results of balloon angioplasty in Group A with good results (left panel) and in Group B with poor results (right panel). In Group A with good results, the coarctation gradients decreased significantly (p < 0.001) immediately after balloon angioplasty and remained low (p < 0.001) at follow-up. In Group B with poor results, the coarctation gradient also fell (p < 0.001) immediately after angioplasty but increased significantly (p < 0.001) at follow-up, SEM, standard error of mean. Reproduced from Reference [94].
Figure 60
Figure 60
The bar graph demonstrates the influence of multiple risk factors on rates of recurrence of coarctation after balloon angioplasty. Note that the larger the number of risk factors, the greater is the probability for re-coarctation. Percentages are marked within the bars and actual numbers are shown on the top of each bar. Reproduced from Reference [94].
Figure 61
Figure 61
Results of repeat balloon angioplasty of aortic coarctation that had restenosis after initial balloon angioplasty. Initial gradients were reduced (p < 0.001) significantly after angioplasty (pre vs. post), which returned toward pre-angioplasty values (p < 0.05) at intermediate-term follow-up (FU). Repeat balloon angioplasty (2nd BA) again reduced the gradient (p < 0.001) which remained similar (p > 0.1) on further follow-up (2nd FU). The residual gradients continue to be lower than the gradients prior to the first (p < 0.001) and second (p < 0.001) balloon procedures. Mean + standard error of mean (SEM) is shown. N = 10 (number of subjects undergoing repeat balloon angioplasty). Reproduced from Reference [94].
Figure 62
Figure 62
Bar graph of immediate and follow-up results after balloon angioplasty of postsurgical aortic re-coarctation are shown. Peak-to-peak systolic pressure gradients across the coarctation decreased significantly (p < 0.001) from prior to (Pre) to immediately after (Post) balloon angioplasty. They decreased further (p < 0.05) at intermediate-term (ITFU) and at long-term follow-up (LTFU). The ITFU and LTFU gradients remained remarkably lower (p < 0.001) than those of prior balloon angioplasty. Mean + SD (standard deviation) is shown. Reproduced from Reference [49].
Figure 63
Figure 63
A bar graph of immediate and follow-up results after balloon angioplasty of postsurgical aortic re-coarctation are shown. Coarctation segment diameters increased significantly (p < 0.001) from prior to (Pre) or immediately after (Post) balloon angioplasty. They increased further (p < 0.001) at intermediate-term follow-up (FU). The FU coarctation segment diameters remained wider (p < 0.001) than those of prior balloon angioplasty. Mean + SD (standard deviation) is shown. Reproduced from Reference [49].
Figure 64
Figure 64
Bar graph demonstrating maximum peak instantaneous Doppler gradients prior to (Pre) and one day following (Post) balloon pulmonary valvuloplasty, and at intermediate-term (ITFU) and long-term (LTFU) follow-up. Note the significant reduction (p < 0.001) after valvuloplasty, which remains unchanged (p > 0.1) at ITFU. However, at LTFU there was a further fall (p < 0.001) in the Doppler gradients. The mean + standard deviation (SD) is shown. Modified from Reference [50].
Figure 65
Figure 65
Bar graph showing the right ventricular end-diastolic dimensions prior to (Pre) and one day after (Post) balloon pulmonary valvuloplasty, and at intermediate-term (ITFU) and at long-term (LTFU) follow-up. There was a significant decrease (p < 0.05) in right ventricular size immediately following the balloon procedure. There was no further change at ITFU and LTFU. A significant increase (p < 0.05) in the incidence of flat septal motion was observed at LTFU (see Figure 10, Figure 11, Figure 12, Figure 13, Figure 14, Figure 15, Figure 16, Figure 17, Figure 18 and Figure 19). No patient had paradoxical septal motion. The mean + standard deviation (SD) is shown. Modified from Reference [50].
Figure 66
Figure 66
Actuarial event-free rates after balloon pulmonary valvuloplasty. The re-intervention-free rates at one, two, five, and ten years after the procedure are 94%, 89%, 88%, and 84%, respectively. Modified from Reference [50].
Figure 67
Figure 67
Bar graph showing Doppler graded pulmonary insufficiency (PI) prior to (Pre) and one day after (Post) balloon pulmonary valvuloplasty and at intermediate-term (ITFU) and long-term (LTFU) follow-up. 0, No PI; 1+, 2+, 3+, PI grade as per table above. A gradual but significant increase (p < 0.05 to p < 0.001) in the incidence of PI is seen. Modified from Reference [50]. Dark color indicates less degree of PI and light color indicates more severe degree of PI.
Figure 68
Figure 68
Bar graph showing the prevalence of inter-ventricular septal motion prior to (Pre) and one day after (Post) balloon pulmonary valvuloplasty, and at intermediate-term (ITFU) and long-term (LTFU) follow-up. Note the significant increase (p < 0.05) in the incidence of flat septal motion at LTFU. No patient was observed to have paradoxical septal motion. Reproduced from Reference [50].
Figure 69
Figure 69
Degree of aortic insufficiency by Doppler echocardiography before (Pre), the day after (Post), and at late follow-up (FU). There is a significant (p = 0.002) increase in aortic insufficiency from pre-valvuloplasty to post-valvuloplasty. The number of patients with grade 3+ aortic insufficiency (0 of 26 vs. 7 of 26) at follow-up (FU) increased (p < 0.02). Modified from Reference [48].
Figure 70
Figure 70
Actuarial event-free rates after balloon aortic valvuloplasty. Seventy percent confidence limits are marked with dashed lines. Note that intervention-free rates at 1, 2, 5, and 9 years are 80%, 76%, 76%, and 76%, respectively. Modified from Reference [48].
Figure 71
Figure 71
Actuarial event-free survival curves of neonates (<30 days), infants (1–12 months), and children (1–15 years) who had undergone balloon angioplasty of aortic coarctation. The event-free survival rates are better for the children group than for the neonatal and infant groups (p < 0.001). Modified from Reference [131].

Similar articles

Cited by

References

    1. Dotter C.T., Judkins M.P. Transluminal treatment of arteriosclerotic obstruction: Description of a new technique and a preliminary report of its application. Circulation. 1964;30:654–670. doi: 10.1161/01.CIR.30.5.654. - DOI - PubMed
    1. Grüntzig A. Die perkutane rekanalisation chronischer arterieller-verschisse (Dotter-Prinzip) mit einem doppellumigen dilatations-katheter. Rofo. 1976;124:80–86. doi: 10.1055/s-0029-1230286. - DOI - PubMed
    1. Grüntzig A.R., Kuhlmann V., Vetter W., Lutolf V., Meier B., Siegenthaler W. Treatment of renovascular hypertension with percutaneous transluminal dilatation of a renal artery stenosis. Lancet. 1978;1:801–802. doi: 10.1016/S0140-6736(78)93000-3. - DOI - PubMed
    1. Grüntzig A., Schneider H.J. The percutaneous dilatation of chronic coronary stenoses--experiments and morphology. Schweiz. Med. Wochenschr. 1977;107:1588. (In German) - PubMed
    1. Grüntzig A.R. Perkutane Dilatation von Coronarstenosen-Beschereibung eines neuen Katheter-systems. Klin. Wochenschr. 1976;54:543–545. doi: 10.1007/BF01468977. - DOI - PubMed