. 2023 Jun 14;9(6):672.
doi: 10.3390/jof9060672.

The COMPASS Complex Regulates Fungal Development and Virulence through Histone Crosstalk in the Fungal Pathogen Cryptococcus neoformans

Affiliations

The COMPASS Complex Regulates Fungal Development and Virulence through Histone Crosstalk in the Fungal Pathogen Cryptococcus neoformans

Ruoyan Liu et al. J Fungi (Basel). .

Abstract

The Complex of Proteins Associated with Set1 (COMPASS) methylates lysine K4 on histone H3 (H3K4) and is conserved from yeast to humans. Its subunits and regulatory roles in the meningitis-causing fungal pathogen Cryptococcus neoformans remain unknown. Here we identified the core subunits of the COMPASS complex in C. neoformans and C. deneoformans and confirmed their conserved roles in H3K4 methylation. Through AlphaFold modeling, we found that Set1, Bre2, Swd1, and Swd3 form the catalytic core of the COMPASS complex and regulate the cryptococcal yeast-to-hypha transition, thermal tolerance, and virulence. The COMPASS complex-mediated histone H3K4 methylation requires H2B mono-ubiquitination by Rad6/Bre1 and the Paf1 complex in order to activate the expression of genes specific for the yeast-to-hypha transition in C. deneoformans. Taken together, our findings demonstrate that putative COMPASS subunits function as a unified complex, contributing to cryptococcal development and virulence.

Keywords: COMPASS; Cryptococcus neoformans; H2B ubiquitination; H3K4 methylation; virulence; yeast-to-hypha transition.


Conflict of interest statement

The authors declare no conflict of interest.

Figures

Figure 1
Figure 1
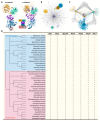
Phylogenetically conserved COMPASS subunits mediate H3K4 methylation in C. deneoformans. (A) A diagram depicting the domain structures of COMPASS subunits in selected fungi, fruit flies, and humans. Cn, Cryptococcus neoformans; Ca, Candida albicans; Af, Aspergillus fumigatus; Fg, Fusarium graminearum; Nc, Neurospora crassa; Sp, Schizosaccharomyces pombe; Sc, Saccharomyces cerevisiae; Dm, Drosophila melanogaster; Hs, Homo sapiens. The domain prediction was done with the InterPro option under the Protein Features menu in FungiDB. (B) Neighbor-joining tree of homologs of COMPASS subunits in selected fungi, fruit flies, and humans, generated based on their predicted protein sequences. Phylogenetic analyses were conducted with the whole-protein sequences with MEGA 7. (C) Western blotting analyses of histone H3K4me1, H3K4me2, and H3K4me3 in the wild-type XL280 strain and COMPASS subunit mutants. The pixel density of protein bands was measured by ImageJ as a gray level. The ratios of anti-H3K4 methylation band intensity over the corresponding band intensity of loading control (anti-H3) were calculated. The ratios of XL280 control were set as 1.0, and the ratios of mutants were normalized accordingly to determine the relative band intensity. (D) Fluorescence analyses of the sub-cellular localization of COMPASS subunits expressing an mNG-tagged version of the corresponding protein in its mutant background.
Figure 2
Figure 2
Set1, Bre2, Spp101, Swd1, Swd2, and Swd3 interact with each other and possibly form the integrated COMPASS complex in C. deneoformans. (A) 3D structural modeling of the catalytic core of COMPASS in C. deneoformans by AlphaFold-Multimer [59]. The yeast COMPASS histone methyltransferase catalytic module (PDB ID: 6chg) consisting of Swd1, Swd3, Bre2, Sdc1, and Set1 served as a comparison [6]. (B) Potential proteins that interact with Set1. A pull-down assay was performed with a strain expressing a FLAG-tagged version of Set1, and potential interacting proteins were identified by MS and visualized with Cytoscape software [60]. (C) Protein-protein interacting network of COMPASS subunits. FLAG-tagged versions of Bre2, Swd1, and Swd3 were used to perform a pull-down assay coupled with MS, respectively. The interacting network was visualized with Cytoscape software [60]. (D) A phylogenetic tree of selected fungi, including both ascomycetes and basidiomycetes. The phylogeny was conducted with the Taxonomy Common Tree tool based on the classification of the NCBI Taxonomy Database [61] and visualized with iTol [62]. The existence of COMPASS subunits for each fungus was indicated on the right. √ indicates the existence of a corresponding subunit; - in red or black indicates not identified based on sequence similarity.
Figure 3
Figure 3
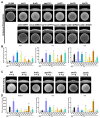
COMPASS subunits regulate virulence traits in C. neoformans. (A) Thermal tolerance spotting assays with wild-type H99 strain and COMPASS subunit mutant strains under indicated conditions. (B) Melanin production spotting assays with wild-type H99 strain and COMPASS subunit mutant strains on L-DOPA media. (C) Titan cell formation assay following the previously published protocol [52]. Cell size was measured using pictures taken in bright field and measured with ImageJ software. Given the relatively uniform cell size in YPD cultures, the size of 60 cells was measured as control, and 300 cells from titan cell-inducing MM condition (MM, 15 mM D-glucose, 10 mM MgSO4, 29.4 mM KH2PO4, 13 mM Glycine, 3.0 μM Thiamine, pH5.5) were measured. Each dot represents a single cell. (D) Indian ink staining of wild-type H99 strain and COMPASS subunit mutant cells grown on the capsule-inducing media. (E) The survival rate of infected G. mellonella. The survival curves were generated with Kaplan–Meier analyses, and the Gehan–Breslow–Wilcoxon test was used for statistical analyses of the survival data between mutant groups and H99 control. ****, p-values < 0.0001; ***, p-values < 0.001. (F) Fungal burden in G. mellonella larvae on day 5 post-infection. G. mellonella larvae were infected with COMPASS subunit mutant strains, the wild-type H99 strain, and PBS control. The one-way ANOVA tests were used in the fungal burden analyses. (G) The lung fungal burden of mice infected with H99 and COMPASS subunit mutants on day 14 post intranasal infection with 1 × 10⁵ cells/animal. The one-way ANOVA tests were used in the fungal burden analyses. ****, p-values < 0.0001; **, p-values < 0.01.
Figure 4
Figure 4
COMPASS subunits regulate the yeast-to-hypha transition in C. deneoformans. (A) Colony morphology of COMPASS subunit mutant strains and the wild-type XL280 strain on V8 media. The overnight cultures cells were washed and resuspended into OD600 = 3, and 3 μL of the resuspension for each strain was spotted onto V8 to monitor the yeast-to-hyphal transition. (B) Transcript levels of ZNF2, CFL1, and FAD1 in cells from COMPASS subunit mutant strains and the wild-type XL280 strain cultured on V8 for 24 h. The transcript level of the corresponding gene from overnight cultures in liquid YPD served as a control for normalization and relative comparison. Three biological replicates were included in all assays. Student’s t-test was used for statistical analyses of corresponding gene transcript levels of mutants relative to that of WT under the V8 condition (the black bar). **** p-values < 0.0001; ** p-values < 0.01; * p-values < 0.05; ns p-values > 0.05. (C) Colony morphology of COMPASS subunit mutants and the wild-type XL280 strain during bilateral mating on V8 media. The overnight cultures of MATα and MATa cells were washed and resuspended into OD600 = 3. The same volume of resuspensions indicating MATα and MATa cells were mixed, and 3 μL of the mixture for each cross was spotted onto V8 to monitor the yeast-to-hyphal transition. (D) Transcript levels of MFα2, STE6, and STE3α in cells from COMPASS subunit mutant strains and the wild-type XL280 strain cultured on V8 for 24 h. The transcript level of corresponding genes from overnight cultures in liquid YPD served as a control for normalization. Three biological replicates were included in all assays. Student’s t-test was used for statistical analyses of corresponding gene transcript levels of mutants relative to that of WT under the V8 condition (the black bar). **** p-values < 0.0001; *** p-values < 0.001; ** p-values < 0.01; ns p-values > 0.05.
Figure 5
Figure 5
COMPASS-mediated H3K4 methylation requires PAF1C-mediated H2Bub1 in C. deneoformans. (A) A diagram depicting the regulatory crosstalk between COMPASS-mediated H3K4 methylation and PAF1C-mediated H2Bub1. Rad6 and Bre1 execute the mono-ubiquitination of H2B in a PAF1C-dependent manner. The catalytic core of the COMPASS complex executes the H3K4 methylation in an H2Bub1-dependent manner. (B) Western blotting analyses of H2Bub1 and H3K4 methylation in cells of RAD6 and COMPASS and PAF1C subunit mutants. (C) Thermal tolerance assays of RAD6 and COMPASS and PAF1C subunit mutant strains. The overnight cultures of cryptococcal cells were washed and resuspended into OD600 = 3. Ten times serial dilutions of the resuspensions were prepared, and 3 μL of the serial dilutions for each strain were spotted onto YPD media and cultured at specified temperatures for two days to monitor growth. (D) Colony morphology of RAD6 and COMPASS and PAF1C subunit mutant strains on V8 media. The overnight cultures cells were washed and resuspended into OD600 = 3, and 3 μL of the resuspension for each strain was spotted onto V8 to monitor the yeast-to-hyphal transition.
Figure 6
Figure 6
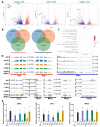
COMPASS subunit Bre2, PAF1C subunit Rtf1, and Rad6 share downstream regulons to promote filamentation in C. deneoformans. (A) Volcano plots of differentially expressed genes in mutants lacking BRE2, RTF1, or RAD6 gene relative to the wild-type strain cultured on V8 media for 24 h. Each dot in the plots indicates a protein-coding gene. The vertical dash lines indicate the |log2FC| = 1, and the horizontal dash line shows the adjusted p-value = 0.05. The differentially up-regulated genes are indicated in red, and the differentially downregulated genes are indicated in blue. Genes related to mating and filamentation were labeled in the panels. (B) Venn diagrams of upregulated and downregulated genes in bre2Δ, rtf1Δ, and rad6Δ mutants. (C) The bubble plot indicates the significantly enriched GO categories of downregulated genes shared by bre2Δ, rtf1Δ, and rad6Δ mutants. (D) Reads coverage of indicated gene loci in bre2Δ, rtf1Δ, and rad6Δ mutants. Reads coverage at H2A-H2B loci in all strains and the complementation strain of bre2Δ served as controls. (E) qPCR quantification of transcript levels of ZNF2, CFL1, and MFα2 in bre2Δ, rtf1Δ, and rad6Δ mutants. Student’s t-test was used for statistical analyses of corresponding gene transcript levels of mutants relative to that of WT under the V8 condition (the black bar). ****, p-values < 0.0001; ***, p-values < 0.001; ** p-values < 0.01; ns, p-values > 0.05.

Similar articles

Cited by

References

    1. Schneider J., Wood A., Lee J.-S., Schuster R., Dueker J., Maguire C., Swanson S.K., Florens L., Washburn M., Shilatifard A. Molecular Regulation of Histone H3 Trimethylation by COMPASS and the Regulation of Gene Expression. Mol. Cell. 2005;19:849–856. doi: 10.1016/j.molcel.2005.07.024. - DOI - PubMed
    1. Roguev A., Schaft D., Shevchenko A., Pijnappel W., Wilm M., Aasland R., Stewart A. The Saccharomyces cerevisiae Set1 complex includes an Ash2 homologue and methylates histone 3 lysine 4. EMBO J. 2001;20:7137–7148. doi: 10.1093/emboj/20.24.7137. - DOI - PMC - PubMed
    1. Takahashi Y.-H., Westfield G.H., Oleskie A.N., Trievel R.C., Shilatifard A., Skiniotis G. Structural analysis of the core COMPASS family of histone H3K4 methylases from yeast to human. Proc. Natl. Acad. Sci. USA. 2011;108:20526–20531. doi: 10.1073/pnas.1109360108. - DOI - PMC - PubMed
    1. He C., Liu N., Xie D., Liu Y., Xiao Y., Li F. Structural basis for histone H3K4me3 recognition by the N-terminal domain of the PHD finger protein Spp1. Biochem. J. 2019;476:1957–1973. doi: 10.1042/BCJ20190091. - DOI - PubMed
    1. Qu Q., Takahashi Y.H., Yang Y., Hu H., Zhang Y., Brunzelle J.S., Couture J.F., Shilatifard A., Skiniotis G. Structure and Conformational Dynamics of a COMPASS Histone H3K4 Methyltransferase Complex. Cell. 2018;174:1117–1126.e12. doi: 10.1016/j.cell.2018.07.020. - DOI - PMC - PubMed

LinkOut - more resources