

Neighborhood Racial Segregation Predict the Spatial Distribution of Supermarkets and Grocery Stores Better than Socioeconomic Factors in Cleveland, Ohio: a Bayesian Spatial Approach
- PMID: 37368191
- PMCID: PMC11236921
- DOI: 10.1007/s40615-023-01669-4
Neighborhood Racial Segregation Predict the Spatial Distribution of Supermarkets and Grocery Stores Better than Socioeconomic Factors in Cleveland, Ohio: a Bayesian Spatial Approach
Abstract
Introduction: The food environment influences the availability and affordability of food options for consumers in a given neighborhood. However, disparities in access to healthy food options exist, affecting Black and low-income communities disproportionately. This study investigated whether racial segregation predicted the spatial distribution of supermarkets and grocery stores better than socioeconomic factors or vice versa in Cleveland, Ohio.
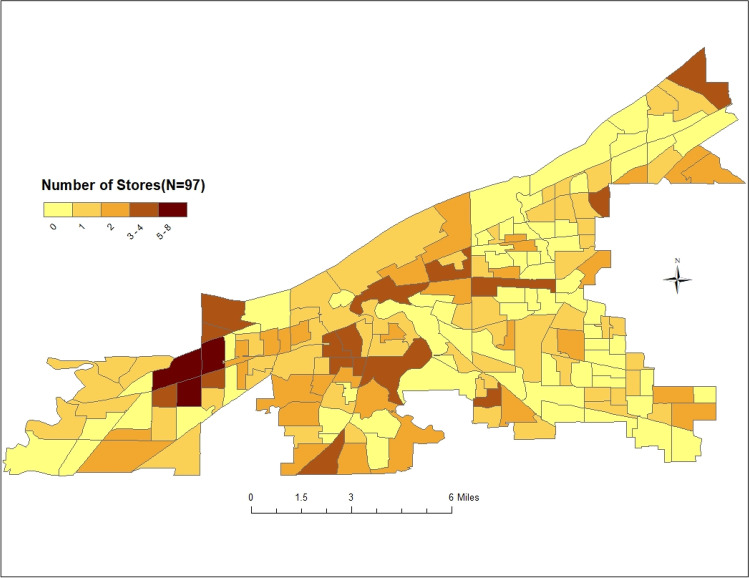
Method: The outcome measure was the count of supermarket and grocery stores in each census tract in Cleveland. They were combined with US census bureau data as covariates. We fitted four Bayesian spatial models. The first model was a baseline model with no covariates. The second model accounted for racial segregation alone. The third model looked at only socioeconomic factors, and the final model combined both racial and socioeconomic factors.
Results: Overall model performance was better in the model that considered only racial segregation as a predictor of supermarkets and grocery stores (DIC = 476.29). There was 13% decrease in the number of stores for a census tract with a higher majority of Black people compared to areas with a lower number of Black people. Model 3 that considered only socioeconomic factors was less predictive of the retail outlets (DIC = 484.80).
Conclusions: These findings lead to the conclusion that structural racism evidenced in policies like residential segregation has a significant influence on the spatial distribution of food retail in the city of Cleveland.
Keywords: Bayesian analysis; Food deserts; Neighborhood food environments; Racial segregation; Spatial analysis.
© 2023. The Author(s).
Conflict of interest statement
The authors declare no competing interests.
Figures


Similar articles
-
The intersection of neighborhood racial segregation, poverty, and urbanicity and its impact on food store availability in the United States.Prev Med. 2014 Jan;58:33-9. doi: 10.1016/j.ypmed.2013.10.010. Epub 2013 Oct 23. Prev Med. 2014. PMID: 24161713 Free PMC article.
-
Brooklyn, New York foodscape 2007-2011: a five-year analysis of stability in food retail environments.Int J Behav Nutr Phys Act. 2013 Apr 9;10:46. doi: 10.1186/1479-5868-10-46. Int J Behav Nutr Phys Act. 2013. PMID: 23570574 Free PMC article.
-
A Spatial Analysis of Obesity: Interaction of Urban Food Environments and Racial Segregation in Chicago.J Urban Health. 2021 Oct;98(5):676-686. doi: 10.1007/s11524-021-00553-y. Epub 2021 Jul 15. J Urban Health. 2021. PMID: 34264475 Free PMC article.
-
Structural racism and geographic access to food retailers in the United States: A scoping review.Health Place. 2023 Sep;83:103089. doi: 10.1016/j.healthplace.2023.103089. Epub 2023 Aug 7. Health Place. 2023. PMID: 37557002
-
Neighborhood disparities in access to healthy foods and their effects on environmental justice.Am J Public Health. 2012 Sep;102(9):1644-54. doi: 10.2105/AJPH.2012.300865. Epub 2012 Jul 19. Am J Public Health. 2012. PMID: 22813465 Free PMC article. Review.
Cited by
-
Association between geospatial disparities in food security with weight loss and nutritional outcomes of metabolic surgery.Surg Endosc. 2024 Nov;38(11):6827-6838. doi: 10.1007/s00464-024-11175-1. Epub 2024 Aug 21. Surg Endosc. 2024. PMID: 39168860 Free PMC article.
-
Perception of the Food Environment and Food Security Levels of Residents of the City of Rio de Janeiro.Int J Environ Res Public Health. 2025 Apr 18;22(4):642. doi: 10.3390/ijerph22040642. Int J Environ Res Public Health. 2025. PMID: 40283863 Free PMC article.
-
Urban highways are barriers to social ties.Proc Natl Acad Sci U S A. 2025 Mar 11;122(10):e2408937122. doi: 10.1073/pnas.2408937122. Epub 2025 Mar 4. Proc Natl Acad Sci U S A. 2025. PMID: 40035764 Free PMC article.
References
-
- Bonanno A. Food deserts: demand, supply, and economic theory. Choices. 2012;27:316-2016-6339.
MeSH terms
LinkOut - more resources
Full Text Sources