. 2023 Jun 15;13(12):1863.
doi: 10.3390/nano13121863.

Experimental, Theoretical and Numerical Studies on Thermal Properties of Lightweight 3D Printed Graphene-Based Discs with Designed Ad Hoc Air Cavities

Affiliations

Experimental, Theoretical and Numerical Studies on Thermal Properties of Lightweight 3D Printed Graphene-Based Discs with Designed Ad Hoc Air Cavities

Giovanni Spinelli et al. Nanomaterials (Basel). .

Abstract

The current state of the art on material science emphasizes recent research efforts aimed at designing novel materials characterized by low-density and advanced properties. The present article reports the experimental, theoretical and simulation results on the thermal behavior of 3D printed discs. Filaments of pure poly (lactic acid) PLA and filled with 6 wt% of graphene nanoplatelets (GNPs) are used as feedstocks. Experiments indicate that the introduction of graphene enhances the thermal properties of the resulting materials since the conductivity passes from the value of 0.167 [W/mK] for unfilled PLA to 0.335 [W/mK] for reinforced PLA, which corresponds to a significantly improvement of 101%. Exploiting the potential of 3D printing, different air cavities have been intentionally designed to develop new lightweight and more cost-effective materials without compromising their thermal performances. Furthermore, some cavities are equal in volume but different in the geometry; it is necessary to investigate how this last characteristic and its possible orientations affect the overall thermal behavior compared to that of an air-free specimen. The influence of air volume is also investigated. Experimental results are supported by theoretical analysis and simulation studies based on the finite element method. The results aim to be a valuable reference resource in the field of design and optimization of lightweight advanced materials.

Keywords: 3D printing (FDM); PLA-based filament; numerical simulation; thermal conductivity.


Conflict of interest statement

The authors declare no conflict of interest.

Figures

Figure 1
Figure 1
Main physical properties of the polymer, graphene nanoplates and manufactured filaments adopted in the present work.
Figure 2
Figure 2
(a) Schematic representation of the simulated case study. (b) Key model definitions adopted for the multiphysics simulations.
Figure 3
Figure 3
Scanning electron microscopy (SEM) analysis of pure PLA in (a) and nanocomposites filled with 6 wt% of GNPs in (b), respectively. A schematic representation of the stacked arrangement of the GNPs is also reported in (b). A micrometer scale is due to the large lateral size (mean diameter) of 2–16 µm of the adopted GNPs.
Figure 4
Figure 4
Experimental results on the thermal conductivity for full samples and those including different shapes of air cavity for pure PLA in (a) and nanocomposites filled with 6 wt% of GNPs in (b), respectively.
Figure 5
Figure 5
Thermal resistance circuits for the evaluation of the parallel and series conductivity in (a) and in (b); geometric parameters and intrinsic properties associated with the different air cavities in (c).
Figure 6
Figure 6
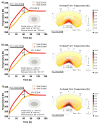
Comparison of the temperature profiles (average values) recorded on the upper, mid and lower surfaces vs. time for composite based on pure PLA and PLA + 6 wt% GNPs in (a) and (b), respectively. In particular, bidimensional graphics are reported on the left part, whereas a 3D view of the corresponding xy-slices (at time t = 60 s) is reported on the right part.
Figure 6
Figure 6
Comparison of the temperature profiles (average values) recorded on the upper, mid and lower surfaces vs. time for composite based on pure PLA and PLA + 6 wt% GNPs in (a) and (b), respectively. In particular, bidimensional graphics are reported on the left part, whereas a 3D view of the corresponding xy-slices (at time t = 60 s) is reported on the right part.
Figure 7
Figure 7
Temperature multislice views evaluated at t = 60 s relatively to pure PLA, and PLA + 6 wt% GNPs in (a) and (b), respectively.
Figure 8
Figure 8
Temperature multislice views (at t = 60 s) of the samples including a variable shape of air cavity such as square in (a), circle in (b) and triangle in (c), respectively. The dynamic temperature evolutions over the time (up to 150 s) for the three different cases are reported in (d).
Figure 9
Figure 9
(a) Thermal conductivity as function of the cavity number for composites based on pure PLA in (a) and PLA + 6 wt% GNPs in (b). A linear fit of the experimental data is reported in (c) and (d) for pure and filled PLA, respectively.
Figure 10
Figure 10
Schematic representation for the specimens filled with multiple air cavities.
Figure 11
Figure 11
(a) Comparison between the experimental and theoretical results, together with the relative error (in percentage) that is committed with the theoretical estimation, about the thermal conductivity as function of the cavity number for composites based on pure PLA in (a) and PLA + 6 wt% in (b).
Figure 12
Figure 12
Temperature multislice views for composites including different number of cavities (1, 2 and 3) in (a), (b) and (c), respectively.
Figure 12
Figure 12
Temperature multislice views for composites including different number of cavities (1, 2 and 3) in (a), (b) and (c), respectively.
Figure 13
Figure 13
Cross sections along the thickness of the sample (left side) on which to detect the average temperature values (right side) at time t = 60 s for samples with a variable number of air cavities.
Figure 14
Figure 14
(a) Thermal conductivity as a function of the radiuses product for composites based on pure PLA in (a) and PLA+6 wt% in (b). A linear fit of the experimental data is reported in (c) and (d) for pure and filled PLA, respectively.
Figure 15
Figure 15
Thermal resistance in circuit in (a) and truncated-conical shape air cavity with geometrical features in (b); geometric parameters and intrinsic properties associated with the truncated-conical air cavities in (c).
Figure 16
Figure 16
(a) Numerical analysis of the temperature evolution of the upper and lower surfaces over the time (up to 150 s) for the 3D printed discs with designed ad hoc air cavities. The case of cylindrical-shaped and truncated-conical cavities with different radiuses are considered on the left side of (a), (b) and (c), respectively. On the respective right-hand parts, sectional views of temperature are shown to visually explore the different heat distribution within the solids.
Figure 17
Figure 17
Experimental results on the thermal conductivity as a function of the air cavity orientation for composites based on pure PLA in (a) and GNPs-based composites in (b).
Figure 18
Figure 18
(a) Cross-section temperature views for the possible orientation of the air cavity: cases for truncated-cone with a large radius of 3.500 mm in (a,b) and for truncated cone with a large radius of 4.000 mm in (c) and (d), respectively.
Figure 19
Figure 19
Temperature evolutions (TMAX, TAVERAGE and TMIN, evaluated on the entire domain) over time up to 150 s (top part of Figure) in the case of an air cavity with a larger base down- and up-oriented in (a) and (b), respectively. The respective inserts show the difference between the two temperatures TMAX–TMIN. In the lower parts of the figure, the 3D sectional views of the overall temperature of the two solids at time t = 60 s are reported.
Figure 20
Figure 20
Selected segments through the entire thickness on which to evaluate the temperature profiles for both orientations of the air cavity in (a) and (b), respectively. The recorded temperatures on these segments are reported in (cf), depending on the case.
Figure 20
Figure 20
Selected segments through the entire thickness on which to evaluate the temperature profiles for both orientations of the air cavity in (a) and (b), respectively. The recorded temperatures on these segments are reported in (cf), depending on the case.
Figure 21
Figure 21
Some selected cross-sections for the evaluation of the temperature differences with respect to the reference level in (a). Numerical results for both possibilities of orientations of the air cavity: with the larger base facing down and up in (b) and (c), respectively.
Figure 22
Figure 22
Change in total internal energy (in all domain) over time (up to 150 s) for both possibilities of orientation of the air cavity: with the larger base facing down and up in (a) and (b), upper sides, respectively. In the corresponding lower parts of the figure, 3D views of the total internal energy at time t = 60 s.

References

    1. Reyno T., Marsden C., Wowk D. Surface damage evaluation of honeycomb sandwich aircraft panels using 3D scanning technology. NDT E Int. 2018;97:11–19. doi: 10.1016/j.ndteint.2018.03.007. - DOI
    1. Sadiq S.E., Bakhy S.H., Jweeg M.J. IOP Conference Series: Materials Science and Engineering. Volume 881. IOP Publishing; Bristol, UK: 2020. Crashworthiness behavior of aircraft sandwich structure with honeycomb core under bending load; p. 012046. No. 1.
    1. Feng C.P., Chen L.B., Tian G.L., Wan S.S., Bai L., Bao R.Y., Yang W. Multifunctional thermal management materials with excellent heat dissipation and generation capability for future electronics. ACS Appl. Mater. Interfaces. 2019;11:18739–18745. doi: 10.1021/acsami.9b03885. - DOI - PubMed
    1. Bicerano J. Prediction of Polymer Properties. 3rd ed. CRC Press; Boca Raton, FL, USA: 2002.
    1. Mark J., Ngai K., Graessley W., Mandelkern L., Samulski E., Wignall G., Koenig J. Physical Properties of Polymers. 3rd ed. Cambridge University Press; New York, NY, USA: 2004.

LinkOut - more resources