

Evaluation of the EsteR Toolkit for COVID-19 Decision Support: Sensitivity Analysis and Usability Study
- PMID: 37368487
- PMCID: PMC10337391
- DOI: 10.2196/44549
Evaluation of the EsteR Toolkit for COVID-19 Decision Support: Sensitivity Analysis and Usability Study
Abstract
Background: During the COVID-19 pandemic, local health authorities were responsible for managing and reporting current cases in Germany. Since March 2020, employees had to contain the spread of COVID-19 by monitoring and contacting infected persons as well as tracing their contacts. In the EsteR project, we implemented existing and newly developed statistical models as decision support tools to assist in the work of the local health authorities.
Objective: The main goal of this study was to validate the EsteR toolkit in two complementary ways: first, investigating the stability of the answers provided by our statistical tools regarding model parameters in the back end and, second, evaluating the usability and applicability of our web application in the front end by test users.
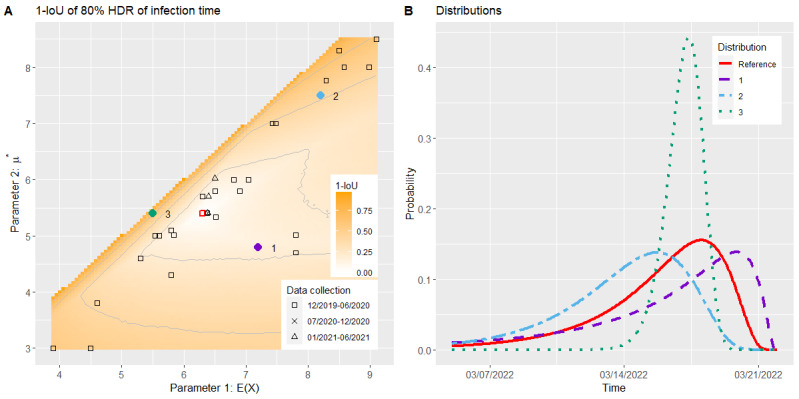
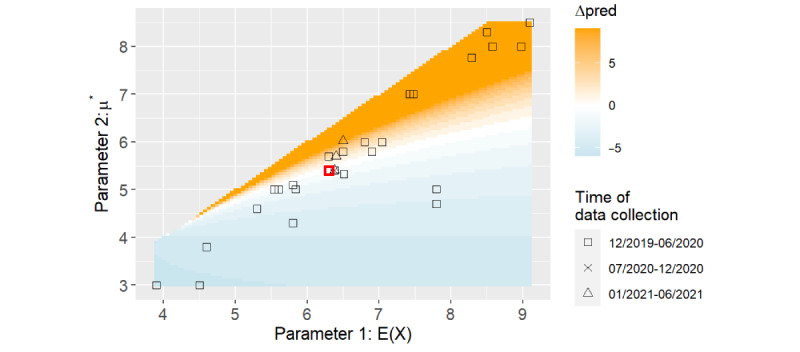
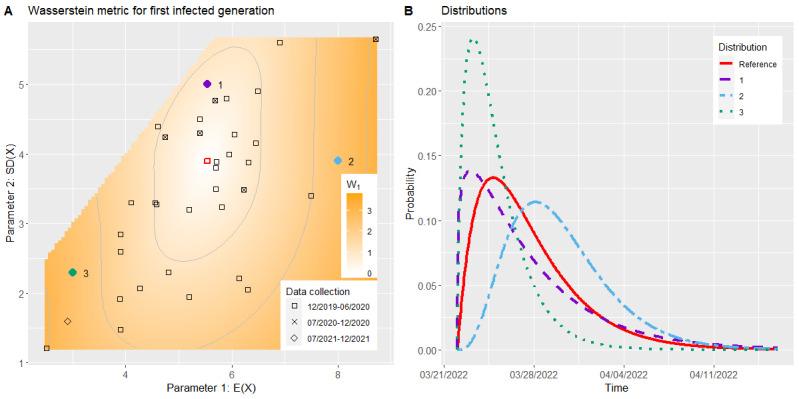
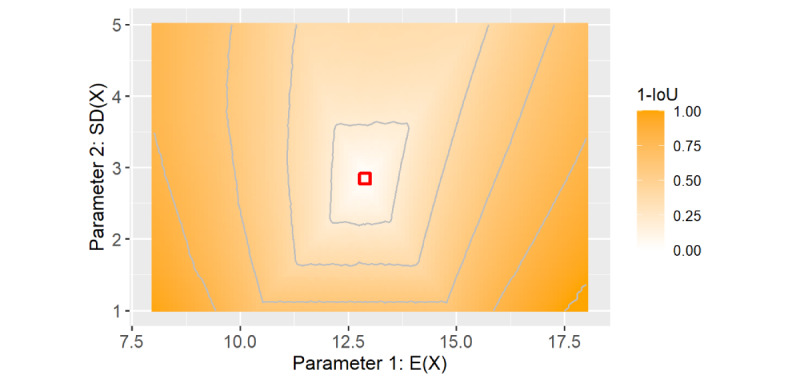
Methods: For model stability assessment, a sensitivity analysis was carried out for all 5 developed statistical models. The default parameters of our models as well as the test ranges of the model parameters were based on a previous literature review on COVID-19 properties. The obtained answers resulting from different parameters were compared using dissimilarity metrics and visualized using contour plots. In addition, the parameter ranges of general model stability were identified. For the usability evaluation of the web application, cognitive walk-throughs and focus group interviews were conducted with 6 containment scouts located at 2 different local health authorities. They were first asked to complete small tasks with the tools and then express their general impressions of the web application.
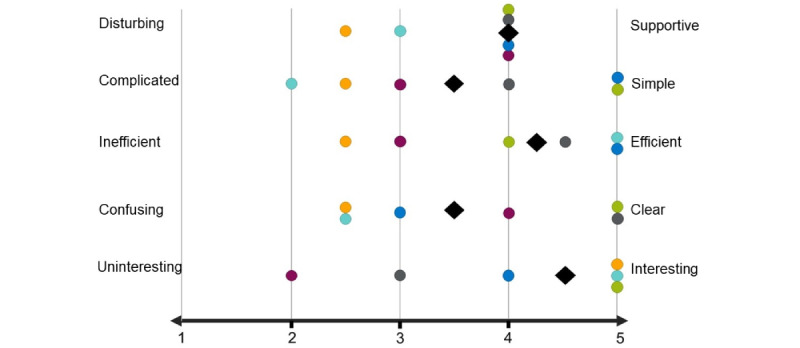
Results: The simulation results showed that some statistical models were more sensitive to changes in their parameters than others. For each of the single-person use cases, we determined an area where the respective model could be rated as stable. In contrast, the results of the group use cases highly depended on the user inputs, and thus, no area of parameters with general model stability could be identified. We have also provided a detailed simulation report of the sensitivity analysis. In the user evaluation, the cognitive walk-throughs and focus group interviews revealed that the user interface needed to be simplified and more information was necessary as guidance. In general, the testers rated the web application as helpful, especially for new employees.
Conclusions: This evaluation study allowed us to refine the EsteR toolkit. Using the sensitivity analysis, we identified suitable model parameters and analyzed how stable the statistical models were in terms of changes in their parameters. Furthermore, the front end of the web application was improved with the results of the conducted cognitive walk-throughs and focus group interviews regarding its user-friendliness.
Keywords: COVID-19; decision support tool; public health; sensitivity analysis; usability study; web application.
©Rieke Alpers, Lisa Kühne, Hong-Phuc Truong, Hajo Zeeb, Max Westphal, Sonja Jäckle. Originally published in JMIR Formative Research (https://formative.jmir.org), 27.06.2023.
Conflict of interest statement
Conflicts of Interest: None declared.
Figures

Similar articles
-
EsteR - A Digital Toolkit for COVID-19 Decision Support in Local Health Authorities.Stud Health Technol Inform. 2022 Aug 17;296:17-24. doi: 10.3233/SHTI220799. Stud Health Technol Inform. 2022. PMID: 36073484
-
Effectiveness and cost-effectiveness of four different strategies for SARS-CoV-2 surveillance in the general population (CoV-Surv Study): a structured summary of a study protocol for a cluster-randomised, two-factorial controlled trial.Trials. 2021 Jan 8;22(1):39. doi: 10.1186/s13063-020-04982-z. Trials. 2021. PMID: 33419461 Free PMC article.
-
App Use and Usability of a Barcode-Based Digital Platform to Augment COVID-19 Contact Tracing: Postpilot Survey and Paradata Analysis.JMIR Public Health Surveill. 2021 Mar 26;7(3):e25859. doi: 10.2196/25859. JMIR Public Health Surveill. 2021. PMID: 33630745 Free PMC article.
-
Evaluating User Experience With a Chatbot Designed as a Public Health Response to the COVID-19 Pandemic in Brazil: Mixed Methods Study.JMIR Hum Factors. 2023 Apr 3;10:e43135. doi: 10.2196/43135. JMIR Hum Factors. 2023. PMID: 36634267 Free PMC article.
-
Development and usability testing of a web-based decision support for users and health professionals in psychiatric services.Psychiatr Rehabil J. 2017 Sep;40(3):293-302. doi: 10.1037/prj0000278. Epub 2017 Jul 24. Psychiatr Rehabil J. 2017. PMID: 28737415
Cited by
-
Human factors methods in the design of digital decision support systems for population health: a scoping review.BMC Public Health. 2024 Sep 10;24(1):2458. doi: 10.1186/s12889-024-19968-8. BMC Public Health. 2024. PMID: 39256672 Free PMC article.
-
[Developments in the digitalization of public health since 2020 : Examples from the Leibniz ScienceCampus Digital Public Health Bremen].Bundesgesundheitsblatt Gesundheitsforschung Gesundheitsschutz. 2024 Mar;67(3):260-267. doi: 10.1007/s00103-023-03827-9. Epub 2024 Jan 10. Bundesgesundheitsblatt Gesundheitsforschung Gesundheitsschutz. 2024. PMID: 38197925 Free PMC article. Review. German.
References
-
- Linden M, Dehning J, Mohr SB, Mohring J, Meyer-Hermann M, Pigeot I, Schöbel A, Priesemann V. Case numbers beyond contact tracing capacity are endangering the containment of COVID-19. Dtsch Arztebl Int. 2020 Nov 13;117(46):790–1. doi: 10.3238/arztebl.2020.0790. https://europepmc.org/abstract/MED/33533714 arztebl.2020.0790 - DOI - PMC - PubMed
-
- Jiang X, Coffee M, Bari A, Wang J, Jiang X, Huang J, Shi J, Dai J, Cai J, Zhang T, Wu Z, He G, Huang Y. Towards an artificial intelligence framework for data-driven prediction of coronavirus clinical severity. Comput Materials Continua. 2020;63(1):537–51. doi: 10.32604/cmc.2020.010691. - DOI
LinkOut - more resources
Full Text Sources
