. 2023 Jul 10;62(27):10613-10625.
doi: 10.1021/acs.inorgchem.3c00871. Epub 2023 Jun 27.

Homoleptic Fe(III) and Fe(IV) Complexes of a Dianionic C3-Symmetric Scorpionate

Affiliations

Homoleptic Fe(III) and Fe(IV) Complexes of a Dianionic C3-Symmetric Scorpionate

Serhii Tretiakov et al. Inorg Chem. .

Abstract

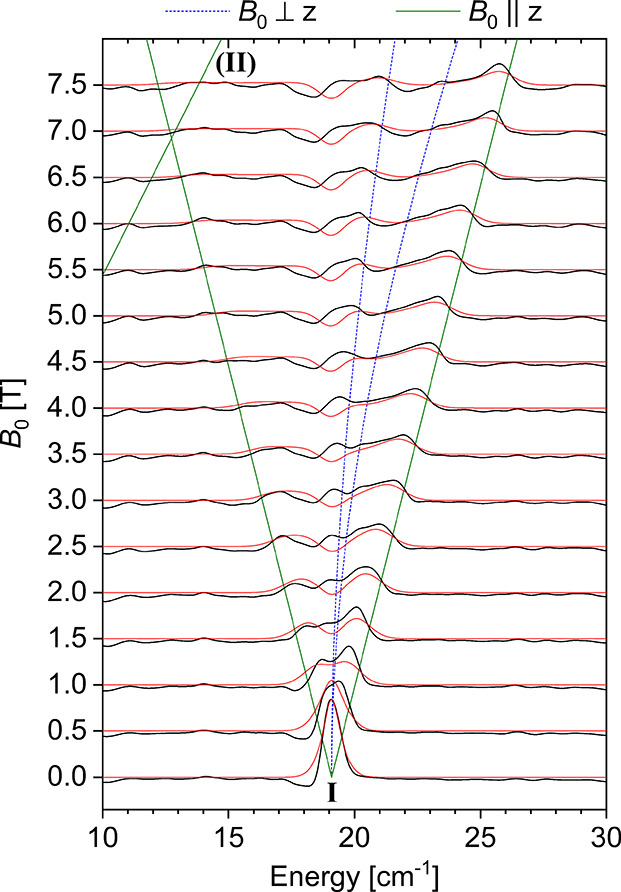
High-valent iron species have been implicated as key intermediates in catalytic oxidation reactions, both in biological and synthetic systems. Many heteroleptic Fe(IV) complexes have now been prepared and characterized, especially using strongly π-donating oxo, imido, or nitrido ligands. On the other hand, homoleptic examples are scarce. Herein, we investigate the redox chemistry of iron complexes of the dianonic tris-skatylmethylphosphonium (TSMP2-) scorpionate ligand. One-electron oxidation of the tetrahedral, bis-ligated [(TSMP)2FeII]2- leads to the octahedral [(TSMP)2FeIII]-. The latter undergoes thermal spin-cross-over both in the solid state and solution, which we characterize using superconducting quantum inference device (SQUID), Evans method, and paramagnetic nuclear magnetic resonance spectroscopy. Furthermore, [(TSMP)2FeIII]- can be reversibly oxidized to the stable high-valent [(TSMP)2FeIV]0 complex. We use a variety of electrochemical, spectroscopic, and computational techniques as well as SQUID magnetometry to establish a triplet (S = 1) ground state with a metal-centered oxidation and little spin delocalization on the ligand. The complex also has a fairly isotropic g-tensor (giso = 1.97) combined with a positive zero-field splitting (ZFS) parameter D (+19.1 cm-1) and very low rhombicity, in agreement with quantum chemical calculations. This thorough spectroscopic characterization contributes to a general understanding of octahedral Fe(IV) complexes.


Conflict of interest statement

The authors declare no competing financial interest.

Figures

Chart 1
Chart 1. Reported Homoleptic Fe(IV) Complexes,,,−
Scheme 1
Scheme 1. Synthesis of Metal Complexes 2a,b, 3a–c, and 4
Figure 1
Figure 1
Molecular structure of complexes 3a and 4 derived from single crystal X-ray diffraction. Displacement ellipsoids are drawn at 30% probability level. Fused benzene rings are shown in a wireframe style for clarity. Counterions, solvent molecules, and hydrogens are omitted for clarity. Selected bond distances (Å) and angles (degrees): 3a: two molecular fragments in an asymmetric unit, fragment 1: Fe1–N11 1.9885(12), Fe1–N21 2.0019(12), Fe1–N31 1.9805(12), N11Fe1N21 91.11(5), N21Fe1N31 90.70(5), N31Fe1N11 90.73(5); fragment 2: Fe2–N12 1.9889(12), Fe2–N22 1.9885(12), Fe2–N32 1.9552(12), N12Fe2N22 91.56(5), N22Fe2N32 90.44(5), N32Fe2N12 91.16(5); 4: molecule has Ci symmetry, Fe1–N1 1.966(5), Fe1–N2 1.975(6), Fe1–N3 1.966(6), N1Fe1N2 91.6(2), N2Fe1N3 91.0(2), N3Fe1N1 90.7(2).
Figure 2
Figure 2
Cyclic voltammograms of compound 2b (ca. 8 mM solution) in 0.1 M nBu4NPF6 acetonitrile electrolyte. Potentials are referenced with respect to the Fc/Fc+ redox couple. Left panel: overview scans at the rate of 100 mV/s; the full scan starts from an open-circuit potential of −2.12 V). Middle panel: UV–vis of independently synthesized compounds 2b, 3a (in MeCN), and 4 (in DCM) and time-dependent UV–vis spectra of controlled electrolysis at points A (−0.64 V) and B (−0.37 V) indicated on the CV on the left panel. Absorption in spectrum B was truncated due to detector saturation. The asterisks indicate isosbestic points that support a clean conversion between 3a and 4. Right panel: the quasi-reversible redox pair AC centered at E1/2 = −0.41 V; the inset shows linear dependence of the peak current vs square root of the scan rate.
Figure 3
Figure 3
SQUID measurement of 3a under an applied magnetic field of 1 T. The dots represent experimental data, and the solid red line the fit with the following parameters: S = 1/2, giso = 2.30, zJ = −6 cm–1; S = 5/2, D = E = 0, giso = 2.00, and TIP = 0.
Figure 4
Figure 4
Zero-field Mössbauer spectrum of 3a measured on a powder sample at 80 K. The fitted parameters are δ = 0.25 mm/s and |ΔEQ| = 1.63 mm/s.
Figure 5
Figure 5
SCO curve for the [(TSMP)2FeIII] (3) complex as obtained by the Evans method in different solvents. Data points represent experimental measurements, whereas smooth curves are fits based on the regressive model in eq 1. Explored temperature ranges are limited by the freezing and boiling points of the respective solvents or precipitation of the compound at low temperatures.
Figure 6
Figure 6
Overlay of CVs measured for 3a and 5a. The measurements were performed in ca. 8 mM solution in 0.1 M nBu4NPF6 acetonitrile electrolyte. Potentials are referenced with respect to the Fc+/Fc redox couple. The onsets of oxidation of 3a and 5a (EB and EB′, respectively) are defined as the points of intersection between extrapolated baseline and a tangent to the oxidation feature B/B′.
Figure 7
Figure 7
Zero-field Mössbauer spectrum of 4 measured on a powder sample at 80 K. The fitted parameters are δ = 0.04 mm/s and |ΔEQ| = 1.96 mm/s.
Figure 8
Figure 8
Experimental (top panel) and simulated (bottom panel) L2,3 edge XAS spectra of the Fe(III) (3a/3) and Fe(IV) (4) complexes.
Figure 9
Figure 9
VT μeff at 0.1 T (top) and VTVH magnetization at 1, 4, and 7 T (bottom) SQUID measurements of 4, fitted using the following spin Hamiltonian parameters: giso = 1.76, D = +15 cm–1, E/D = 0.
Figure 10
Figure 10
THz-EPR spectra of 4. Relative absorbance spectra (black lines) are offset for the magnetic field B0 at which they were measured. Simulations using D = +19.1 cm–1, E = 0, and an isotropic g-value of 1.97 are shown in red. Calculated transition energies for magnetic fields applied parallel and perpendicular to the main anisotropy axis (z) are shown as solid green and dashed blue lines, respectively. Branch II corresponds to the formally forbidden transitions between the excited mS = ±1 sublevels.
Figure 11
Figure 11
Quasi-restricted frontier orbitals (isocontour = 0.05) of the ground state of 4 calculated at the B3LYP-D3BJ/def2-TZVP (CP(PPP) for Fe) level of theory using a geometry optimized at the BP86-D3BJ/def2-TZVP level. Orbital energies are given in parentheses.
Chart 2
Chart 2. Comparison of the Quasi-Restricted Orbital (QRO) Energies of 4 and Its Si-tethered Analogue G Calculated at the B3LYP-D3BJ/def2-TZVP (CP(PPP) for Fe) Level of Theory for a Geometry Optimized at the BP86-D3BJ/def2-TZVP Level
Figure 12
Figure 12
1H (400 MHz) and 2H (61 MHz) NMR spectra of 4 and its deuterated analogue 4-d6 in DCM at 298 K. Only paramagnetic signals are assigned. The integrals are given in blue and were rounded to the nearest integer.
Figure 13
Figure 13
Top panel: variable-temperature 1H NMR (400 MHz) δHFT products of 4 in DCM-d2. Dots show experimental values, straight lines show linear fits (Section S13.3.2). Bottom panel: correlation plots of experimental vs calculated observed chemical shifts for 4 (Section S13.3.3).
Figure 14
Figure 14
Top panel: UV–vis–NIR spectra of complexes 2b, 3b, and 4 in solution at 298 K. Compound 2b was measured in acetonitrile,3b and 4 were measured in DCM. Bottom panel: experimental and TD-DFT-calculated (first 50 excitations) optical spectra of 4. Calculations were performed at the TPSSh-D3BJ/def2-SVP (def2-TZVP for Fe) level of theory in DCM. Gaussian broadening with FWHM of 170 nm was applied.

References

    1. Solomon E. I.; Brunold T. C.; Davis M. I.; Kemsley J. N.; Lee S.-K.; Lehnert N.; Neese F.; Skulan A. J.; Yang Y.-S.; Zhou J. Geometric and Electronic Structure/Function Correlations in Non-Heme Iron Enzymes. Chem. Rev. 2000, 100, 235–350. 10.1021/cr9900275. - DOI - PubMed
    1. Costas M.; Mehn M. P.; Jensen M. P.; Que L. Dioxygen Activation at Mononuclear Nonheme Iron Active Sites: Enzymes, Models, and Intermediates. Chem. Rev. 2004, 104, 939–986. 10.1021/cr020628n. - DOI - PubMed
    1. Nam W. High-Valent Iron(IV)–Oxo Complexes of Heme and Non-Heme Ligands in Oxygenation Reactions. Acc. Chem. Res. 2007, 40, 522–531. 10.1021/ar700027f. - DOI - PubMed
    1. Groves J. T. High-Valent Iron in Chemical and Biological Oxidations. J. Inorg. Biochem. 2006, 100, 434–447. 10.1016/j.jinorgbio.2006.01.012. - DOI - PubMed
    1. Que L.; Tolman W. B. Biologically Inspired Oxidation Catalysis. Nature 2008, 455, 333–340. 10.1038/nature07371. - DOI - PubMed