. 2023 Sep 28;142(13):1113-1130.
doi: 10.1182/blood.2023019721.

IL-7 receptor signaling drives human B-cell progenitor differentiation and expansion

Affiliations

IL-7 receptor signaling drives human B-cell progenitor differentiation and expansion

Fabian M P Kaiser et al. Blood. .

Abstract

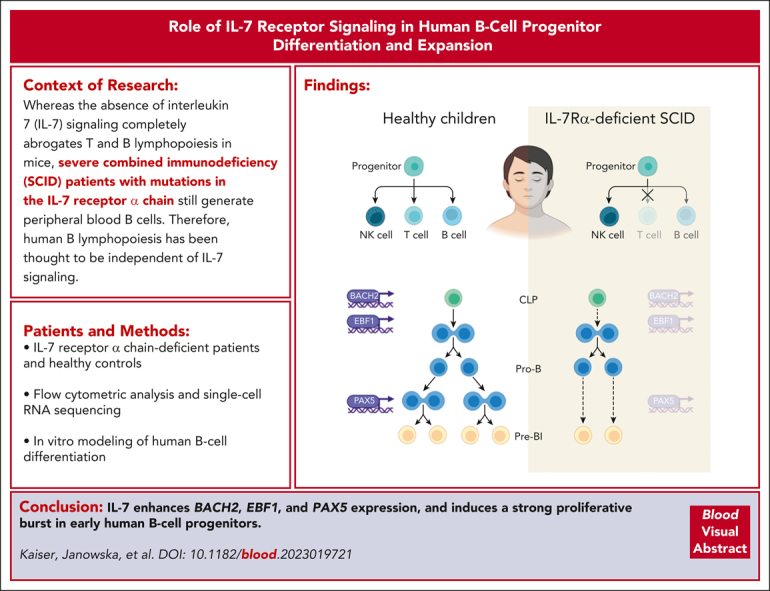
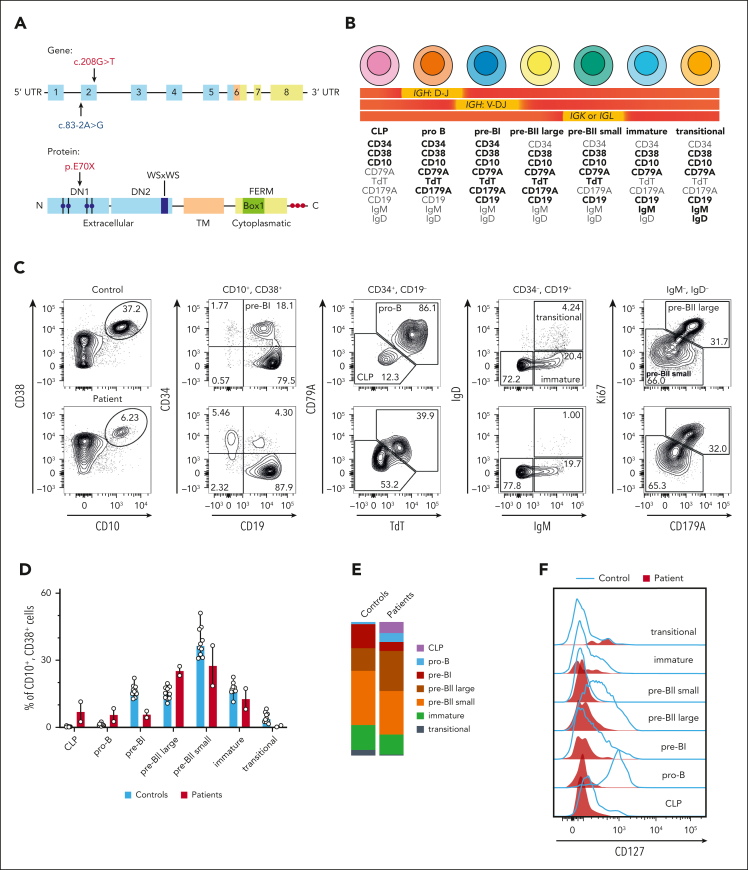
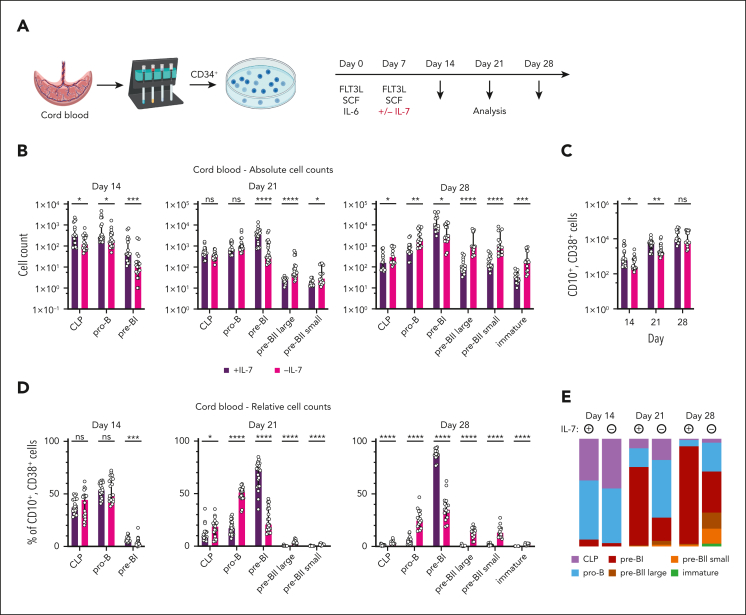
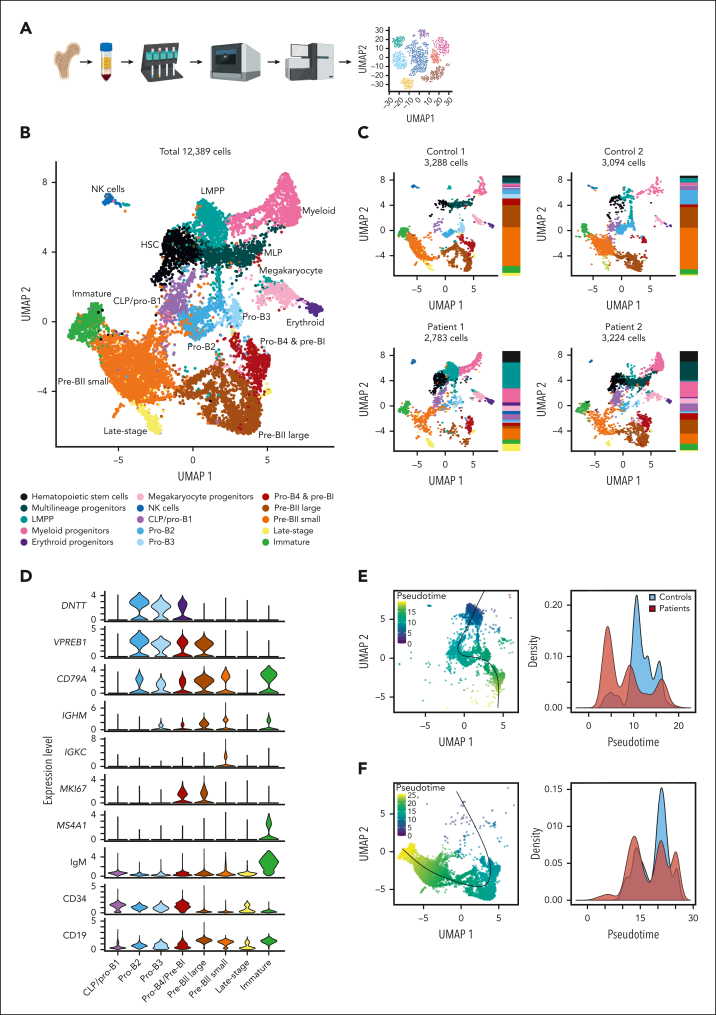
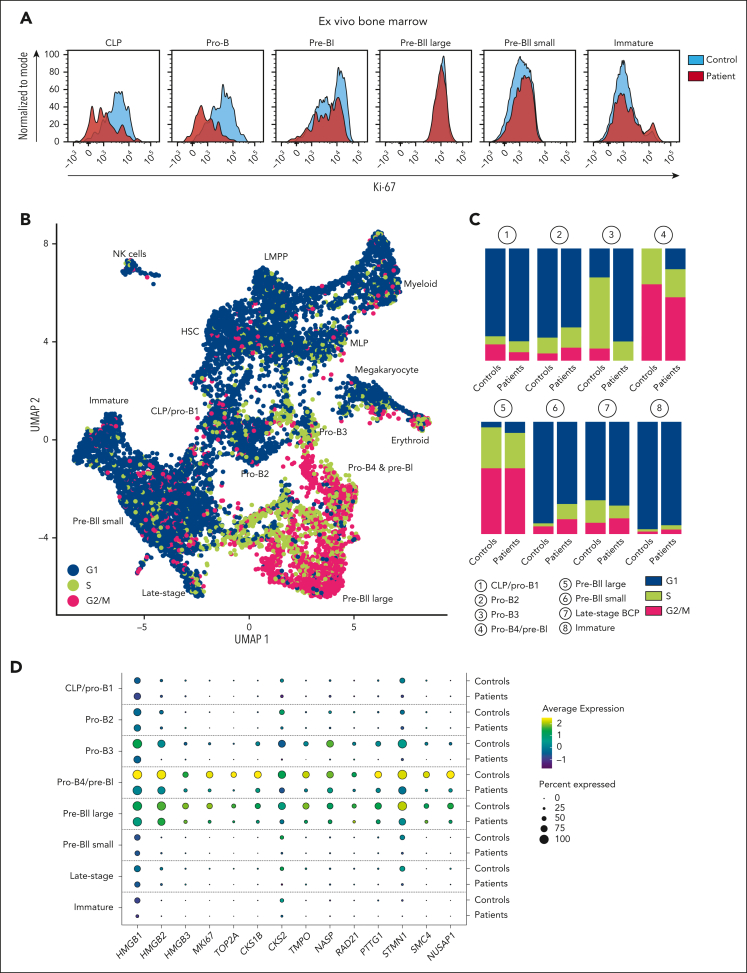
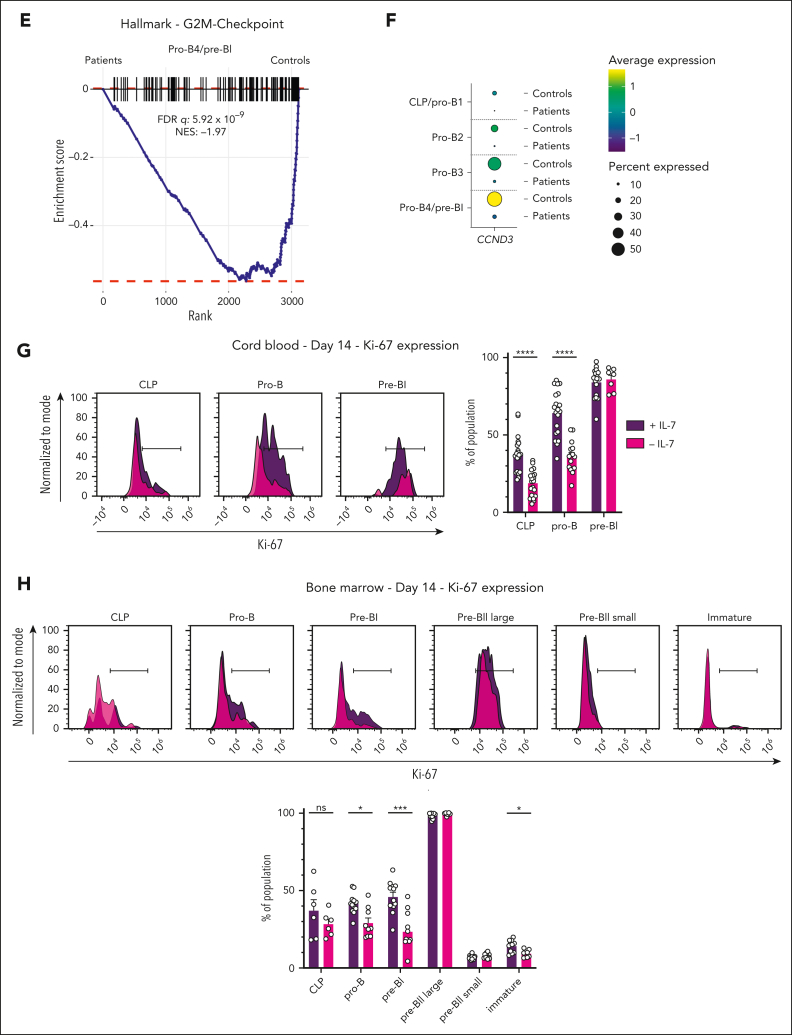
Although absence of interleukin-7 (IL-7) signaling completely abrogates T and B lymphopoiesis in mice, patients with severe combined immunodeficiency caused by mutations in the IL-7 receptor α chain (IL-7Rα) still generate peripheral blood B cells. Consequently, human B lymphopoiesis has been thought to be independent of IL-7 signaling. Using flow cytometric analysis and single-cell RNA sequencing of bone marrow samples from healthy controls and patients who are IL-7Rα deficient, in combination with in vitro modeling of human B-cell differentiation, we demonstrate that IL-7R signaling plays a crucial role in human B lymphopoiesis. IL-7 drives proliferation and expansion of early B-cell progenitors but not of pre-BII large cells and has a limited role in the prevention of cell death. Furthermore, IL-7 guides cell fate decisions by enhancing the expression of BACH2, EBF1, and PAX5, which jointly orchestrate the specification and commitment of early B-cell progenitors. In line with this observation, early B-cell progenitors of patients with IL-7Rα deficiency still expressed myeloid-specific genes. Collectively, our results unveil a previously unknown role for IL-7 signaling in promoting the B-lymphoid fate and expanding early human B-cell progenitors while defining important differences between mice and humans. Our results have implications for hematopoietic stem cell transplantation strategies in patients with T- B+ severe combined immunodeficiency and provide insights into the role of IL-7R signaling in leukemogenesis.


Conflict of interest statement

Conflict-of-interest disclosure: The authors declare no competing financial interests.

Figures

None
Graphical abstract
Figure 1.
Figure 1.
IL-7Rα deficiency impairs the differentiation and expansion of early BCPs. (A) Overview of the IL-7Rα chain with the individual domains and motifs highlighted as shown in the figure. Top graph shows the gene with exons marked as boxes; bottom graph shows the protein. Extracellular domain (blue) with fibronectin type 3–like domains DN1 and DN2 and 4 paired cysteine residues indicated by blue circles as well as WS × WS motif; transmembrane domain (orange); intracellular domain (yellow) with four-point-one protein, ezrin, radixin, moesin (FERM) domain, BOX1 domain, and 3 tyrosine residues indicated by red circles. The mutations of the 2 patients are indicated by arrows. One patient had a homozygous premature nonsense mutation (red), whereas the other patient had a heterozygous splice acceptor site mutation (blue) and a chromosomal deletion of the other allele. (B) Markers used for the definition of the human BCP populations with the corresponding stages of V(D)J recombination. Markers that are strongly expressed by the given population are depicted in bold, whereas a lack of expression is shown in gray. (C) Flow cytometric analysis of the BCP stages in the BM, shown for 1 representative pediatric control and 1 patient. (D) Relative cell counts of the BCP stages in pediatric controls (n = 10) and the 2 patients with IL-7Rα deficiency. Data show median with range. (E) Distribution of BCP stages in pediatric controls (n = 10) and the 2 patients with IL-7Rα deficiency. Data show the median of each population. (F) Expression of the IL-7Rα chain (CD127) on the individual human BCP subsets in the BM of a healthy pediatric control compared with a patient with IL-7Rα deficiency. UTR, untranslated region.
Figure 2.
Figure 2.
In vitro modeling of human B lymphopoiesis recapitulates aberrant differentiation and expansion of early BCPs in the absence of IL-7. (A) In vitro differentiation of human BCPs with CB-derived CD34+ hematopoietic progenitor cells. Mononuclear cells were purified via Ficoll density centrifugation and CD34+ progenitor cells were isolated by positive selection using magnetic-activated cell sorting. CD34+ cells were stimulated with FMS-like tyrosine kinase 3 ligand (FLT3L), stem cell factor (SCF), and IL-6 after isolation and restimulated with FLT3L and SCF on day 7, with IL-7 being added to the control samples. Cells were harvested on days 14, 21, and 28 after initiation of cultures for analysis. (B-E) Absolute (B-C) and relative (D) cell counts and distribution of BCP stages (E) of in vitro differentiated BCPs on days 14, 21, and 28. Data show the median, with error bars representing the interquartile range for panels B-D and the median only of each population for panel E. Statistical analysis was performed with multiple Mann-Whitney tests and corrected for multiple comparisons with the Holm-Šídák method for data shown in panels B-D (n = 7, each with 2-5 replicates). P values are denoted as follows: ∗P < .05; ∗∗P < .01; ∗∗∗P < .001;∗∗∗∗P < .0001. ns, not significant.
Figure 3.
Figure 3.
scRNA-seq recapitulates aberrant differentiation of early BCPs in patients with IL-7Rα deficiency. (A) Preparation of the scRNA-seq data set. Mononuclear cells of BM samples of 2 healthy pediatric donors and 2 patients with IL-7Rα deficiency were isolated via Ficoll density centrifugation, depleted of dead cells, stained with CITE-seq antibodies, and enriched for BCPs using magnetic-activated cell sorting before preparing the single-cell library according to the 10x Chromium protocol, followed by sequencing using Illumina technology. (B) UMAP plot showing the distribution of the individual clusters of the entire data set of patient and control samples. (C) Individual UMAP plots showing the clusters and their distribution in the adjacent panel for each control and patient. Color coding is identical to that in panel B. (D) Violin plots showing the expression of the B-cell markers used for the annotation of the individual B-cell clusters. Bottom 3 panels represent CITE-seq markers. (E-F) Pseudotime analysis for the early (E) and late (F) BCP subsets. Left panels in panels C,E-F show pseudotime calculated as described in “Methods” and plotted on the UMAP of the respective data set; right panels show comparison of pseudotime values for controls vs patients. Black lines in the left plots in panels E-F denote the trajectories.
Figure 4.
Figure 4.
IL-7 signaling induces proliferation of early BCP but does not profoundly affect proliferation of pre-BII large cells. (A) Flow cytometric quantification of Ki-67 expression in individual BM BCP populations in controls vs patients, shown for 1 representative control and 1 patient. (B) Cells were assigned to the different cell cycle phases as described in "Methods.” UMAP plot of the entire combined data set of controls and patients, showing the cell cycle phase of each cell (blue: G1; green: S phase; and pink: G2/M phase). (C) Distribution of cell cycle phases per cluster shown for controls vs patients. Bars indicate percentages per cluster. (D) Dot plot showing expression of proliferation markers for individual clusters in controls vs patients. (E) GSEA analysis with the G2M hallmark gene set performed for the pro-B4/pre-BI cluster with the differentially expressed genes between patients and controls, showing enrichment of the gene set in the controls. (F) Dot plot showing expression of CCND3 in early BCP clusters in controls vs patients. (G-H) Flow cytometric quantification of Ki-67 expression in individual BCP populations in IL-7 stimulated vs unstimulated CB (G) and BM (H) cultures. The black bar denotes gate for positive cells. Bar graphs show mean with error bars representing standard error of the mean. Statistical analysis was performed with multiple unpaired t tests and corrected for multiple comparisons with the Holm-Šídák method. All replicates are shown (CB: n = 7, each with 2-5 replicates; BM: n = 3, each with 3-6 replicates). P values are denoted as follows: ∗P < .05; ∗∗∗P < .001; ∗∗∗∗P < .0001.
Figure 4.
Figure 4.
IL-7 signaling induces proliferation of early BCP but does not profoundly affect proliferation of pre-BII large cells. (A) Flow cytometric quantification of Ki-67 expression in individual BM BCP populations in controls vs patients, shown for 1 representative control and 1 patient. (B) Cells were assigned to the different cell cycle phases as described in "Methods.” UMAP plot of the entire combined data set of controls and patients, showing the cell cycle phase of each cell (blue: G1; green: S phase; and pink: G2/M phase). (C) Distribution of cell cycle phases per cluster shown for controls vs patients. Bars indicate percentages per cluster. (D) Dot plot showing expression of proliferation markers for individual clusters in controls vs patients. (E) GSEA analysis with the G2M hallmark gene set performed for the pro-B4/pre-BI cluster with the differentially expressed genes between patients and controls, showing enrichment of the gene set in the controls. (F) Dot plot showing expression of CCND3 in early BCP clusters in controls vs patients. (G-H) Flow cytometric quantification of Ki-67 expression in individual BCP populations in IL-7 stimulated vs unstimulated CB (G) and BM (H) cultures. The black bar denotes gate for positive cells. Bar graphs show mean with error bars representing standard error of the mean. Statistical analysis was performed with multiple unpaired t tests and corrected for multiple comparisons with the Holm-Šídák method. All replicates are shown (CB: n = 7, each with 2-5 replicates; BM: n = 3, each with 3-6 replicates). P values are denoted as follows: ∗P < .05; ∗∗∗P < .001; ∗∗∗∗P < .0001.
Figure 5.
Figure 5.
IL-7Rα signaling stimulates the B-lymphoid fate and represses AP-1 transcription factors. (A) Expression of BACH2, EBF1, PAX5, CD74, and CXCR4 plotted across the pseudotime of the early BCP subset as shown for controls and patients. (B) Dot plots showing expression of the EBF1 and PAX5 target genes CD79A, CD79B, VPREB1, and IGLL1 in early BCP clusters in controls vs patients. (C) Flow cytometric quantification of PAX5, CD79A, and CD19 expression in indicated BCP populations in the BM of controls and patients. (D) Heatmap showing expression of myeloid and lymphoid genes in early BCP clusters with unsupervised clustering. (E-H) Flow cytometric quantification of EBF1 (E), PAX5 (F), cytoplasmic CD79A (G), and CD19 (H) expression in individual BCP populations in IL-7–stimulated vs unstimulated BM cultures at day 14. Representative histograms are shown in supplemental Figure 6. Bar graphs show the median with interquartile range (E,G-H) or mean with standard error of the mean (F). Statistical analysis was performed with multiple Mann-Whitney tests (E,G-H) or unpaired t tests (F) and corrected for multiple comparisons with the Holm-Šídák method. Data collected from 3 experiments with 3 different BM donors. All replicates are shown (n = 3 BM samples, each with 3 or 6 replicates). (I) Violin plots showing expression of JUN and FOS family members across all clusters in patients vs controls. P values are denoted as follows: ∗∗P < .01; ∗∗∗P < .001; ∗∗∗∗P < .0001.
Figure 5.
Figure 5.
IL-7Rα signaling stimulates the B-lymphoid fate and represses AP-1 transcription factors. (A) Expression of BACH2, EBF1, PAX5, CD74, and CXCR4 plotted across the pseudotime of the early BCP subset as shown for controls and patients. (B) Dot plots showing expression of the EBF1 and PAX5 target genes CD79A, CD79B, VPREB1, and IGLL1 in early BCP clusters in controls vs patients. (C) Flow cytometric quantification of PAX5, CD79A, and CD19 expression in indicated BCP populations in the BM of controls and patients. (D) Heatmap showing expression of myeloid and lymphoid genes in early BCP clusters with unsupervised clustering. (E-H) Flow cytometric quantification of EBF1 (E), PAX5 (F), cytoplasmic CD79A (G), and CD19 (H) expression in individual BCP populations in IL-7–stimulated vs unstimulated BM cultures at day 14. Representative histograms are shown in supplemental Figure 6. Bar graphs show the median with interquartile range (E,G-H) or mean with standard error of the mean (F). Statistical analysis was performed with multiple Mann-Whitney tests (E,G-H) or unpaired t tests (F) and corrected for multiple comparisons with the Holm-Šídák method. Data collected from 3 experiments with 3 different BM donors. All replicates are shown (n = 3 BM samples, each with 3 or 6 replicates). (I) Violin plots showing expression of JUN and FOS family members across all clusters in patients vs controls. P values are denoted as follows: ∗∗P < .01; ∗∗∗P < .001; ∗∗∗∗P < .0001.
Figure 6.
Figure 6.
IL-7Rα deficiency increases IGH repertoire clonality. (A-B) Heatmaps showing distribution of V and D genes (A) and D and J genes (B) in IGH repertoire of a representative control and patient. Data show relative values determined by dividing the log of the frequency count of a given gene by the maximum, in order to normalize between 0 and 1. The amount of sequences is indicated above each heatmap. (C) Clonality score of IGH repertoire in healthy, age-matched controls (n = 3) and the patients with IL-7Rα deficiency (n = 2) as defined by Boyd et al. Data shown as median with range.
Figure 6.
Figure 6.
IL-7Rα deficiency increases IGH repertoire clonality. (A-B) Heatmaps showing distribution of V and D genes (A) and D and J genes (B) in IGH repertoire of a representative control and patient. Data show relative values determined by dividing the log of the frequency count of a given gene by the maximum, in order to normalize between 0 and 1. The amount of sequences is indicated above each heatmap. (C) Clonality score of IGH repertoire in healthy, age-matched controls (n = 3) and the patients with IL-7Rα deficiency (n = 2) as defined by Boyd et al. Data shown as median with range.

Comment in

References

    1. Cordeiro Gomes A, Hara T, Lim VY, et al. Hematopoietic stem cell niches produce lineage-instructive signals to control multipotent progenitor differentiation. Immunity. 2016;45(6):1219–1231. - PMC - PubMed
    1. Grabstein KH, Waldschmidt TJ, Finkelman FD, et al. Inhibition of murine B and T lymphopoiesis in vivo by an anti-interleukin 7 monoclonal antibody. J Exp Med. 1993;178(1):257–264. - PMC - PubMed
    1. Peschon JJ, Morrissey PJ, Grabstein KH, et al. Early lymphocyte expansion is severely impaired in interleukin 7 receptor-deficient mice. J Exp Med. 1994;180(5):1955–1960. - PMC - PubMed
    1. von Freeden-Jeffry U, Vieira P, Lucian LA, McNeil T, Burdach SE, Murray R. Lymphopenia in interleukin (IL)-7 gene-deleted mice identifies IL-7 as a nonredundant cytokine. J Exp Med. 1995;181(4):1519–1526. - PMC - PubMed
    1. Miller JP, Izon D, DeMuth W, Gerstein R, Bhandoola A, Allman D. The earliest step in B lineage differentiation from common lymphoid progenitors is critically dependent upon interleukin 7. J Exp Med. 2002;196(5):705–711. - PMC - PubMed

Publication types