. 2023 Nov:114:511-522.
doi: 10.1016/j.bbi.2023.06.021. Epub 2023 Jun 25.

Spatial enrichment of the type 1 interferon signature in the brain of a neuropsychiatric lupus murine model

Affiliations

Spatial enrichment of the type 1 interferon signature in the brain of a neuropsychiatric lupus murine model

Ernest Aw et al. Brain Behav Immun. 2023 Nov.

Erratum in

Abstract

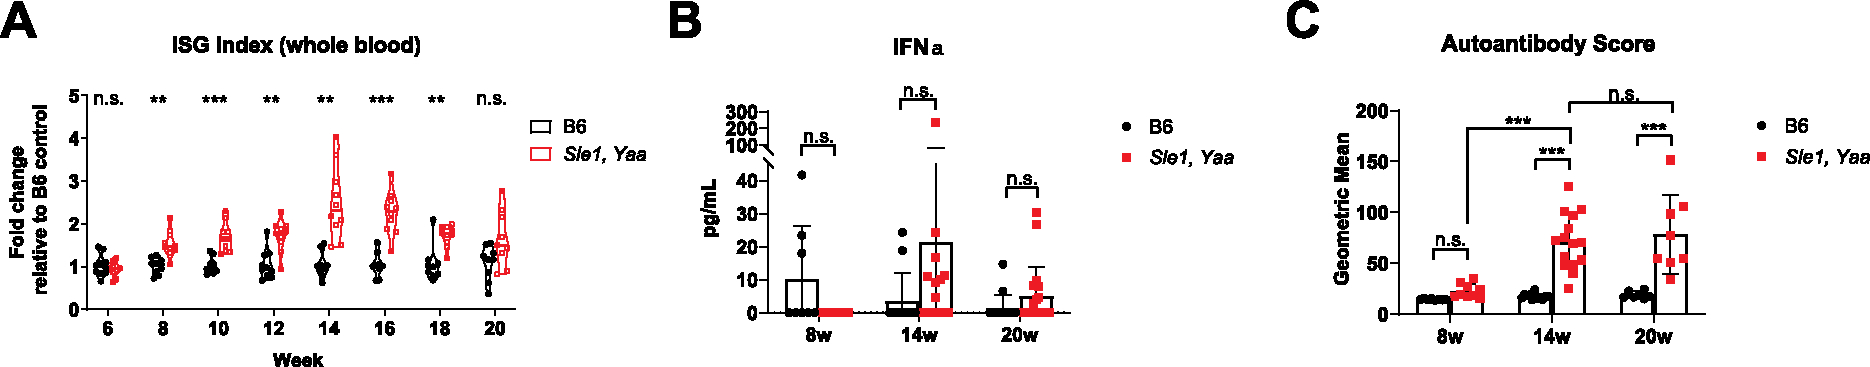
Among systemic lupus erythematosus (SLE) patients, neuropsychiatric symptoms are highly prevalent, being observed in up to 80% of adult and 95% of pediatric patients. Type 1 interferons, particularly interferon alpha (IFNα), have been implicated in the pathogenesis of SLE and its associated neuropsychiatric symptoms (NPSLE). However, it remains unclear how type 1 interferon signaling in the central nervous system (CNS) might result in neuropsychiatric sequelae. In this study, we validate an NPSLE mouse model and find an elevated peripheral type 1 interferon signature alongside clinically relevant NPSLE symptoms such as anxiety and fatigue. Unbiased single-nucleus sequencing of the hindbrain and hippocampus revealed that interferon-stimulated genes (ISGs) were among the most highly upregulated genes in both regions and that gene pathways involved in cellular interaction and neuronal development were generally repressed among astrocytes, oligodendrocytes, and neurons. Using image-based spatial transcriptomics, we found that the type 1 interferon signature is enriched as spatially distinct patches within the brain parenchyma of these mice. Our results suggest that type 1 interferon in the CNS may play an important mechanistic role in mediating NPSLE behavioral phenotypes by repressing general cellular communication pathways, and that type 1 interferon signaling modulators are a potential therapeutic option for NPSLE.

Keywords: Glial cells; Interferon alpha (IFNα); Interferon-stimulated gene (ISG); Neuropsychiatric; Single-nucleus sequencing; Spatial transcriptomics.


Conflict of interest statement

Declaration of Competing Interest The authors declare that they have no known competing financial interests or personal relationships that could have appeared to influence the work reported in this paper.

Figures

Fig. 1.
Fig. 1.. Temporal profiling of peripheral autoimmune correlates in the Sle1,Yaa mouse model.
(A) Age matched B6 and Sle1,Yaa male mice were serially bled every 2 weeks starting from 6 weeks of age (N = 10 per group). The peripheral blood ISG index was calculated using the geometric mean of ΔΔCt normalized gene expression values of the following ISGs: Mx1, Ifit3, Oas2, Isg15, and Rsad2. 1 B6 mouse died at week 14, and 1 Sle1,Yaa mouse died at week 20; data points for these mice were included in statistical analyses up until the point of death. Statistics were calculated with two-way fixed effects ANOVA, and post hoc comparisons were corrected using Sidak’s method. (B) Serum IFNα was assessed across the 8 week (N = 8, B6; N = 9, Sle1,Yaa), 14 week (N = 12, B6; N = 15, Sle1,Yaa), and 20 week (N = 15, B6; N = 19, Sle1,Yaa) age groups. Statistics were calculated with two-way fixed effects ANOVA, and post hoc comparisons were corrected using Tukey’s method. (C) Serum autoantibody titers targeting 19 different autoantigens were assessed across the 8 week (N = 8, B6; N = 9, Sle1,Yaa), 14 week (N = 12, B6; N = 15, Sle1,Yaa), and 20 week (N = 7, B6; N = 8, Sle1,Yaa) age groups. The autoantibody score was computed by taking the geometric mean of MFI values across 19 autoantigens per sample. Statistics were calculated with two-way fixed effects ANOVA, and post hoc comparisons were corrected using Sidak’s method. n.s., p > 0.05; *, p < 0.05; **, p < 0.01; ***, p < 0.001.
Fig. 2.
Fig. 2.
Anxiety- and fatigue-like behavioral phenotypes in the Sle1,Yaa mouse model. (A) The bright open field test measures anxiety by the exploratory behavior of the subject in the brightly lit center of an open field enclosure as opposed to its periphery. Sle1,Yaa mice moved and spent less time in the brightly lit center field. (B) The light–dark box test measures anxiety by the exploratory behavior of the subject in the brightly lit half of an enclosure as opposed to the dark, covered half. Sle1, Yaa mice displayed less exploratory behavior in the brightly lit half of the box. (C) The locomotor test measures general exploratory behavior in a low stress environment. Sle1,Yaa mice displayed less locomotive and vertical exploratory behavior compared to B6 controls. (D) The rotarod test measures general motor function abilities. Sle1,Yaa mice showed decreased ability to stay on the accelerating rod compared to B6 controls. (E) The grip strength test measures general muscular strength. Sle1,Yaa mice displayed increased muscular weakness compared to B6 controls. (F) The treadmill fatigue test measures the exercise induced fatigue threshold. Sle1,Yaa mice showed an increased propensity to fatigue compared to B6 controls. Post-exercise lactate levels did not show any differences, suggesting that the fatigue-like phenotype is unlikely to be driven by muscular deficiencies, but possibly neuroinflammatory factors. Extrapolating from the well-established 3-zone exercise intensity threshold for humans (Seiler and Tønnessen, 2009), and based on our own experience, the mice did not reach the limit of their aerobic capacity; exceeding this limit would have resulted in a sharp spike of blood lactate above 10 mM as mice switched to anaerobic glycolysis. Sample sizes are as follows: B6 (N = 18), Sle1,Yaa (N = 17) for (A) – (E); B6 (N = 11), Sle1,Yaa (N = 12) for (F). Data were analyzed using either Student’s t test or Mann-Whitney U test, assessed by normality of data distribution. n.s., p > 0.05; *, p < 0.05; **, p < 0.01; ***, p < 0.001.
Fig. 3.
Fig. 3.
Upregulation of the type 1 interferon response across all CNS cell types. (A) UMAP plot for all major cell classes within the hindbrain and hippocampus, with cell types colored by cluster. (B) UMAP plots of the hindbrain, separated by genotype and colored by the ISG expression index. (C) UMAP plots of the hippocampus, separated by genotype and colored by the ISG expression index. (D) Volcano plots showing DEGs in the hindbrain and hippocampus between the B6 and Sle1,Yaa genotypes. ISGs were defined by querying the DE gene list with the Interferome database (Rusinova et al., 2013). Dotted lines delineate Log2 Fold Change > 1.32 and −Log10q > 3.
Fig. 4.
Fig. 4.. Spatially enriched patches of ISGs in the brain parenchyma of Sle1,Yaa mice.
(A) Uniform manifold approximation and projection (UMAP) plot for all major cell classes within the brain parenchyma, with cell types colored by cluster. (B) Volcano plot showing DEGs between all cell classes of the B6 and Sle1,Yaa genotypes. Genes belonging to the ISG class of genes are highlighted. UMAP plots comparing the ISG signature in B6 and Sle1,Yaa mice (N = 2 per group), with clear enrichment in the Sle1,Yaa group. Statistically significant (q < 0.05) genes that were part of the a priori defined library of ISGs were identified, and the geometric mean (ISG index) of normalized count expression across these genes was computed on a per-cell basis. ISG index-high gene expression appeared to be enriched in the vascular compartment as well as in glial cells such as astrocytes, microglia, and oligodendrocytes. (C) Spatial plots of the ISG index across each individual sample, showing clustered patches of ISG index-high cells in the Sle1,Yaa mice. (D) Tiled confocal images of RNAscope in situ hybridized Ifit3 probe in independent 14 week old B6 and Sle1,Yaa samples, showing spatial patches in the Sle1,Yaa genotype and validating the MERFISH observations.

Update of

References

    1. Ahn GE, Ramsey-Goldman R, 2012. Fatigue in systemic lupus erythematosus. Int. J. Clin. Rheumtol. 7 (2), 217–227. - PMC - PubMed
    1. Almeida RG, 2018. The Rules of Attraction in Central Nervous System Myelination. Front. Cell, Neurosci, p. 12. - PMC - PubMed
    1. Arriaga M, Han EB, 2017. Dedicated hippocampal inhibitory networks for locomotion and immobility. J. Neurosci. 37 (38), 9222–9238. - PMC - PubMed
    1. Aw E, Zhang Y, Carroll M, 2020. Microglial responses to peripheral type 1 interferon. J. Neuroinflammation 17, 340. - PMC - PubMed
    1. Aw E, Zhang Y, Yalcin E, Herrmann US, Carroll MC, 2021. Neuropsychiatric disorders: an immunological perspective. In Advances in Immunology 83–155. - PubMed

Publication types

Substances