. 2023 Oct;622(7983):584-593.
doi: 10.1038/s41586-023-06368-y. Epub 2023 Jun 27.

Pluripotent stem cell-derived model of the post-implantation human embryo

Affiliations

Pluripotent stem cell-derived model of the post-implantation human embryo

Bailey A T Weatherbee et al. Nature. 2023 Oct.

Erratum in

Abstract

The human embryo undergoes morphogenetic transformations following implantation into the uterus, but our knowledge of this crucial stage is limited by the inability to observe the embryo in vivo. Models of the embryo derived from stem cells are important tools for interrogating developmental events and tissue-tissue crosstalk during these stages1. Here we establish a model of the human post-implantation embryo, a human embryoid, comprising embryonic and extraembryonic tissues. We combine two types of extraembryonic-like cell generated by overexpression of transcription factors with wild-type embryonic stem cells and promote their self-organization into structures that mimic several aspects of the post-implantation human embryo. These self-organized aggregates contain a pluripotent epiblast-like domain surrounded by extraembryonic-like tissues. Our functional studies demonstrate that the epiblast-like domain robustly differentiates into amnion, extraembryonic mesenchyme and primordial germ cell-like cells in response to bone morphogenetic protein cues. In addition, we identify an inhibitory role for SOX17 in the specification of anterior hypoblast-like cells2. Modulation of the subpopulations in the hypoblast-like compartment demonstrates that extraembryonic-like cells influence epiblast-like domain differentiation, highlighting functional tissue-tissue crosstalk. In conclusion, we present a modular, tractable, integrated3 model of the human embryo that will enable us to probe key questions of human post-implantation development, a critical window during which substantial numbers of pregnancies fail.


Conflict of interest statement

The authors are inventors on the following patents: (1) Patent applicant: Caltech; inventors: M.Z.-G., B.S. and V.J.; application number: 17/692,790; specific aspect of the manuscript covered in patent application: reconstructing human early embryogenesis in vitro with pluripotent stem cells. (2) Patent applicant: Caltech and Cambridge Enterprise Limited; inventors: M.Z.-G., G.A. and C.H.; application number: 63/397,630; specific aspect of the manuscript covered in patent application: synthetic embryos. (3) Patent applicant: Caltech and Cambridge Enterprise Limited; inventors: M.Z.-G., B.W. and C.G.; application number: 63/403,684; specific aspect of the manuscript covered in patent application: stem cell-derived model of the human embryo.

Figures

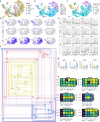
Fig. 1
Fig. 1. Validation of extraembryonic-like induction.
a, Generation of human ES cells with inducible expression of GATA6 (iG6), SOX17 (iS17) or both (iG6-S17) and validation by immunofluorescence after 24 h of doxycycline (Dox) addition in basal N2B27 medium. iG6: n = 551; iS17: n = 550; iG6-S17: n = 707 cells from 3 independent experiments. TRE, tetracycline response element. b, Generation of human ES cells with inducible expression of GATA3 (iG3), AP2γ (iAP2γ) or both (iG3-AP2γ) and validation after 24 h of doxycycline addition in basal N2B27 medium. iG3: n = 1,456; iAP2γ: n = 1,456; iG3-AP2γ: n = 782 cells from 3 independent experiments. a,b, Data are mean ± s.e.m. c, Uniform manifold approximation and projection (UMAP)-based dimensional reduction of sequenced wild-type (RSeT WT), inducible GATA6-SOX17 (day 3 iG6-S17) and inducible GATA3-AP2γ (day 3 iG3-AP2γ) RSeT human ES cells after 3 days of doxycycline induction. d, Logistic regression analysis (from ref. ) and comparison of cells to human post-implantation embryo populations. Human embryo data from Molè et al. were used as training data and the cell line data were used as test data. e, Selected differentially expressed genes (DEGs) from RNA sequencing (blue; left) and predicted differential motif accessibility from ATAC-seq scored by chromVAR (pink; right; var.2, secondary motif variation in JASPAR database) for wild-type, GATA6-SOX17 and GATA3-AP2γ RSeT human ES cells after three days of doxycycline induction. TDGF1 is also known as CRIPTO. f, Validation of co-culture of wild-type, induced GATA6-SOX17 and induced GATA3-AP2γ RSeT human ES cells in 2D. n = 3 independent experiments. Scale bars, 100 µm. Source data
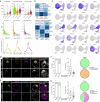
Fig. 2
Fig. 2. Generation of inducible post-implantation human embryoids.
a, Overview of the protocol used to generate inducible human embryoids by combining wild-type RSeT human ES cells with inducible GATA6-SOX17 and GATA3-AP2γ cells. Extraembryonic-like cells were induced for 3 days before aggregation at day 0. KSR, knockout serum replacement. b, Size of cell aggregates between days 1 and 3 post-aggregation. Day 1: n = 175, day 2: n = 171 and day 3: n = 91 structures from 5 independent experiments. All individual embryoid lengths are plotted. Each symbol (orange cross, orange triangle, green triangle, blue circle, purple square) represents an independent experiment. c, At 96 h post-aggregation, structures demonstrate clear self-organization. d, Quantification of embryoid formation across starting pluripotency states. RSeT: n = 952, mTeSR: n = 30 and PXGL: n = 207 structures from 5 independent experiments. One-way ANOVA with Holm–Šídák multiple comparisons test. RSeT versus mTeSR: P = 0.0347; RSeT versus PXGL, P = 0.0283. Unmarked pairwise comparisons are not significant (P > 0.05). e, Proportions of cell types in correctly organized embryoids. n = 16 embryoids from 3 independent experiments. f, Representative image of an in vitro cultured human embryo at 9 dpf showing a clear lumenized SOX2 domain surrounded by a layer of GATA6-positive cells. A subset of GATA6-positive cells expresses the anterior hypoblast marker CER1. Representative of three independent experiments. g, The hypoblast-like domain expresses N-cadherin (N-cad), SOX17 and GATA4, and the epiblast-like domain maintains expression of the pluripotency factors SOX2, OCT4 and NANOG. Cells derived from GATA3-AP2γ cells (which express GFP) show clear outer localization. Representative of two experiments each. E-cad, E-cadherin. h, Inducible human embryoids demonstrate clear apicobasal polarity. Right, quantification of inducible human organization. Top right, n = 506 structures from 3 independent experiments for lumen and extracellular matrix (ECM) efficiency. Bottom right, n = 27 embryoids from 2 independent experiments for lumen number. g,h, Inner domains of embryoids are surrounded by a dashed line. d,e,h, Data are mean ± s.e.m. Scale bars, 100 µm. *P < 0.05, **P< 0.01, ***P < 0.001, ****P < 0.0001. NS, not significant. Source data
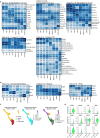
Fig. 3
Fig. 3. Differentiation of extraembryonic mesenchyme, amnion and primordial germ cells.
a, Schematic of the extended culture protocol of inducible human embryoids and sampling for combined-single-cell RNA sequencing and single-cell ATAC-seq using the 10X platform. Twelve embryoids each at day 4, 6 and 8 post-aggregation were sequenced. b, Cells were annotated on the basis of transcriptional projection to multiple human and non-human primate (M. fascicularis) embryo datasets using scmap in conjunction with RNA and chromatin velocity. wnn, weighted nearest neighbour. E-PGC, early PGC; E-AM, early amnion; L-AM1, late amnion 1; L-AM2, late amnion 2; L-Gast1, late gastrulating epiblast 1; L-Gast2, late gastrulating epiblast 2; TE, trophectoderm; VE/YE, visceral/yolk sac endoderm. c, Selected differentially expressed genes in the RNA-sequencing data (top) and predicted differentially accessible motifs scored by chromVAR on the ATAC-seq data (bottom) across clusters. d, Inducible human embryoids downregulated SOX2 and upregulated CDX2 and ISL1 at day 6, and upregulated VTCN1 at day 8, indicative of robust amnion differentiation and maturation. In some, rare cases, dorsoventral and/or anterior–posterior axis patterning is observable. Representative of three experiments. e, Module scoring for primordial germ cell marker genes. f, Nebulosa plot visualizing joint expression density of key primordial germ cell genes in inducible human embryoids. Max, maximum; min, minimum. g, Heat map of selected primordial germ cell gene expression across clusters. h, Immunofluorescence identification of SOX17+NANOG+AP2γ+ primordial germ cell-like cells in inducible human embryoids highlighted by arrowheads. i, Quantification of SOX17+NANOG+AP2γ+ cells at days 4 (n = 10 embryoids) and 6 (n = 10 embryoids). Two independent experiments. Data are mean ± s.e.m. Inner domains of embryoids are surrounded by a dashed line. Scale bars, 100 µm. Source data
Fig. 4
Fig. 4. BMP signalling drives amnion specification in inducible human embryoids.
a, Expression of ID1–4, downstream targets of BMP signalling, in embryoids. b, chromVAR-based motif accessibility scores of SMAD5 and SMAD2–SMAD3–SMAD4, effectors of BMP and NODAL signalling, respectively. c, Representative images and quantification of OCT4-positive and GATA6-positive cells from representative inducible human embryoids at days 4 (n = 60 cells each; P < 0.0001) and 6 (n = 40 cells each; P < 0.0001). Three independent experiments. a.u., arbitrary units. d, Representative images and quantification of SMAD2.3 in OCT4-positive and GATA6-positive cells from representative inducible human embryoids at days 4 (n = 40 cells each; P = 0.0004) and 6 (n = 40 cells each; P < 0.0001). Two independent experiments. Cyto, cytoplasm; nuc, nuleus. c,d, Two-sided Mann–Whitney test. e, Inhibition of BMP signalling blocks exit from pluripotency and upregulation of amnion markers AP2α and CDX2. f, The proportion of day 4 inner domains expressing SOX2 and CDX2 (control: n = 147, LDN193189 (LDN)-treated: n = 126, BMP4-treated: n = 57 and activin-A (ActA)-treated: n = 60 embryoids from 5 independent experiments). For SOX2+CDX2 domains, control versus LDN193189: P = 0.0002; control versus activin-A: P = 0.0433; control versus BMP4: P = 0.1753. Repeated measures two-way ANOVA with Holm–Šídák multiple comparisons test. g, Inhibition of BMP reduces the number of primordial germ cell-like cells in embryoids. h, The number of SOX17+NANOG+AP2γ+ primordial germ cell-like cells at day 4 (control: n = 45, LDN193189-treated: n = 30, BMP4-treated: n = 48 and activin-A-treated: n = 36 embryoids from 6 independent experiments). In box plots, the centre line is the median, boxes encompass the 25th–75th centiles, whiskers extend to the minimum and maximum values and the plus sign denotes the mean. Control versus LDN193189: P = 0.0011; control versus BMP4: P > 0.99; control versus activin-A: P = 0.98. Unmarked comparisons to control are not significant. Kruskal–Wallis with Dunn’s multiple comparisons test. c,d,f, Data are mean ± s.e.m. Inner domains of embryoids are surrounded by a dashed line. Scale bars, 100 µm. Source data
Fig. 5
Fig. 5. SOX17 induction is antagonistic to specification of the anterior hypoblast.
a, Expression of CER1 and LEFTY1 in the HYPO/VE in embryoids. b, Analysis of GATA6 and SOX17 regulon activity scored by SCENIC, and SOX17 and CER1 co-expression in post-implantation human hypoblast (9–11 dpf). Data are from Molè et al.. AUC, area under the curve. c, Representative examples of embryoids showing CER1-positive cells generated using induced GATA6 (iG6) but not induced GATA6-SOX17 (iG6-S17) hypoblast-like cells. CER1 expression is also observed if doxycycline is withdrawn at day 3 post-aggregation. d, The proportion of embryoids in c expressing CER1. iG6-S17: n = 78; iG6: n = 25; iS17: n = 26; iG6-S17 −Dox, day 1: n = 54; and iG6-S17 −Dox, day 3: n = 65 embryoids from 7 independent experiments. iG6-S17 versus iG6: P < 0.0001; iG6-S17 versus iG6-S17 −Dox, day 3: P < 0.0001; iG6-S17 versus iS17, P = 0.87; iG6-S17 versus iG6-S17 −Dox, day 1: P = 0.87. e, Representative images at day 4 demonstrate decreased pSMAD1.5 in the epiblast-like domain of structures with a CER1-positive cell population. f, Quantification of pSMAD1.5 levels in SOX2-posititive cells in CER1-negative versus CER1-positive iG6-S17 embryoids at day 4. CER1: n = 108 cells and CER1+: n = 123 cells from 8 embryoids each from 2 independent experiments. P < 0.0001. Two-way Mann–Whitney test. g, Representative images of Brachyury (BRY) expression in inducible human embryoids generated with iG6, iS17 or iG6-S17 cells (with doxycycline maintained, or removed at day 1 or day 3 post-aggregation). h, Quantification of Brachyury expression in e. iG6-S17: n = 34; iG6: n = 15; iS17: n = 16; iG6-S17 −Dox, day 1: n = 16; and iG6-S17 −Dox, day 3: n = 20 embryoids from 6 independent experiments. iG6-S17 versus iG6: P = 0.0225; iG6-S17 versus iG6-S17 −Dox, day 3: P = 0.0002; iG6-S17 versus iS17: P = 0.69; iG6-S17 versus iG6-S17 −Dox, day 1: P = 0.81. d,f,h, Data are mean ± s.e.m. d,h, Repeated measures two-way ANOVA with Holm–Šídák multiple comparisons test. Inner domains of embryoids are surrounded by a dashed line. Scale bars, 100 µm. Source data
Extended Data Fig. 1
Extended Data Fig. 1. Selection of transgenes to drive extraembryonic-like cells.
a, Uniform Manifold Approximation Projection (UMAP) showing combined human pre- to post-implantation datasets colored by original publication. b, UMAP of combined human datasets colored according to stage of embryo (days post-fertilization; d.p.f.). c, UMAP of combined human datasets colored according to cell type. d, Cardinal cell type gene expression on UMAP of human datasets. e, Plots from single cell RNA sequencing of key marker gene expression in human datasets separated by cell type. n = 10223 cells. f, Inferred epiblast, hypoblast, and trophoblast gene regulatory network generated by SCENIC during peri-implantation human embryo development. See methods for details on datasets and processing. Candidate factors are in bold red. g, Regulon activity scored by SCENIC for hypoblast markers GATA6, SOX17, and TrB markers GATA3 and TFAP2C. n = 10223 cells. h, qRT-PCR analysis of individual inducible cell lines. Doxycycline inducible constructs were inserted in Shef6 hESC using piggybac transposase (inducible GATA6, SOX17, GATA6-SOX17, GATA3, AP2γ and GATA3-AP2γ). Colonies were manually isolated after single cell plating and propagated. Appropriate transgene expression was validated by RT-qPCR after 72 h of 1µg/mL doxycycline addition in basal N2B27 conditions. N = 3 technical replicates. Clones selected for further analysis are in green. For box plots, box encompasses the 25th–75th quartile with whiskers to minimum and maximum. Central line marks median. Source data
Extended Data Fig. 2
Extended Data Fig. 2. Immunofluorescence analysis of cardinal marker genes of hypoblast and trophoblast after doxycycline induction across pluripotent states.
a, qRT-PCR analysis after 3 days of doxycycline-induction of induced GATA6 (iG6), induced SOX17 (iS17), or induced GATA6-SOX17 (iG6-S17) singly and together from three pluripotent states. b, qRT-PCR analysis after 3 days of DOX-induction of induced GATA3 (iG3), induced AP2γ (iAγ), or induced GATA3-AP2γ (iG3-Aγ) from multiple pluripotent starting states. For a-b, N = 3 technical replicates from 3 independent experiments. c, Immunofluorescence analysis of iG6, iS17, or iG6-S17 cells after 3 days induction from multiple pluripotent states. d, Quantification of immunofluorescence levels of c. e, Immunofluorescence analysis of iG3, iAγ, or iG3-Aγ after 3 days induction from multiple pluripotent states. f, Quantification of immunofluorescence levels of e. For c-f, N = 3 technical replicates from 2 independent experiments. Cells are initially cultured in either mTeSR, RSeT, or PXGL conditions, and then cultured for 3 days either under the same conditions or alternatively transferred to either basal N2B27 media or basal N2B27 media with the addition of doxycycline. The induced transgenes are marked in red. Scale bars = 100µm. Source data
Extended Data Fig. 3
Extended Data Fig. 3. Comparison of transcription factor-mediated induction with published directed differentiation methods.
a, Comparison and quantification of GATA6, SOX17 and SOX2 after yolk sac-like cell (Activin-A, CHIR99021 and LIF) directed differentiation, doxycycline-mediated induction in inducible GATA6-SOX17 cells, or both. Cells were differentiated from RSeT conditions. b, Comparison and quantification of EOMES, N-Cadherin, and OTX2 after yolk sac-like cell (Activin-A, CHIR99021, and LIF) directed differentiation, doxycycline-mediated induction in inducible GATA6-SOX17 cells, or both. For a-b, N2B27: n = 717; ACL: n = 1211; N2B27+Dox.: n = 522; and ACL+Dox.: n = 544 cells from 3 fields of view from 2 independent experiments. c, Comparison and quantification of GATA3, AP2α, and SOX2 after PA (PD0325901 and A83-01) or PAL (PD0325901, A83-01, and LPA) directed differentiation, doxycycline-mediated induction in inducible GATA3-AP2γ cells, or both. d, Comparison and quantification of GATA2, KRT7, and AP2γ after PA (PD0325901 and A83-01) or PAL (PD0325901, A83-01, and LPA) directed differentiation, doxycycline-mediated induction in inducible GATA3-AP2γ RseT cells, or both. For c-d, N2B27: n = 443; PA: n = 487; PAL: n = 371; N2B27+Dox.: n = 357; PA+Dox.: n = 412; and PAL+Dox.: n = 287 cells from 3 fields of view from 2 independent experiments. Scale bars = 100 µm. For a-d, mean ± SEM is plotted. Differentiation was carried out on hESC in RSeT conditions. Source data
Extended Data Fig. 4
Extended Data Fig. 4. Assessing extraembryonic-like induction from RseT cells.
a, Quality control plots of cell line 10x multiome sequencing data. n = 5328 cells. Violin plots go from minimum to maximum. b, Logistic regression framework to assess similarity between clusters was applied to cell line RNA-sequencing data using published in vitro blastoid and directed differentiation protocols as training data. c, Gene expression of selected genes after 3 days of doxycycline-induction from sequencing of wildtype, inducible GATA6-SOX17 (iG6-S17), and inducible GATA3-AP2γ (iG3-AP2γ) RSeT hESC populations visualized on a uniform manifold projection and approximation (UMAP). Visualization of sample distribution in the UMAP is shown in Fig. 1c. d, Immunofluorescence images of human cell-mouse embryo chimeras at the late blastocyst stage show shift of human cells marked by human nuclear antigen (HuNAg) contributing to the SOX2-positive epiblast to the SOX17-positive primitive endoderm upon iG6-S17 induction. e, Quantification of the contribution of HuNAg-positive cells stained for SOX2 and SOX17. Control: n = 12 and iG6-S17: n = 30 embryos from 3 independent experiments. f, Immunofluorescence images of human cell-mouse embryo chimeras at the late blastocyst stage show a shift of human cells from the SOX2-positive epiblast to the GATA3-positive trophectoderm upon iG3-AP2γ induction. g, Quantification of the contribution of HuNAg-positive cells stained for SOX2 and GATA3. control: n = 10 and iG6-AP2γ: n = 27 embryos from 3 independent experiments. Induction was carried out from hESC in RSeT conditions. For box plots, box encompasses the 25th–75th quartile with whiskers to minimum and maximum. Central line marks median. Scale bars =100 µm. Source data
Extended Data Fig. 5
Extended Data Fig. 5. Post-implantation human embryo-like model cluster identification.
a, Day 4 embryoids generated from a second hESC line, RUES2. N = 371 structures from 2 independent experiments. b, Brightfield image of inducible human embryoids selected at days 4, 6, and 8 for sequencing (n = 12 at each stage). Note the presence of an inner domain surrounded by two concentric domains. c, Quality control plots for embryoid sequencing data at days 4, 6, and 8 post-aggregation. n = 5217 cells. Violin plots go from minimum to maximum. b, scmap projection of inducible human embryoid cells onto cynomolgus macaque (M. fasicularis) and human datasets (H. sapien) spanning peri-implantation to gastrulation stages. e, Cardinal marker gene expression for epiblast, endoderm and mesoderm, and trophoblast and amnion within the stem cell-derived model. f, Alluvial plot showing the contribution of day 4, 6, or 8 embryoids to assigned cell type. Scale bars = 100 µm. Inner domains of embryoids are surrounded by a dashed line. Source data
Extended Data Fig. 6
Extended Data Fig. 6. Embryoid cluster comparison to human and cynomolgus monkey datasets.
a, Logistic regression analysis comparing annotated clusters from cynomolgus macaque (M. fasicularis) and human datasets (H. sapien) spanning peri-implantation to gastrulation stages (training data) to post-implantation human embryo-like model clusters (test data). Cynomolgus data from Ma et al., Nakamura et al., Yang et al.; Human data from Molè et al. and Tyser et al., 2021. b, Logistic regression analysis comparing in vitro human embryo-like model and directed differentiation datasets (training data) to inducible human embryoids (test data). c, scmap projection of human inducible embryoid dataset onto in vitro datasets. In vitro datasets from Pham et al., Kagawa et al., 2021, and Zheng et al.. d, Violin plots of gene expression in GFP-negative versus GFP-positive cells derived from induced GATA3-AP2γ (iG3-AP2γ) cells from inducible human embryoid sequencing dataset. n = 5217 cells. Violin plots go from minimum to maximum.
Extended Data Fig. 7
Extended Data Fig. 7. Extraembryonic mesenchyme trajectory and wildtype cell differentiation capacity.
a, Immunofluorescence of HAND1 demonstrating expression in GATA6-positive cells (putative extraembryonic mesenchyme) and upregulation between days 4 and 6 in putative amnion (AP2γ-positive). Representative of 2 experiments. b, Expression of HAND1 in the inducible human embryoid single cell sequencing dataset. c, Immunofluorescence of TBX20 demonstrating high expression in a subset of GATA6-positive cells (putative extraembryonic mesenchyme). Representative of 5 experiments. d, Expression of TBX20 in the inducible human embryoid single cell sequencing dataset demonstrating enrichment in the extraembryonic mesenchyme cluster. e, Differentiation of ISL1-positive amnion and GATA6/TBX20-positive extraembryonic mesenchyme in structures derived from a second cell background, RUES2. Representative of 2 experiments. f, Differentiation of primordial germ cell-like cells in embryoids derived from a second cell background, RUES2. Representative of 2 experiments. g, Examples and quantification of day 4 embryoids. Embryoids exhibit an outer layer of GFP-positive induced GATA3-AP2γ (iG3-AP2γ) cells, an inner domain comprised of mKate2-positive wildtype hESCs, and an interstitial GATA6-positive population largely comprised of unlabeled induced GATA6-SOX17 (iG6-S17) cells. n = 9 embryoids from 2 independent experiments. h, ISL1-positive amnion-like cells overlap with mKate2-positive wildtype cells. Representative of 3 experiments. i, Expression of GATA6 and TBX20-positive extraembryonic mesenchyme-like cells overlap with mKate2-positive wildtype cells. Representative of 3 experiments. j, Expression of AP2γ, SOX17, and NANOG triple-positive primordial germ cell-like cells overlaps with mKate2-positive wildtype cells. Representative of 3 experiments. Scale bars = 100 µm. For g, mean ± SEM is plotted. Inner domains of embryoids are surrounded by a dashed line. Source data
Extended Data Fig. 8
Extended Data Fig. 8. Importance of BMP and inducible GATA3-AP2γ cells in generating inducible human embryoids.
a, Expression of ID1-4 fit over a latent time, colored by cell type assignment. b, Motif accessibility scored by chromVAR for SMAD5 and SMAD2::SMAD3::SMAD4 fit over latent time, colored by cell type assignment. c, Predicted ligand-receptor pairings in inducible human embryoids generated by CellPhoneDB (Efremova et al.). d, Predicted interactions of inducible GATA6-SOX17 (G6-S17) and inducible GATA3-AP2γ (G3-AP2γ) cells after 3 days induction with wildtype RSeT hESCs, which are the cell types aggregated to generate inducible human embryoids. e, Inducible human embryoids do not form if induced GATA3-AP2γ cells are excluded or if the BMP signaling antagonist LDN193189 (LDN) is added between days 0–2. f, Quantification of embryoid formation efficiency from e. n = 535 ESC+iG6-S17 and 500 LDN-treated structures from 4 independent experiments. g, Quantification of embryoid size after LDN193189 addition between days 0–2. n = 105 structures per condition for each day from 3 independent experiments. Statistics: Two-sided Mann Whitney between Control and LDN at each timepoint. Day 1 P < 0.0001. Day 2 P = 0.0019. Day 3 P < 0.0001. h, Overview of whole Aggrewells demonstrating the effect of BMP inhibition, BMP4 addition, and NODAL activation. Representative of 5 experiments. Note the significant increase in well-organized structures expressing SOX2 after BMP inhibition. Scale bars = 100 µm. **P < 0.01. ****P < 0.0001. For f, mean ± SEM is plotted. For g, all individual datapoints are plotted. Source data
Extended Data Fig. 9
Extended Data Fig. 9. CER1 expression is downregulated upon extended culture of inducible human embryoids.
a, Formation efficiency of embryoids generated with different conditions. Note the highest efficiency is our standard condition with consistent addition of doxycycline and using GATA6-SOX17 inducible cells (iG6-S17). iG6-S17: n = 224; induced GATA6 (iG6): n = 276; induced SOX17 (iS17): n = 247; iG6-S17 with doxycycline removed at day 1: n = 370; and iG6-S17 with doxycycline removed at day 3: n = 410 structures from 2 independent experiments. b, Immunofluorescence of CER1 and SOX2 at day 6 post-aggregation demonstrates downregulation of both SOX2 and CER1 at this stage in structures generated with both inducible iG6 or iG6-S17 hypoblast-like cells (with consistent addition or doxycycline, or early removal at day 3 post-aggregation) together with wildtype ESCs and inducible GATA3-AP2γ (iG3-AP2γ) cells. Representative of 3 experiments. c, Embryoids generated with Shef6-mKate2 ESCs demonstrate that both the ISL1-positive and BRY-positive cell populations differentiate from the wildtype cells in structures generated with either iG6 or iG6-S17 hypoblast-like cells with early removal of doxycycline at day 3 post-aggregation. Representative of 3 experiments. Scale bars = 100 µm. Inner domains of embryoids are surrounded by a dashed line. Source data

Comment in

References

    1. Rossant, J. & Tam, P. P. L. Early human embryonic development: blastocyst formation to gastrulation. Dev. Cell57, 152–165 (2022). 10.1016/j.devcel.2021.12.022 - DOI - PubMed
    1. Molè, M. A. et al. A single cell characterisation of human embryogenesis identifies pluripotency transitions and putative anterior hypoblast centre. Nat. Commun.12, 3679 (2021). 10.1038/s41467-021-23758-w - DOI - PMC - PubMed
    1. Clark A. T, et al.Human embryo research, stem cell-derived embryo models and in vitro gametogenesis: considerations leading to the revised ISSCR guidelines. Stem Cell Rep.16, 1416–1424 (2021). 10.1016/j.stemcr.2021.05.008 - DOI - PMC - PubMed
    1. Macklon, N. S. Conception to ongoing pregnancy: the ‘black box’ of early pregnancy loss. Hum. Reprod. Update8, 333–343 (2002). 10.1093/humupd/8.4.333 - DOI - PubMed
    1. Ross, C. & Boroviak, T. E. Origin and function of the yolk sac in primate embryogenesis. Nat. Commun.11, 3760 (2020). 10.1038/s41467-020-17575-w - DOI - PMC - PubMed

Publication types

Substances