. 2023 Oct;622(7983):574-583.
doi: 10.1038/s41586-023-06354-4. Epub 2023 Jun 27.

Self-patterning of human stem cells into post-implantation lineages

Affiliations

Self-patterning of human stem cells into post-implantation lineages

Monique Pedroza et al. Nature. 2023 Oct.

Abstract

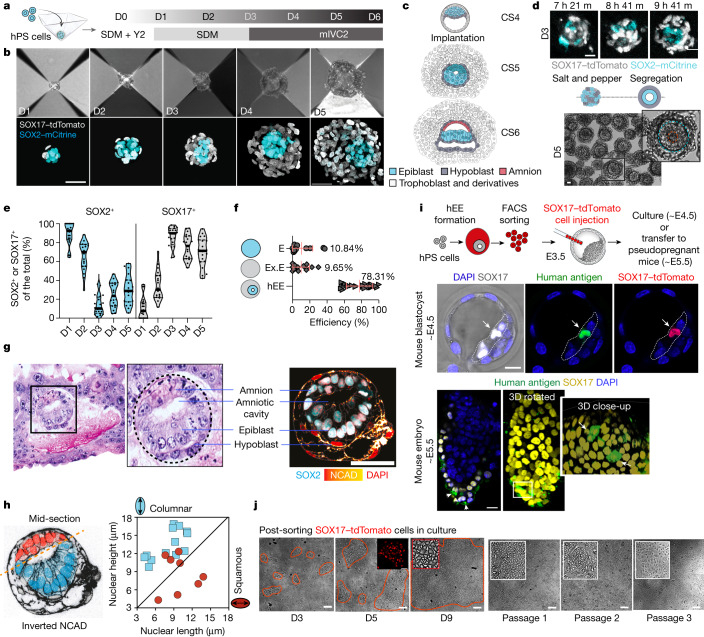
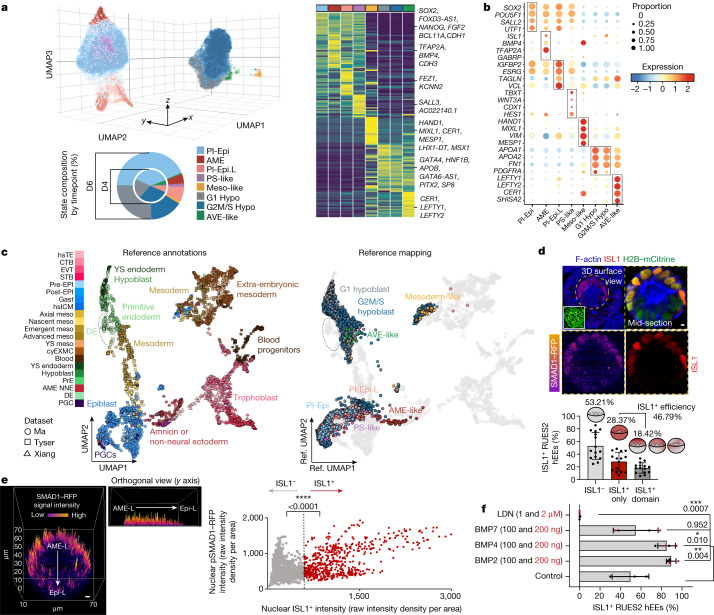
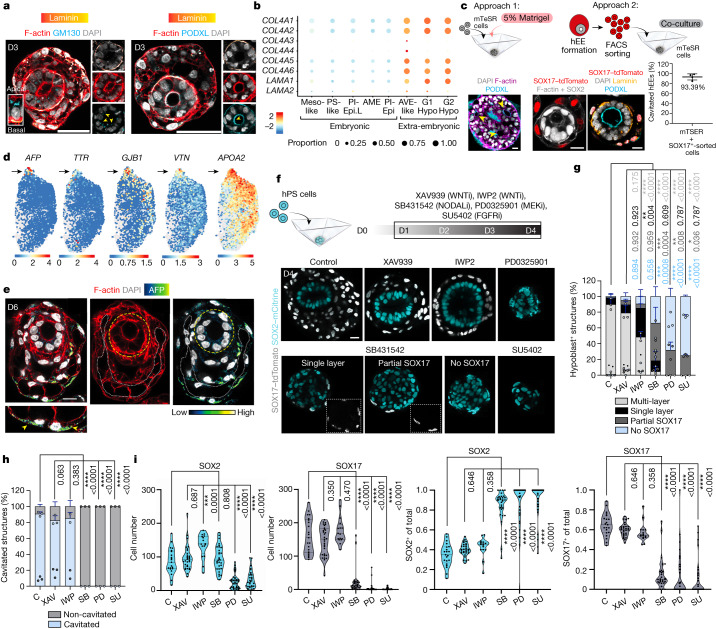
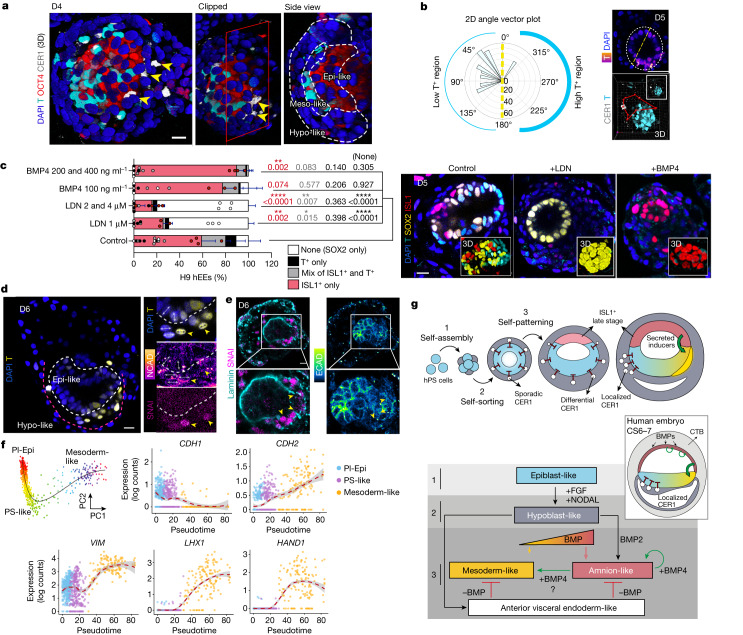
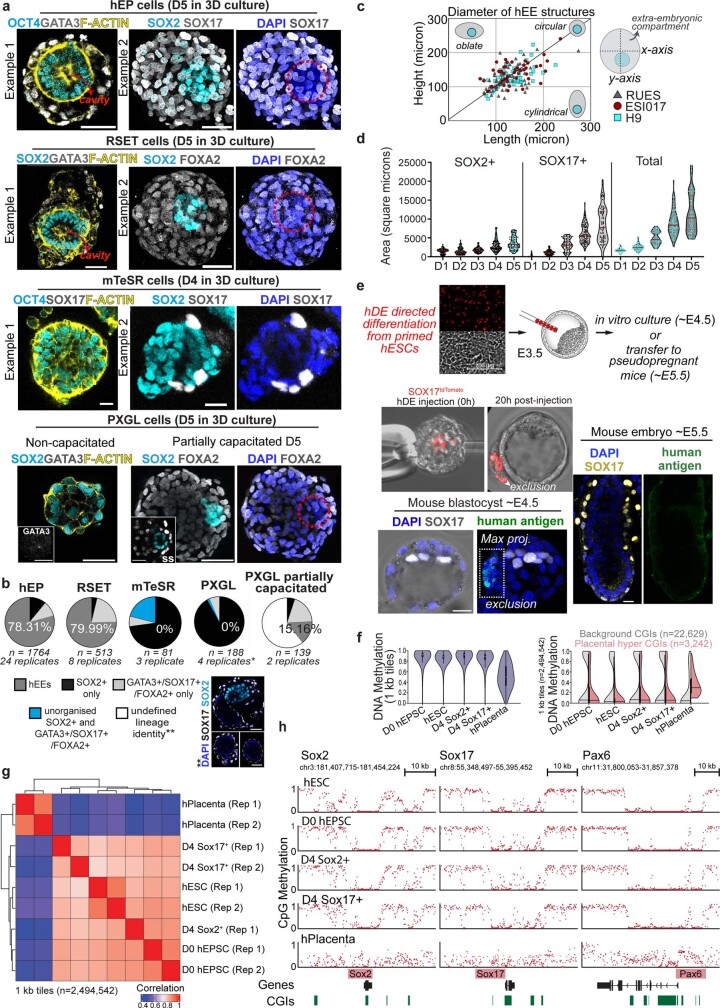
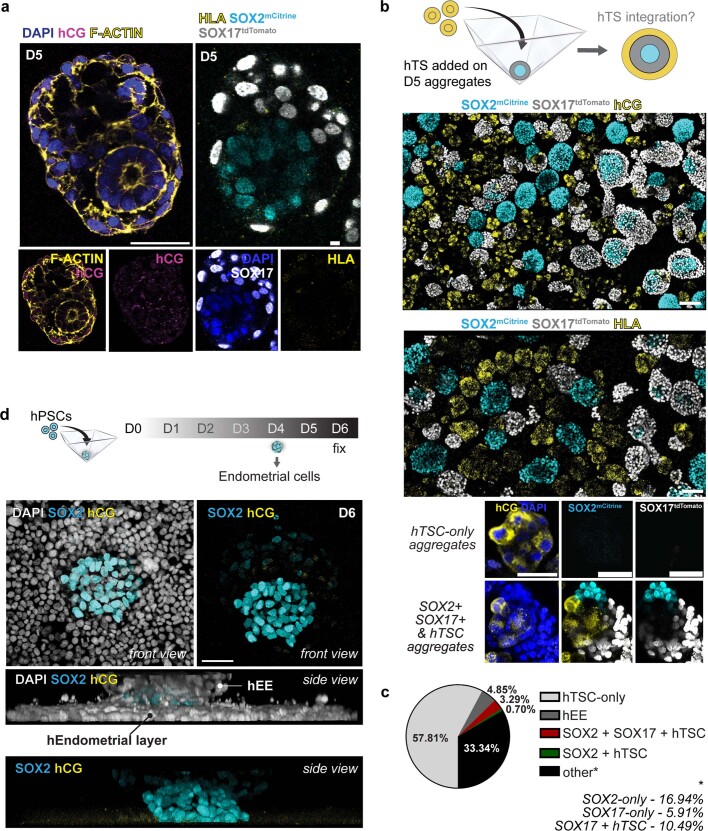
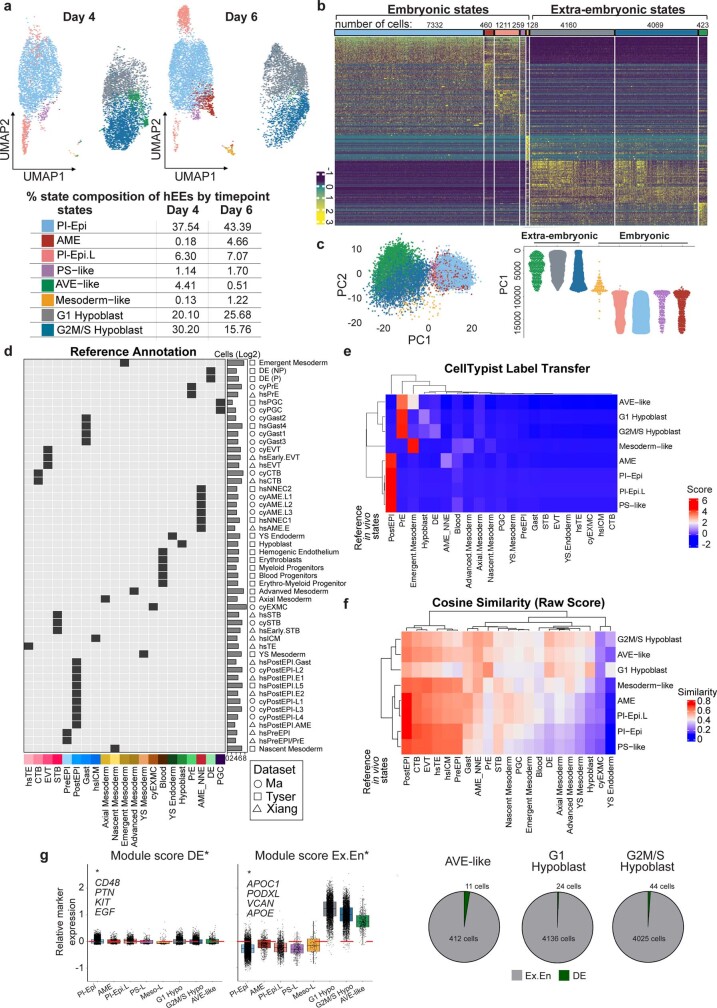
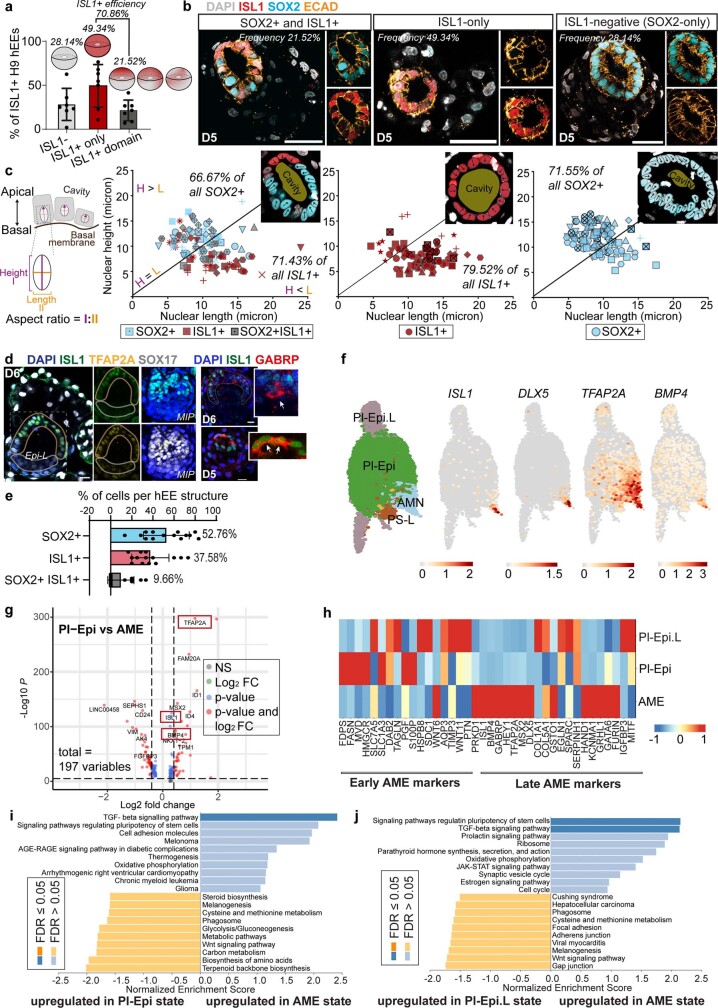
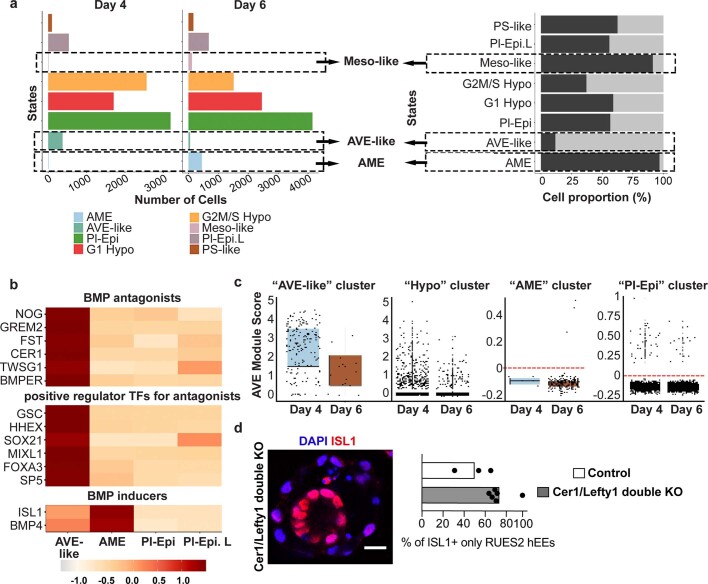
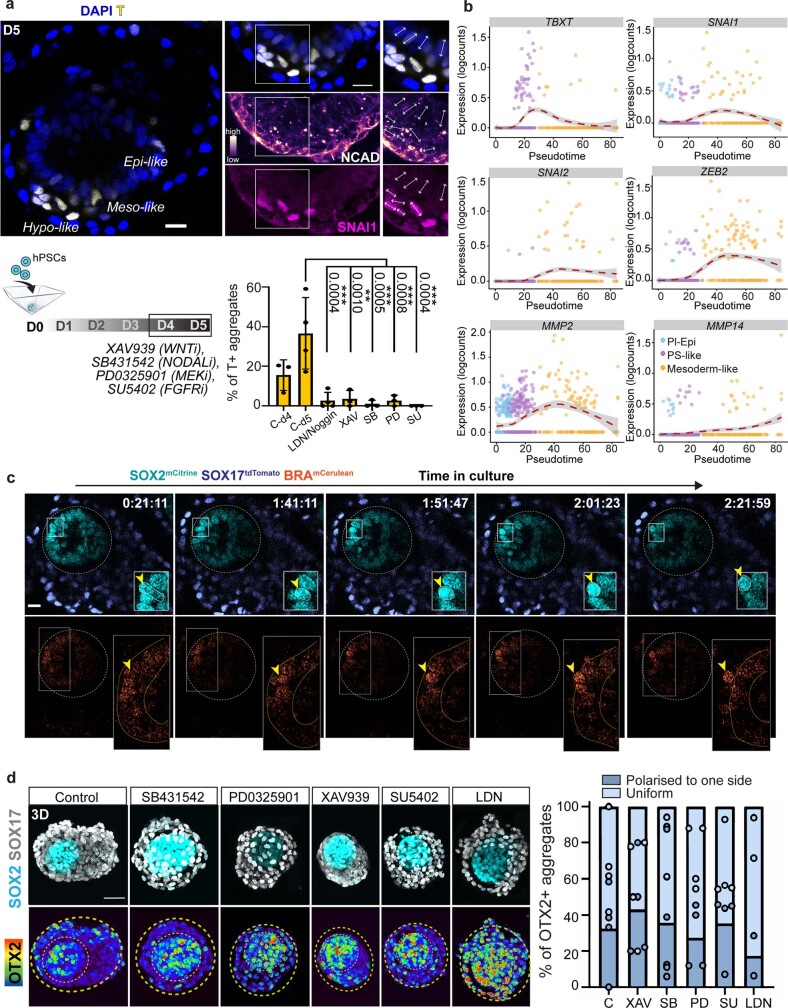
Investigating human development is a substantial scientific challenge due to the technical and ethical limitations of working with embryonic samples. In the face of these difficulties, stem cells have provided an alternative to experimentally model inaccessible stages of human development in vitro1-13. Here we show that human pluripotent stem cells can be triggered to self-organize into three-dimensional structures that recapitulate some key spatiotemporal events of early human post-implantation embryonic development. Our system reproducibly captures spontaneous differentiation and co-development of embryonic epiblast-like and extra-embryonic hypoblast-like lineages, establishes key signalling hubs with secreted modulators and undergoes symmetry breaking-like events. Single-cell transcriptomics confirms differentiation into diverse cell states of the perigastrulating human embryo14,15 without establishing placental cell types, including signatures of post-implantation epiblast, amniotic ectoderm, primitive streak, mesoderm, early extra-embryonic endoderm, as well as initial yolk sac induction. Collectively, our system captures key features of human embryonic development spanning from Carnegie stage16 4-7, offering a reproducible, tractable and scalable experimental platform to understand the basic cellular and molecular mechanisms that underlie human development, including new opportunities to dissect congenital pathologies with high throughput.


Conflict of interest statement

All authors declare no competing interests.

Figures

Fig. 1
Fig. 1. hEEs reproducibly model post-implantation-like lineage bifurcation.
a, Schematic of hEE generation. SDM, spontaneous differentiation medium. SDM, spontaneous differentiation media. Y2, Y27632. mIVC2, modified in vitro culture 2 media. b, Time-course development of hEEs. Scale bar, 50 µm. n = 11, 6 and 7 independent experiments from RUES2, H9 and ESI017 hPS cells, respectively. c, Schematic of human embryo development at the indicated Carnegie stages (CS). d, Sampled frames from a timelapse movie of hEE organization (top). n = 30 structures; n = 3 independent experiments. Scale bar, 20 µm. Phase-contrast image of D5 hEEs (bottom). The inset image highlights the inner cavity (red circle), epiblast-like (blue circle) and hypoblast-like (white circle) compartments. n ≥ 30 independent experiments. Scale bar, 20 µm. e, Percentage of SOX2+ and SOX17+ cells in hEEs. n = 20 structures per timepoint. Each dot represents one structure. The plot shows the median (thick solid line) and quartiles (thin dotted line). f, hEE efficiency versus aggregates comprising a single compartment (embryonic-like (E) and extra-embryonic-like (Ex.E)). Plots show mean ± s.d. n = 1,764 structures from D4 and D5. n = 24 independent experiments for hEE and 13 independent experiments for embryonic-like only and extra-embryonic-like only (for the noted genetic background variation, see Supplementary Table 2). g, Histological section of a CS5b stage in vivo human embryo (left; obtained from the Virtual Human Embryo project) compared with an in vitro hEE at D5 (right). Scale bar, 50 µm. n = 9 independent experiments. h, Same structure as panel g but with inverted and enhanced N-cadherin (NCAD) intensity for better clarity (left). An ozone graph of nuclear length and height of presumptive amnion-like (red) and epiblast-like (blue) cells is also shown (right). i, Chimeric integration of hEE-derived SOX17–tdTomato cells into primitive (top) or visceral endoderm (bottom) of mouse E4.5 blastocysts or E5.5 embryos. n = 15/54 blastocysts and 4/10 E5.5 embryos. n = 2 independent experiments. Scale bars, 20 µm. The arrows indicate the successful integration of human SOX17-TdTomato cells into the mouse primitive or visceral endoderm. j, Expansion of SOX17–tdTomato cells in 2D culture, which were sorted from D3 or D4 hEEs. The red lines outline cell colonies, which are also shown in the zoomed-in images. n = 3 independent experiments. Scale bars, 200 µm. Illustrations in a,c,i, credit: A.L. Cox. The embryo section in g, courtesy of the Virtual Human Embryo. Source Data
Fig. 2
Fig. 2. The emergence of perigastrulation lineages in hEEs.
a, 3D uniform manifold approximation and projection (UMAP) plot (top), pie charts (bottom) and gene expression heatmap (right) of D4 and D6 structures. n = 18,042 total cells. G1 Hypo, growth 1 hypoblast-like; G2M/S Hypo, growth 2 mitosis/synthesis hypoblast-like; meso-like, mesoderm-like; PS-like, primitive streak-like. b, Dot plot of mean marker gene expression level. c, Integrated reference of three studies of primate development (left). See Methods and Supplementary Notes. Projection of hEE scRNA-seq data (query) onto in vivo reference is also shown (right). hEE cells are annotated as above. Reference cells are in grey to represent the background distribution of primate states. For the in vivo reference lineage abbreviations, refer to Extended Data Fig. 3d and Supplementary Table 3. d, hEEs generated from SMAD1–RFP hPS cells (top). Scale bar, 20 µm. The inner compartment (dotted lines, schematics) ISL1 phenotype frequency is also shown (bottom). Each dot represents the percentage of structures per tile scan. The plot shows mean ± s.d. n = 346 structures from 2 independent experiments specific to the RUES2 background are presented in the graph. n = 13 experiments total across different genetic backgrounds. e, SMAD1–RFP 3D surface intensity plot (same structure as shown in panel d) (left). Scale bar, 20 µm. A scatter plot of nuclear SMAD1–RFP fluorescence intensity in ISL1 and ISL1+ cells. n = 1,677 cells in 3 representative structures from 2 independent experiments. Two-tailed unpaired, parametric t-test with Welsch’s correction. P values are displayed in the figure. f, Percentage of ISL1+ structures (RUES2 background). D4 and D5 control (n = 489), BMP2 (n = 461), BMP4 (n = 405), BMP7 (n = 391) and LDN (n = 521). Three or four independent experiments per group. Post-hoc Dunnett’s multiple comparison test, one-way ANOVA. P values are displayed in the figure. Mean ± s.d. are shown. Source Data
Fig. 3
Fig. 3. TGFβ and FGF signalling stabilizes hypoblast-like specification and embryo-like morphogenesis.
a, GM130 (n = 169) and PODXL (n = 156) immunofluorescence within D3 hEEs. Four independent experiments each. Scale bars, 50 μm. Yellow arrowheads indicate the expression of apical markers. b, Dot plot of basement membrane gene expression in hEEs. For lineage abbreviations, refer to Fig. 2a. c, Schematic of mTeSR hPS cell aggregation strategies (top), their corresponding D4 structures (bottom left) and the cavitated hEE efficiency (bottom right). The yellow arrowheads indicate multiple cavities. Plots show mean ± s.d. n = 439 structures. Data are from four technical replicates and two independent experiments. Scale bars, 20 μm. d, UMAP plots of yolk sac endoderm genes within the D6 hypoblast-like cluster. e, AFP+ staining (arrowheads). The yellow and white dashed lines indicate epiblast-like and yolk sac-like compartment patterning, respectively. n = 15 structures over 2 independent experiments. Scale bar, 20 μm. f, Inhibitor treatment strategy (top; see Methods) and resulting phenotypes (bottom). The n numbers are indicated in panel g. Scale bar, 20 μm. g, Percentage of structures that specify hypoblast-like lineage. Control (C; n = 220), XAV939 (XAV; n = 101), IWP2 (IWP; n = 132; 2 experiments), SB431542 (SB; n = 125), PD0325901 (PD; n = 66) and SU5402 (SU; n = 109). The plot shows mean ± s.d. Data are from three independent experiments. Post-hoc Dunnett’s multiple comparison test, one-way ANOVA. P values are shown in the figure. Each dot represents an independent experiment. h, Cavitation efficiency per treatment. Control (n = 140), XAV (n = 95), IWP (n = 118; 2 experiments), SB (n = 79), PD (n = 66) and SU (n = 109). Data are from three independent experiments, unless otherwise indicated. The plot shows mean ± s.d. The same test as panel g was applied. P values are shown in the figure. Each dot represents an independent experiment. i, Number of SOX2+ or SOX17+ cells per structure and their percentage after each treatment. Each dot represents one structure. Control (n = 21), XAV (n = 34), IWP (n = 16), SB (n = 30), PD (n = 35) and SU (n = 30). Data are from two or more independent experiments. The plot shows the median (thick solid line) and quartiles (thin dotted line). The same test as panel g was applied. P values are shown in the figure. Illustrations in c,f, credit: A.L. Cox. Source Data
Fig. 4
Fig. 4. hEEs recapitulate key hallmarks of human perigastrulation.
a, 3D projections of T, OCT4 and CER1 (arrowheads) expression. The dashed lines demarcate mesodermal-like, epiblast-like and hypoblast-like regions. Note that the CER1+ signal in T+ cells is expected due to the maturing mesodermal state. n = 176 structures, 6 independent experiments. Scale bar, 20 µm. b, Angular distribution (left) of CER1+ cells relative to T+ cells (right; single section on the top and 3D projection on the bottom). Each vector represents the angle for one CER1+ cell. The vector length corresponds to the distance between a CER1+ cell and the midpoint of the bisecting line (dashed line). Scale bar, 50 µm. c, Phenotype frequencies after LDN or BMP4 treatments (left) and the corresponding representative structures (right). Control (n = 160), LDN 1 µM (n = 64), LDN 2 and 4 µM (n = 104), BMP4 100 ng ml−1 (n = 67) and BMP4 200 and 400 ng ml−1 (n = 90). Three or more independent experiments (per group) specific to the H9 background are presented in the graph. Six or more total experiments were conducted across different genetic backgrounds. Mean ± s.d. Post-hoc Dunnett’s multiple comparison test, one-way ANOVA. P values are shown in the figure. Each dot represents an independent experiment. Scale bar, 20 μm. d, T expression in D6 hEE. The zoomed-in images highlight T+, NCAD+ and SNAI1+ cells (arrowheads). The double-headed arrowheads show nuclear reorientation of T+ and SNAI1+ cells. The white and red dashed lines enclose epiblast-like and hypoblast-like regions, respectively. n = 20/53 T+ structures, 4 experiments. Scale bar, 20 μm. e, SNAI+ cells are peripheral to the inner compartment (white box), show downregulated E-cadherin (ECAD), breach the basement membrane (laminin; arrowheads) and focally migrate from the epiblast-like compartment. n = 32/55 T+ structures, 3 experiments. Scale bar, 20 μm. f, Principal curves of hallmark gastrulation markers over pseudotime (post-implantation epiblast-like to primitive streak-like to mesoderm-like states) in hEEs. PC, principal component. Dashed red line indicates PC, grey background indicates LOESS function (locally estimated scatterplot smoothing). g, Proposed mechanism of early human development as modelled in hEEs. Also note Fig. 2d for observed spontaneous heterogeneity in the amnion-like specification in hEEs. CTB, cytotrophoblast. Illustrations in g, credit: A.L. Cox. Source Data
Extended Data Fig. 1
Extended Data Fig. 1. Evaluating stem cell pluripotency states by their potential to form human extra-embryoids.
(a) hEEs generated from hEP, RSeT, mTeSR, or PXGL hPSCs. Scale bar, 50 μm. N values and independent experiments are presented in panel b. (b) Pie charts displaying the yield of multicellular aggregates in panel a. Percentages correspond to hEE formation. *PXGL (non-capacitated) = 4 independent experiments total. Note that 2 experiments failed to aggregate. mTeSR = 3 independent experiments. Note that 2 experiments failed to aggregate. Insert images show examples of undefined lineage identity(**). Scale bars, 50 μm. (c) Diameter of hEEs generated from RUES2 (N = 50), ESI017 (N = 50), H9 (N = 50) hPSC lines. 10 independent experiments. (d) Area of SOX2+, SOX17+, and total regions of hEEs from D1 through D5 of culture. D1 (N = 109), D2 (N = 86); D3 (N = 73); D4 (N = 97), D5 (N = 79). Each dot represents one analysed structure. The plot shows the median (solid, red line) and quartiles (red, dotted line). 3 independent experiments. (e) Chimeric integration strategy to inject directed-differentiated definitive endoderm from primed hPSCs to mouse embryos. Representative E4.5 blastocyst and E5.5 embryo with SOX17-tdTomato+ cell (also marked by human antigen in green) were excluded from the Sox17+ primitive or visceral endoderm layer (white or yellow). 0/49 embryos, 4 independent experiments. Scale bar, 20 μm. (f) Violin plots showing the global methylation levels (left) and split violin plots for CpG islands (right) of hEE compared to hESCs and human placenta. White circles and horizontal bars represent the median, boxes the interquartile range (IQR), and whiskers 1.5xIQR. (g) Hierarchical clustering of 1-kb tiles across hEE replicate samples compared to hESC and placental samples. (h) Genome browser tracks of three developmental loci in hEE samples as they compare to hESCs and human Placenta (as proxies for embryonic and extraembryonic landscapes, respectively). Illustrations in e, credit: A. L. Cox. Source Data
Extended Data Fig. 2
Extended Data Fig. 2. Human extra-embryoid do not initiate spontaneous trophoblast differentiation.
(a) Representative hEEs at D5 are negative for trophectoderm markers hCG (magenta) and HLA (yellow). Scale bar, 50 μm (left) and 20 μm (right). N = 82 structures from D3 to D6. 3 independent experiments. (b) Top: Schematic of strategy to incorporate human trophoblast stem cells (hTSCs, marked by HLA and hCG in yellow) into hEEs at D5. Bottom: Wide-field tile scans show that TSCs and hEEs form independent aggregates and do not mix after extended co-culture. Scale bars, 20 μm. N = 554 structures, 2 independent experiments. (c) Pie chart of the proportion of aggregates in panel b. N = 554 structures, 2 independent experiments. (d) Top: Schematic of strategy to promote trophoblast-like differentiation: D4 hEE structures were transferred from 3D wells onto a monolayer of endometrial cells and imaged at D6. Bottom: 3D projection of SOX2+ (cyan) and hCG (yellow) in a D6 structure from a front and side view. Structures (white line) interacted with the endometrial layer (indicated by a black line) from front and side views but were negative for hCG (yellow). N = 42 structures, 3 independent experiments. Scale bar, 50 μm. Illustrationsin b,d, credit: A. L. Cox. Source Data
Extended Data Fig. 3
Extended Data Fig. 3. Embryonic- and extra-embryonic-like cell types resemble human embryo lineages.
(a) Top: 3D UMAP plot shown in Fig. 2a with D4 and D6 time points separated in 2D. Bottom: Percentages for each cell state are included for each time point. For lineage abbreviations, refer to Fig. 2a. (b) Gene expression within D4 and D6 structures including the number of cells per cell state. The colour scale represents row-scaled marker gene expression level. (c) PCA plot (left) and PC1 rank (right) of cells assigned to embryonic- and extra-embryonic-like lineages in hEEs. For lineage abbreviations, see Fig. 2a. (d) Table of merged state annotations to connect our three in vivo reference samples (see Methods). Bars represent the number of cells in each original label (log2 transformed) to highlight the difficulty in fine-resolution cell state assignments using machine learning. For in vivo reference lineage abbreviations please refer to Supplementary Table 3. Data sets are indicated as Xiang et al. (triangle), Ma et al. (circle), and Tyser et al. (square). (e) Heatmap of mean CellTypist decision scores between hEE cells and each in vivo reference state (see Methods). Scores were averaged for each hEE cell type and row-scaled to highlight the degree to which they match each respective reference label. Rows and columns are clustered using Euclidean distance. (f) Cosine similarity heatmap comparing average gene expression between hEE and reference states (see Methods and Supplementary Notes). (g) Left: Box plots that show the per-cell module score for Definitive Endoderm (DE) and Extra-embryonic Endoderm (Ex.En) associated transcripts. For lineage abbreviations, refer to the legend for Fig. 2a. Each dot represents a single cell. Boxplot shows interquartile range as bars, median as black midline, and quartile ranges as vertical lines. N = 18,042 cells from 4 independent differentiation experiments. Right: The pie charts represent the proportion of cells within extra-embryonic clusters that are positive for Definitive Endoderm (DE) or Extra-embryonic Endoderm (Ex.En) associated transcripts. N numbers for sample size is shown in the charts, 4 independent differentiation experiments.
Extended Data Fig. 4
Extended Data Fig. 4. The hEE amnion-like lineage exhibits squamous morphology and expresses key primate amnion markers.
(a) Percentage of ISL1 phenotype frequencies in H9 hEEs. The plot shows mean ± SD. N = 297 structures, 7 independent experiments. (b) Representative structures in panel a. Scale bars, 50μm. (c) Left: Schematic of height and length aspect ratio quantification to determine nuclear shape. Right: Ozone graph of nuclear length and height of SOX2+ (blue), ISL1+ (red), and SOX2+ ISL1+ (grey) cells from the hEE phenotypes introduced in A. Each symbol represents one cell. Each shape corresponds to an individual structure. Each graph includes ≥10 aggregates and >80 cells for 3–5 independent experiments. Schematic shows transparent nuclear masks atop of SOX2+ ISL1+, ISL1+, and SOX2+ cells in D5 structures with the central cavity highlighted in yellow and arrows highlighting the nuclear orientation. (d) Co-staining of ISL1 with TFAP2A (left) or GABRP (right) in representative D5 and D6 hEE structures. 5 independent experiments. Scale bar, 20 μm. (e) Bar graph of the proportion of SOX2+, ISL1+, and SOX2+ ISL1+ (double positive) cells. N = 14 structures, 4 independent experiments. Each dot represents the percentage of each cell type in each structure. Plots show mean ± SD. (f) The expression level of primate amnion markers (ISL1, DLX5, TFAP2A, and BMP4) in hEEs. PI-Epi – Post-implantation Epiblast-like (green); AME – Amnion-like (light blue); PI-Epi. L, Postimplantation Epiblast-Late-like (light purple); PS-like, Primitive Streak-like (brown). Colour scale reflects normalised transcript counts. (g) Volcano plot of differentially expressed genes between Amnion-like and Postimplantation Epiblast-like populations in the hEE, including primate amnion markers (TFAP2A, ISL1, and BMP4) upregulated in Amnion-like population (red boxes). Two-tailed, non-parametric Wilcoxon Rank-sum test was applied. (h) Expression of early and late amniotic wave markers identified from Rostovskaya et al. in D4 and D6 hEE structures. Expression matrices are row-scaled, colour scale reflects log2 fold change from centre value. (i-j) Gene Set Enrichment Analysis of upregulated KEGG pathways in PI-Epi vs AME (i) and PI-Epi.L vs AME (j) states in hEEs. Source Data
Extended Data Fig. 5
Extended Data Fig. 5. The expression of key BMP signalling components in the human extra-embryoid lineages.
(a) Top-left: Expression of BMP signalling factors in embryonic- and extra-embryonic-like lineages in D4 and D6 hEEs. Expression matrices are row-scaled, color scale reflects relative expression. Top-right: Normalised BMP2, BMPR1A, and BMP4 transcript counts are shown in boxplots for each state by day. Each dot represents a single cell. Boxplot shows interquartile range as bars, median as black midline and quartile ranges as vertical lines. N = 18,042 cells from 4 independent differentiation experiments. Bottom-left: Barplot data showing fractions of cells per state or day that express BMP2 or BMP4 alone or in combination with BMPR1A. The numbers on the bar plot represent the N of cells analysed. The number are color-coded accordingly: BMP2 or 4 positive = black, BMPR1A positive = white, double positive = blue, and negative = green. Pooled from 4 independent differentiation experiments. Bottom-right: UMAPs show differential co-expression plots of BMP2 or BMP4 with the receptor BMPR1A. (b) Left: SOX2-mCitrine (cyan), SOX17-tdTomato (grey), and pSMAD1/5/9 (Fire intensity gradient on Fiji; purple low, yellow high) in a D4 structure. Right: Percentages of pSMAD1;5;9+ structures in SOX17+ and SOX2+ only structures and hEE outer and inner compartments. hEE (N = 241), SOX2-only (N = 28), SOX17-only (N = 34). 3 independent experiments for hEE and 2 independent experiments for SOX2-only and SOX17-only. Scale bar, 20μm. (c) 3D surface view and single-sections of H2B-GFP, F-ACTIN, SMAD1-RFP (Fire gradient on Fiji; purple low, yellow high), and TFAP2A (Fire gradient on Fiji) in D4 hEE. N = 66 structures, 2 independent experiments. Scale bar, 20 μm. (d) Top: Schematic of hEE and 2D human trophoblast stem cells (hTSCs) in co-culture. Bottom-left: Max intensity projections of ISL1, SOX2, FOXA2, SOX17, CER1 and DAPI in D6 hEEs on hTS 2D cell layer from a front and side view. Yellow, dotted square encloses the inner compartment of hEE. Bottom-right: Percentage of structures with SOX2+ or ISL1+ only efficiencies in inner compartments of control hEEs (N = 489) and hEEs co-cultured on hTSCs (N = 38 structures). 3 independent experiments each. Two-sided unpaired, parametric t-test with Welsch’s correction. The figure shows P values. Plots show mean ± SD. Scale bar, 50 μm. Illustrations in d, credit: A. L. Cox. Source Data
Extended Data Fig. 6
Extended Data Fig. 6. Hypoblast-like specification is required for patterning.
(a) LAMININ expression between embryonic- (green dotted lines) and extra-embryonic-like (red dotted lines) layers. Scale bar, 50 μm. N = 262 D4-D6 structures, 5 independent experiments. (b) A representative SOX2+ aggregate that lacks an extra-embryonic-like layer. Scale bar, 20 μm. N = 262 D4-D6 structures, 5 independent experiments. (c) Kymographs of DAPI fluorescence intensity across a representative cavitated hEE and non-cavitated structure that lacks an extra-embryonic-like layer (obtained from mid-z-section). Yellow lines show positions used to plot intensity profiles. (d) Top: 3D aggregation strategy with primed (mTeSR) hPSCs result in disorganised aggregate formation (wide-field tile scan). Insert image shows a close-up of a disorganised aggregate. Bottom: 3D aggregation strategy with wild-type primed (mTeSR) hPSCs and hEE-derived SOX17-tdTomato+ cells result in organised structure formation (wide-field tile scan). Insert image shows organised hEE formation with PODXL+ central cavities. Scale bars, 20 μm. (e) Left: Percentage of single-cavitated structures in panel d. mTeSR + hEE-derived SOX17-tdTomato+ cell co-culture (N = 439); mTeSR alone (N = 118). Four data points were collected from multiple developmental time points over 2 independent experiments with co-culture trials. The mTeSR-alone group consists of a single time-point from a representative experiment. Right: Percentages of structures that exhibit SOX17-tdTomato+ (N = 410/439) or structures with (endogenous) SOX17+ immunolabelled cells (N = 29/439) from the mTeSR + hEE-derived SOX17-tdTomato+ cell co-culture experiment. An example hEE is provided above the bar plot, circled cells lack tdTomato signal, suggesting their endogenous specification from primed hPSCs. Plots show mean ± SD. Four data points were collected from multiple developmental time points over 2 independent experiments with co-culture trials. Scale bar, 50 μm. (f) wild-type mTeSR-hPSCs co-aggregated with directed-differentiated SOX17-tdTomato+ definitive endoderm cells generated from primed hPSCs (see Methods). The resulting structures show multiple layers of epiblast-like cells (arrowheads) and high inter-variability between structures. N = 81 aggregates from a representative experiment. Scale bar, 50 μm. (g) Wide field tile scans of D4 structures treated with different inhibitors. Scale bars, 100 μm. C–control (N = 220); XAV (N = 101); IWP (N = 132, 2 experiments); SB (N = 125); PD (N = 66); SU (N = 109). The plot shows mean ± SD. 3 independent experiments. (h) Phenotype examples of SB431542-treated structures. Scale bar, 50μm. Control (N = 220); SB (N = 125), 3 independent experiments. (i) Top: Representative D4 hEEs stained with phospho-SMAD2 show active or inactive TGFβ/NODAL in different compartments. Scale bars, 50μm. Bottom: Percentage of phospho-SMAD2+ structures. hEE (N = 186), SOX2-only (N = 81), SOX17-only (N = 15). 3 independent experiments. Each dot represents an independent experiment. Plots show mean ± SD. (j) Area measurements of hEEs. Each dot represents one structure. The midline (black line) represents the median and the dotted line represents the quartiles within each violin plot. C-D1: Control-D1 (N = 109), C-D2: Control-D2 (N = 86), C-D3: Control-D3 (N = 73), C-D4: Control-D4 (N = 97), PD-D4: PD pre-treated D4 (N = 100), SU-D4: SU pre-treated D4 (N = 94). 3 independent experiments. Two-sided unpaired, parametric t-test with Welsch’s correction. ns, non significant p = 0.6789 for C-D2 vs PD-D4; p = 0.2560 for C-D3 vs SU-D4. Illustrationss in d, credit: A. L. Cox. Source Data
Extended Data Fig. 7
Extended Data Fig. 7. WNT, TGFβ/NODAL, MAPK, and FGF signalling show distinct expression patterns within embryonic- and extraembryonic-like lineages.
Expression heatmaps of signalling pathway components in embryonic- (pink) and extra-embryonic-like (green) lineages in the hEE at D4. Normalized expression matrices are row-scaled. Colour scale reflects relative expression level. (a) We found that WNT signalling pathway components are widely expressed in both epiblast- and hypoblast-like cells, with particular enrichment of secreted Wnt inhibitors DKK1, DKK3, and DKK4 in the Hypoblast-like states. (b) TGFβ/NODAL signalling components and transcription factors (NODAL, TGFB1/3, SMAD2, FURIN, PCSK2-7), as well as receptors (TGFBR1/3 and ACVR1B/2A), also show enriched expression within the Hypoblast-like lineages. (c-d) MEK and FGF signalling transcription factors are broadly expressed in both epiblast-like and hypoblast-like cells, although the repertoire of signalling pathway components differ between the two cell states. We observed that epiblast-like cells are the source of two major transcripts, FGF2 and FGF4 (in panel d), highlighting the similarity to primed pluripotent post-implantation epiblast from human embryos shown before. Of note, analysis of FGF receptors revealed an enrichment of FGFR3, FGFR4, and PDGFRB in hypoblast-like cells, but FGFR1, PDGFRA, IGF1R, and EGFR in epiblast-like cells, suggesting differential receptivity to FGF signalling between the two lineages. Postimplantation-Epiblast, PI-Epi-like; Postimplantation-Epiblast Late, PI-Epi.L-like; Hypoblast-1, G1 Hypo-like; Hypoblast-2, G2M/S Hypo-like.
Extended Data Fig. 8
Extended Data Fig. 8. Detailed characterisation of the Anterior Visceral Endoderm-like population in human extra-embryoids.
(a) Left: UMAP of extra-embryonic-like lineages including G1 Hypoblast-like, G2M/S Hypoblast-like, and Anterior Visceral Endoderm-like (AVE) from D4 and D6 hEEs. Right: Differential co-expression plots of AVE markers (CER1 and LEFTY1), along with their corresponding percentage and number of cells that express the indicated gene. (b) Volcano plot of differentially expressed genes that distinguish AVE-like cells from the rest of the Hypoblast-like lineage. AVE-specific genes CER1, LEFTY1/2, FZD5, and GSC are highlighted (red circles). A total of 23 genes display significant differential expression (Bonferroni corrected p-value < 1e-05, average Log2 fold change >= 1). Two-tailed non-parametric Wilcoxon Rank-sum test was applied. (c) Stack projection of 5–10 mid-sections of DAPI, CER1, and T in D3, D4, and D5 hEEs. Yellow circles enclose the inner, epiblast-like compartment. Yellow arrowheads indicate CER1-positive cells within the hypoblast-like layer. N = 205 structures, 10 independent experiments. Scale bar, 50μm. (d) Line graph of CER1 (left) and T (right) expression patterning in D3, D4, and D5 structures. N = 205 structures, 10 independent experiments. Plots show mean ± SD. (e) Top: Schematic of the phenotypic landscape of CER1 and T expression patterning at D5. N = 99 structures, 3 independent experiments. Bottom: Grouped bar graph of average percentages of phenotypes described above in D3 and D5 hEEs (schematics and number codes of phenotypes shown above). N = 128 structures, 7 independent experiments (4 for D3 and 3 for D5). Each dots represent an independent experiment. Plots show mean ± SD. (f) Max intensity projection (left) and surface intensity plots (right) of opposing T and SOX2 gradients within the inner compartment (dotted box) in a representative D5 hEE. Scale bar, 50 μm. 12/99 structures show a T+ gradient. 3 independent experiments. (g) A single section of TCF/Lef:H2B-GFP and T (left) and surface intensity plots (right) in a representative D4 hEE. The white, dotted circle encloses the inner, epiblast-like compartment. N = 125 structures, 2 independent experiments. Scale bar, 50 μm. Source Data
Extended Data Fig. 9
Extended Data Fig. 9. Temporal formation of distinct cell states in human extra-embryoids.
(a) Bar plots of cell number (left) and proportional representation within D4 and D6 time points (right) per cell state in hEEs. PI-Epi, Postimplantation Epiblast-like (green); AME, Amnionic Ectoderm-like (light blue); PI-Epi.L, Postimplantation Epiblast-Late-like (grey); PS-like, Primitive Streak-like (brown); Meso-like, Mesoderm-like (pink); G1 Hypo, Growth 1 Hypoblast-like (red); G2M/S Hypo, Growth 2 Mitosis/ Synthesis Hypoblast-like (yellow); AVE-like, Anterior Visceral Endoderm-like (teal). (b) Heatmap of BMP antagonists (top), positive regulators of transcription factors that induce these antagonists (middle), and BMP inducers (bottom) in hEEs. Normalized expression matrices are row-scaled, colour scale reflects relative expression. (c) Temporal expression of AVE gene module scores (CER1, LEFTY1, OTX2, HESX1, NOG, and DKK1) in AVE-like, Hypoblast-like, AME and PI-Epi lineages in the hEEs at D4 and D6. Plots show minimum and maximum values (black, vertical lines) and median (black, horizontal lines). (d) Representative D5 hEE generated from CER1;LEFTY1 double knock-out (dKO) hPSCs (N = 61) and control (N = 489). Percentage of ISL1+ hEEs generated from RUES2 (control) and CER1;LEFTY1 dKO RUES2 hPSCs. 2 independent experiments for dKO, 3 independent experiments for control. Plots show the mean and each dot represents the percentage of structures within a tile scan. Scale bars, 20 μm. Source Data
Extended Data Fig. 10
Extended Data Fig. 10. Characteristics of Epithelial-to-mesenchymal (EMT) in hEEs.
(a) Top: T, SNAI1, and NCAD expressions at a representative D5 hEE. The white rectangle indicates ingressed SNAI1+ and NCAD+ cells. Double-headed arrowheads indicate the nuclear orientation of cells. Colour scale represents NCAD intensity gradient. N = 25 structures, 3 independent experiments. Scale bars, 20μm. Bottom left: Schematic of growth factors treatments between D4-D5 of hEE development (see Methods). Bottom right: Percentage of T+ hEEs. C-D4: Control D4 (N = 176), C-D5: Control D5 (N = 160), LDN (D5) (N = 61), Noggin (D5) (N = 79), XAV (D5) (N = 109), SB (D5) (N = 68), PD (D5) (N = 111), SU (D5) (N = 51). 3 or 4 independent experiments per group. Each dot represents the total percentage of an experiment. Plots show mean ± SD. Post-hoc Dunnett’s multiple comparison test, one-way ANOVA. The figure shows P values. (b) Principal curves of hallmark gastrulation markers over pseudo-time (Post-implantation epiblast- to Primitive Streak- to Mesoderm-like states) in hEEs (as shown in Fig. 4f). (c) Time-lapse live-imaging of indicated reporter activity. White dotted circles enclose the epiblast-like compartment. Insert image shows an epithelial cell (yellow arrowheads) ingress through EMT. The yellow line shows the organisation of T+ cells. N = 7 hEEs in 2 separate movies. Scale bar, 20 µm. (d) Left: OTX2 expression of D5 structures from RUES-GLR hPSCs. Yellow, dashed lines represent the embryonic and extra-embryonic compartments. Scale bar, 50 µm. Right: Percentage of structures that exhibit different OTX2 expressions within the inner compartment. Control (N = 180), XAV (N = 202), SB (N = 170), PD (N = 224), SU (N = 206), LDN (N = 135). 2 independent experiments for LDN and 4 independent experiments for the rest. Each dot represents an independent experiment. Image in a, credit: A. L. Cox. Source Data

Comment in

References

    1. Moris N, et al. An in vitro model of early anteroposterior organization during human development. Nature. 2020;582:410–415. doi: 10.1038/s41586-020-2383-9. - DOI - PubMed
    1. Zheng Y, et al. Controlled modelling of human epiblast and amnion development using stem cells. Nature. 2019;573:421–425. doi: 10.1038/s41586-019-1535-2. - DOI - PMC - PubMed
    1. Simunovic M, et al. A 3D model of a human epiblast reveals BMP4-driven symmetry breaking. Nat. Cell Biol. 2019;21:900–910. doi: 10.1038/s41556-019-0349-7. - DOI - PubMed
    1. Sanaki-Matsumiya M, et al. Periodic formation of epithelial somites from human pluripotent stem cells. Nat. Commun. 2022;13:2325. doi: 10.1038/s41467-022-29967-1. - DOI - PMC - PubMed
    1. Karzbrun E, et al. Human neural tube morphogenesis in vitro by geometric constraints. Nature. 2021;599:268–272. doi: 10.1038/s41586-021-04026-9. - DOI - PMC - PubMed

Publication types