. 2023 Jul 19;43(29):5277-5289.
doi: 10.1523/JNEUROSCI.0063-23.2023. Epub 2023 Jun 27.

βII-Spectrin Is Required for Synaptic Positioning during Retinal Development

Affiliations

βII-Spectrin Is Required for Synaptic Positioning during Retinal Development

Debalina Goswami-Sewell et al. J Neurosci. .

Abstract

Neural circuit assembly is a multistep process where synaptic partners are often born at distinct developmental stages, and yet they must find each other and form precise synaptic connections with one another. This developmental process often relies on late-born neurons extending their processes to the appropriate layer to find and make synaptic connections to their early-born targets. The molecular mechanism responsible for the integration of late-born neurons into an emerging neural circuit remains unclear. Here, we uncovered a new role for the cytoskeletal protein βII-spectrin in properly positioning presynaptic and postsynaptic neurons to the developing synaptic layer. Loss of βII-spectrin disrupts retinal lamination, leads to synaptic connectivity defects, and results in impaired visual function in both male and female mice. Together, these findings highlight a new function of βII-spectrin in assembling neural circuits in the mouse outer retina.SIGNIFICANCE STATEMENT Neurons that assemble into a functional circuit are often integrated at different developmental time points. However, the molecular mechanism that guides the precise positioning of neuronal processes to the correct layer for synapse formation is relatively unknown. Here, we show a new role for the cytoskeletal scaffolding protein, βII-spectrin in the developing retina. βII-spectrin is required to position presynaptic and postsynaptic neurons to the nascent synaptic layer in the mouse outer retina. Loss of βII-spectrin disrupts positioning of neuronal processes, alters synaptic connectivity, and impairs visual function.

Keywords: neurodevelopment; retina; spectrins; synapse.


Figures

Figure 1.
Figure 1.
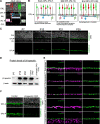
βII-spectrin is localized to the OPL during synaptogenesis (A–F). Schematic drawing of the adult retina. The retina is subdivided into different three nuclear layers (i.e., ONL, INL, GCL) and two synaptic layers (i.e., OPL, IPL; A). Cone photoreceptors (red) synapse to the dendrites of horizontal cells (light blue) and dendrites of cone bipolars (light red). Rod photoreceptors (green) synapse to the axon terminal of horizontal cells (light blue) and the dendrites of rod bipolars (light green; A). Development of the OPL (B). Horizontal cells (light blue) first make contacts to cones (red) in the presumptive OPL where cone bipolars (light red) and rod bipolars (light green) begin to extend their dendrites. From P9 to P13, bipolar neurons continue to extend their dendrites to the OPL and make synaptic connections to their targets. By P21, synapse formation in the retina is largely complete (B). Antibody staining of βII-spectrin (green) in wild-type retinas shows protein localization in the OPL that gradually increases from P7 to P30 (C). Nuclei is stained with DAPI (C). Western blot analysis reveals βII-spectrin protein levels increase from P7 to P21 in wild-type retinas, and significantly reduced in βII-spectrin CKO compared with controls at P30 (D). β-Actin protein is shown as loading control. Co-labeling of βII-spectrin (green) with known cell type-specific markers in wild-type retinas at P30 (E). βII-spectrin protein expression (green) is significantly reduced in the OPL of βII-spectrin CKO retinas compared with controls at P30 (F). Nuclei is stained with DAPI. Scale bar shown on images.
Figure 2.
Figure 2.
βII-spectrin mRNA is highly expressed in the INL and significantly reduced in rod bipolars and cone bipolars of βII-spectrin CKO animals (A, B). βII-spectrin mRNA (green) was detected via in situ hybridization using RNAscope technology at P13. A significant reduction of βII-spectrin mRNA was observed in the ONL and INL but not the GCL in βII-spectrin CKO compared with controls (A). Quantification of the total number of βII-spectrin mRNA puncta in each nuclear layer (i.e., ONL, INL, GCL) is shown in A. DAPI staining was used to visualize the distinct nuclear layers. The number of puncta was normalized to an area of 0.01mm2 by computing the surface area of each individual retinal section. Antibody staining was performed immediately after in situ hybridization to detect βII-spectrin mRNA within individual cell types at P13 (B). Quantification of βII-spectrin mRNA puncta (0.8 µm in size) per cell is shown in B with n representing the total number of cells analyzed per animal. βII-spectrin mRNA (white) is highly expressed in rod bipolars (anti-PKC, magenta) in controls and significantly reduced in βII-spectrin CKO. Similarly, cone bipolars (anti-Scgn, magenta) also express βII-spectrin mRNA in controls and show a reduction in the number of puncta in βII-spectrin CKO. However, βII-spectrin mRNA levels in horizontal cells (anti-Calb, magenta) are not statistically different between controls and βII-spectrin CKO. Data are represented as mean values ± SEM. Statistical significance determined by an unpaired two-tailed Student's t test. ns p > 0.05, **p < 0.01, ***p = 0.0001, ****p < 0.0001. Scale bar shown for each figure.
Figure 3.
Figure 3.
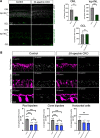
Loss of βII-spectrin results in lamination defects in the outer retina (A–E). Retinal sections of control and βII-spectrin CKO stained with DAPI reveal no gross morphologic defects (A). Close examination of the OPL show several displaced nuclei in βII-spectrin CKO as depicted by the yellow arrows. Insets are zoomed images of yellow dotted boxed region. Measurements of the layer thickness show no significant difference between the ONL and INL but a significant decrease in the OPL of βII-spectrin CKO compared with controls (A). Disruption of βII-spectrin results in lamination defects where processes from horizontal cells (anti-Calb, magenta) and dendrites of rod bipolars (anti-PKC, green) failed to be confined to the OPL and instead sprout into the ONL (B). Quantification of the total number of sprouts observed in controls and βII-spectrin CKO (B). Total cell counts of horizontal cells and rod bipolars are shown in B. Expression and localization of presynaptic PSD-95 (magenta) and CtBP2 (cyan) are also affected in βII-spectrin CKO compared with controls (C). Loss of presynaptic Elfn1 (green) and postsynaptic mGluR6 (magenta) protein expression is seen in the OPL because of disruption of βII-spectrin (C). Postsynaptic Trpm1 (green) forms a puncta-like structure along the dendrites of rod bipolars in controls but is significantly reduced in βII-spectrin CKO (D). Quantification and localization of presynaptic and postsynaptic markers (i.e., Bsn, CtBP2, Elfn1, Trpm1) at P30 (E). The number of Bassoon puncta (∼0.6 µm in size) and CtBP2 (1.0 µm in size) is significantly reduced in the OPL and increased in the ONL because of loss of βII-spectrin. Presynaptic Elfn1 puncta (∼0.6 µm in size) and postsynaptic Trpm1 puncta (∼0.6 µm in size) are significantly reduced in the OPL in βII-spectrin CKO compared with controls. Images are shown as confocal sections. Data are represented as mean values ± SEM. Statistical significance determined by an unpaired two-tailed Student's t test. ns p > 0.05, *p < 0.05, **p < 0.01, ****p < 0.0001. Scale bar shown for each figure.
Figure 4.
Figure 4.
Minimal defects in the cone pathway because of loss of βII-spectrin (A–C). Presynaptic PSD-95 protein (green) is enriched in rod terminals as seen in controls (A). Redistribution of PSD-95 protein expression is observed in βII-spectrin CKO where there is loss in the OPL and ectopic expression in the ONL (A). Dendrites of cone bipolars (magenta, anti-Scgn) show minimal number of sprouts in βII-spectrin CKO compared with controls (A). Bassoon (anti-Bsn, green) is localized to the OPL in controls but reduced in the OPL and ectopically expressed in the ONL of βII-spectrin CKO animals at P30 (B). Cone terminals (anti-CAR, magenta) are normally positioned in the OPL and express Bassoon in both controls and βII-spectrin CKO as depicted by white arrows (B). Quantification of the total number of cone bipolar sprouts, number of cone terminals in OPL, and number of presynaptic Bassoon (Bsn) puncta in cone terminals (C). The number of cone terminals in the OPL and the number of Bsn puncta were not statistically different (p > 0.05) between controls and βII-spectrin CKO. Statistical significance determined by an unpaired two-tailed Student's t test. ns p > 0.05, **p < 0.005. Scale bar, 10 µm.
Figure 5.
Figure 5.
Synaptic defects and abnormal retinal responses in βII-spectrin CKO (A–G). Transmission electron microscopy (TEM) reveals rod terminals (yellow) are not localized to the OPL (white dotted lines) but mispositioned in the ONL (white arrows) because of loss of βII-spectrin (A). The number of rod terminals in the OPL were counted in both controls and βII-spectrin CKO (B). Data are represented as mean values ± SEM. Statistical significance determined by an unpaired two-tailed Student's t test. ****p < 0.0001. Rod terminals were classified as either triad, dyad, monad, or empty (B). A total of 1555 rod terminals were found in the OPL and analyzed in controls; however, only 296 rod terminals were observed in the OPL of βII-spectrin CKO (B). The frequency of triads, dyads, monads, and empty in controls and βII-spectrin CKO revealed an increase in the number of empty rod terminals because of disruption of βII-spectrin (B). Individual electroretinogram (ERG) traces from controls (black line) and βII-spectrin CKO (blue line) are shown at different scotopic or rod-driven stimulus intensities (C). Scotopic b-wave amplitudes are significantly reduced in βII-spectrin CKO (blue line, n = 10 from five mice) compared with controls (black line, n = 8 from four mice; D). Data points within the rod operative range are fitted with a hyperbolic saturating curve using the Naka-Rushton equation. Stimulus response plot of scotopic a-wave amplitudes of dark-adapted controls (black line, n = 8 from four mice) and βII-spectrin CKO (blue line, n = 10 from five mice; E). Statistical significance determined by Holm–Sidak method for multiple comparisons in D, E and F. ns p > 0.05, **p < 0.005, ****p < 0.0001. Rod-driven implicit times are shown for controls (black line, n = 8 from four mice) and βII-spectrin CKO (blue line, n = 10 from five mice; F). Isolated amplitudes of the cone b-wave and a-wave using the paired flash method (G). Data represented as mean values ± SD. Statistical significance determined by an unpaired two-tailed Student's t test (ns p > 0.05).
Figure 6.
Figure 6.
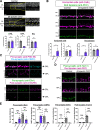
Developmental analysis of βII-spectrin CKO (A–C). At P9, dendrites of rod bipolars (green, anti-PKC) and processes from horizontal cells (magenta, anti-calb) form one continuous laminated structure in controls (A). However, several mispositioned dendrites of rod bipolars such as gaps (yellow arrows) and sprouts (white arrows) are observed in βII-spectrin CKO. Mispositioned processes or sprouts from horizontal cells (white arrows) are not detected until P11 in βII-spectrin CKO and continue to P13 (A). Quantification of the total number of rod bipolar and horizontal cell sprouts per 100-µm length of OPL across the different time points (B). Few sprouts are observed in controls compared with βII-spectrin CKO from P9 to P13 (A, B). Statistical significance determined by an unpaired two-tailed Student's t test. ns p > 0.05, **p < 0.005, ***p < 0.001, ****p < 0.0001. Processes from other presynaptic and postsynaptic neurons are normally positioned to the nascent OPL at P9 (C). Cone terminals (green, anti-Sopsin) and processes from horizontal cells (magenta, anti-calb) are localized to the developing OPL in both controls and bII-spectrin CKO. Rods (green, anti-Rhodopsin) and dendrites of cone bipolars (magenta, anti-Scgn) are largely confined to the OPL at P9 in controls and bII-spectrin CKO. Dendrites of rod bipolars (green, anti-PKC) begin to display gaps and loss of presynaptic protein expression (magenta, anti-PSD-95) as depicted by yellow arrows because of loss of βII-spectrin. Scale bar shown on figures.

References

    1. Abd-El-Barr MM, Pennesi ME, Saszik SM, Barrow AJ, Lem J, Bramblett DE, Paul DL, Frishman LJ, Wu SM (2009) Genetic dissection of rod and cone pathways in the dark-adapted mouse retina. J Neurophysiol 102:1945–1955. 10.1152/jn.00142.2009 - DOI - PMC - PubMed
    1. Bennett V, Lorenzo DN (2013) Spectrin- and ankyrin-based membrane domains and the evolution of vertebrates. Curr Top Membr 72:1–37. - PubMed
    1. Bennett V, Lorenzo DN (2016) An adaptable spectrin/ankyrin-based mechanism for long-range organization of plasma membranes in vertebrate tissues. Curr Top Membr 77:143–184. - PubMed
    1. Bozzi Y, Casarosa S, Caleo M (2012) Epilepsy as a neurodevelopmental disorder. Front Psychiatry 3:19. 10.3389/fpsyt.2012.00019 - DOI - PMC - PubMed
    1. Burger CA, Jiang D, Mackin RD, Samuel MA (2021) Development and maintenance of vision's first synapse. Dev Biol 476:218–239. 10.1016/j.ydbio.2021.04.001 - DOI - PMC - PubMed

Publication types

LinkOut - more resources