. 2023 Jun 27;14(1):3292.
doi: 10.1038/s41467-023-38810-0.

Age-associated B cells predict impaired humoral immunity after COVID-19 vaccination in patients receiving immune checkpoint blockade

Affiliations

Age-associated B cells predict impaired humoral immunity after COVID-19 vaccination in patients receiving immune checkpoint blockade

Juan Carlos Yam-Puc et al. Nat Commun. .

Abstract

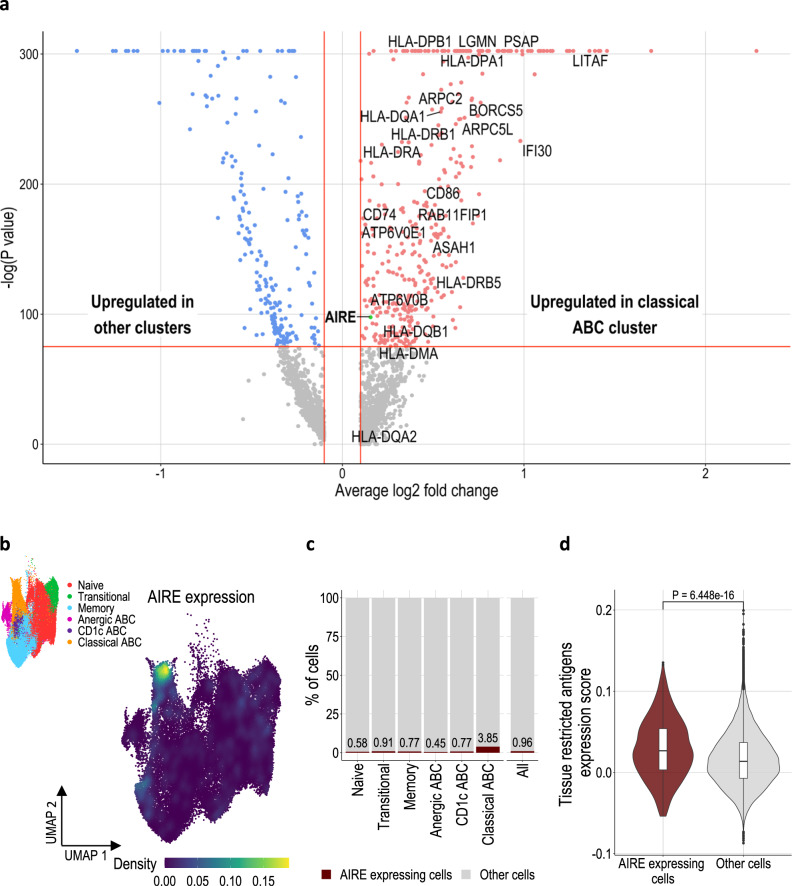
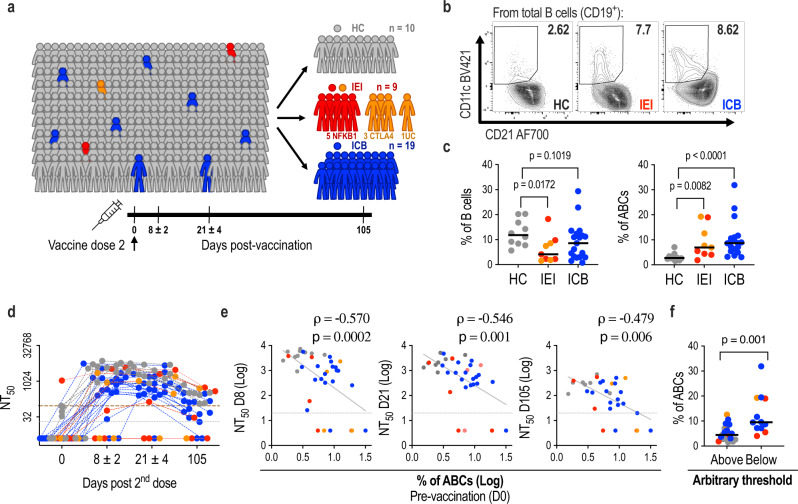
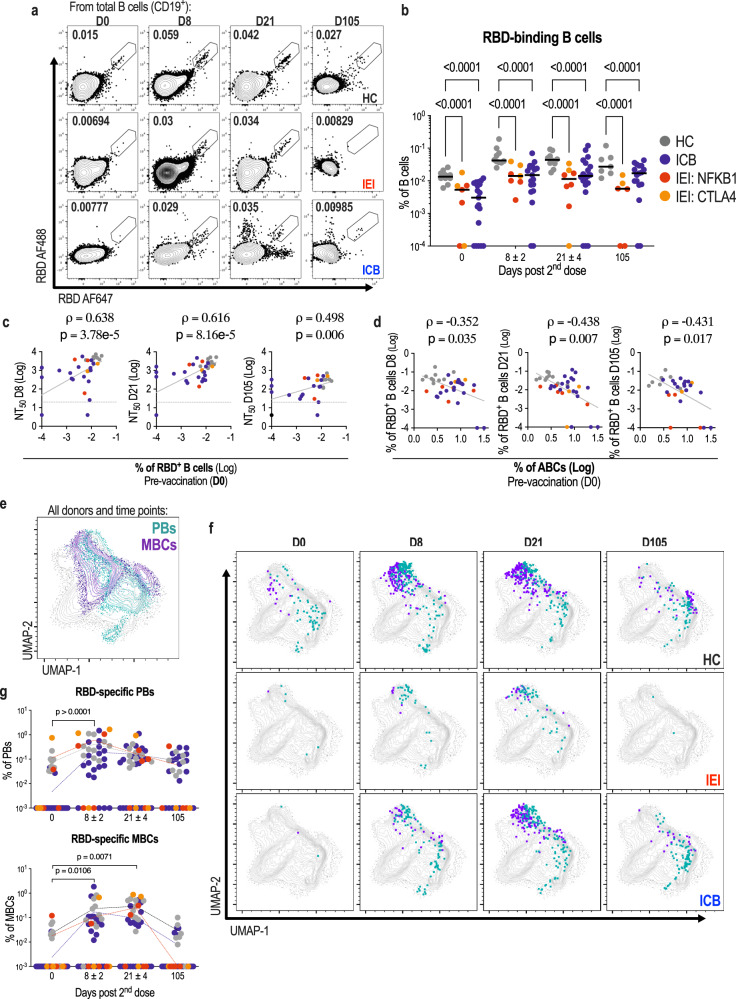
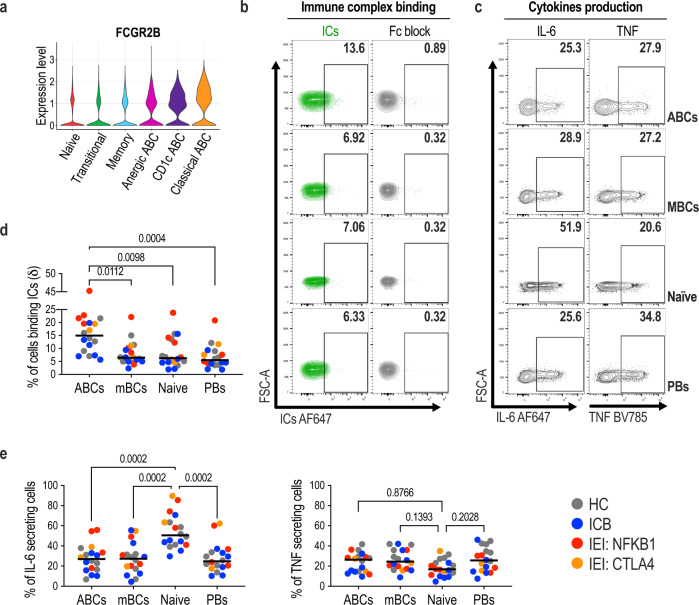
Age-associated B cells (ABC) accumulate with age and in individuals with different immunological disorders, including cancer patients treated with immune checkpoint blockade and those with inborn errors of immunity. Here, we investigate whether ABCs from different conditions are similar and how they impact the longitudinal level of the COVID-19 vaccine response. Single-cell RNA sequencing indicates that ABCs with distinct aetiologies have common transcriptional profiles and can be categorised according to their expression of immune genes, such as the autoimmune regulator (AIRE). Furthermore, higher baseline ABC frequency correlates with decreased levels of antigen-specific memory B cells and reduced neutralising capacity against SARS-CoV-2. ABCs express high levels of the inhibitory FcγRIIB receptor and are distinctive in their ability to bind immune complexes, which could contribute to diminish vaccine responses either directly, or indirectly via enhanced clearance of immune complexed-antigen. Expansion of ABCs may, therefore, serve as a biomarker identifying individuals at risk of suboptimal responses to vaccination.


Conflict of interest statement

The authors declare no competing interests.

Figures

Fig. 1
Fig. 1. Single cell transcriptional signature of ABCs.
Magnetically enriched B cells from PBMCs were analysed through droplet-based single cell RNA sequencing technology (n = 52402). UMAPs of cells from all individuals coloured by (a) annotated Louvain clusters, (b) health condition (HC healthy controls, ICB immune-checkpoint blockade treated cancer patients, IEI CTLA-4/NFKB1, inborn errors of immunity, CTLA-4 and NFKB1 mutants respectively, SLE systemic lupus erythematosus patients), and (c) gender. Dots represent a single cell. d Proportion of total cells from each health condition belonging to each cluster, clusters coloured as indicated. e Expression of 46 genes in each B cell cluster which define the different subpopulations. Dot size represents proportion of cells within a cluster expressing the indicated gene and colours represent the average expression level. f Heatmap representing scaled expression values of genes associated with antigen uptake, processing and class-II presentation in each cluster. g Gene ontology enrichment analysis of biological processes associated with upregulated genes in classical ABCs. GO terms with highest fold enrichments are ranked by -log (P value). Statistical testing via Fisher’s Exact test with correction for false discovery rate. Dot size is proportional to the fold enrichment.
Fig. 2
Fig. 2. Classical ABC expression of AIRE and AIRE target genes.
a Volcano plot displaying the differentially expressed genes in ABCs compared to other B cell clusters. Upregulated genes associated with antigen uptake, processing and MHC class II presentation are labelled. AIRE gene is coloured in green. Statistical testing via two-tailed Wilcoxon rank sum test with Bonferroni correction. b UMAP of all B cells coloured by kernel density estimation of AIRE expression level across all identified B cell subsets. UMAP showing the different B cell clusters inset. c Percentage of cells which are AIRE+ in each cluster. d Violin plot comparing expression score of tissue restricted antigens (gene set from Yamano et al.) in AIRE expressing cells (n = 503) and all other cells (n = 51899). In the boxplot, the centre, lower and upper bounds of the box correspond to the median, first quartile and third quartile respectively. The upper(lower) whisker extends from the box to the largest(smallest) value no further than 1.5 * IQR from the box upper(lower) bound (where IQR is the inter-quartile range, or distance between the first and third quartiles). Statistical testing via one-tailed Wilcoxon rank sum test.
Fig. 3
Fig. 3. Correlation between frequency of ABCs and neutralising antibody response to COVID-19 vaccination.
a Cohort details. Samples were collected at days 0, 8, 21 and 105 after the 2nd dose of BNT162b2 vaccine (healthy controls (HC), grey; patients with rare inborn errors of immunity (IEI): NFKB1 red, CTLA-4 and unclassified orange; patients treated with ICB, blue). b Representative FACS contour plots of CD21loCD11c+ ABCs in CD19 B cells. c Frequencies of B cells within total lymphocytes and frequencies of ABCs within total B cells, at day 0. HC = 10, IEI = 9, ICB = 19 biologically independent samples. Differences between groups were determined using two-tailed non-parametric Mann–Whitney tests. d Neutralising antibody titres at 50% inhibition (NT50) against wildtype SARS-CoV-2 at indicated timepoints after 2nd vaccine dose. The limit of detection of the assay is indicated (grey dotted line at NT50 = 20), and an arbitrary threshold at the highest NT50 from the HC group at day 0 (brown dashed line). e Correlations between frequencies of ABCs amongst B cells at day 0 and NT50s at days 8, 21 and 105. Two-tailed Spearman’s rank correlation coefficients (rho) and p values are shown, together with indicative linear regression lines. f Frequencies of ABCs amongst CD19+ B cells for individuals above and below the arbitrary threshold indicated in panel d at day 105. Above = 19, Below = 12 biologically independent samples. Differences between groups were determined using two-tailed non-parametric Mann–Whitney tests. c–f each point represents one individual.
Fig. 4
Fig. 4. Correlation between frequency of RBD-specific B cells and neutralising antibody response to COVID-19 vaccination.
a Representative flow cytometry plots displaying RBD-specific B cell populations amongst total CD19+ B cells for different study groups 0, 8, 21 and 105 days (D0, D8, D21 and D105) after the second dose of BNT162b2 vaccine. b Frequencies of RBD-specific B cells amongst all CD19+ B cells in HC, IEI and ICB patients at days 0, 8, 21 and 105. Each dot represents a single individual (healthy controls (HC, D0 = 10, D8 = 10, D21 = 10, D105 = 7), grey; patients with rare inborn errors of immunity (IEI, D0 = 7, D8 = 7, D21 = 8, D105 = 6): (NFKB1) red, (CTLA-4 and unclassified) orange; patients treated with ICB (ICB, D0 = 19, D8 = 19, D21 = 19, D105 = 17), blue). Two-way ANOVA with Tukey’s multiple comparisons test for statistical analysis. c Correlations between frequencies of RBD-specific B cells amongst all CD19+ B cells at day 0 and NT50s at days 8, 21 and 105. Two-tailed Spearman’s rank correlation coefficients (rho) and p values are shown, together with indicative linear regression lines. d Correlations between frequencies of ABCs amongst B cells at day 0 and frequencies of RBD-specific B cells at days 8, 21 and 105. Two-tailed Spearman’s rank correlation coefficients (rho) and p values are shown, together with indicative linear regression lines. e UMAP projection of total B cells from all donors at all time points displaying memory B cell (MBCs, purple) and plasmablast (PBs, green) populations. f RBD-specific B cells with MBC (purple) or PB (green) phenotype are shown at days 0, 8, 21 and 105 (columns) for HC (top), IEI (middle) and ICB (bottom) groups. g Kinetics of RBD-binding cell frequencies amongst MBCs or PBs. Statistical significance between groups was determined using ordinary one-way ANOVA. Samples with no detectable levels of RBD-specific cells are plotted at an arbitrary value of 10-4 in b and 10-3 in g.
Fig. 5
Fig. 5. ABCs express higher levels of Fc γ receptor IIB and bind higher proportions of immune complexes than other B cells subsets.
a Violin plots displaying the expression levels of FCGR2B on different B cell subsets. b Representative flow cytometry contour plots displaying immune complex binding (contour plots in green) with or without a previous incubation with Fc block by age-associated B cells (ABCs), memory B cells (MBCs), naïve B cells and plasmablasts (PBs). c Representative flow cytometry contour plots displaying cytokines production (IL-6 and TNF, PMA/ionomycin stimulation for 5 h, 37 °C, brefeldin A) by ABCs, MBCs, naïve B cells and PBs. d Frequencies of ICs binding cells in different B cell subsets. e Frequencies of cells with IL-6- and TNF-secreting capacity in different B cell subsets. Where specified, statistical significance between groups was determined using one-way ANOVA. d, e HC = 6, IEI = 6, ICB = 6 biologically independent samples.

References

    1. Baden LR, et al. Efficacy and safety of the mRNA-1273 SARS-CoV-2 vaccine. N. Engl. J. Med. 2021;384:403–416. doi: 10.1056/NEJMoa2035389. - DOI - PMC - PubMed
    1. Polack FP, et al. Safety and efficacy of the BNT162b2 mRNA Covid-19 vaccine. N. Engl. J. Med. 2020;383:2603–2615. doi: 10.1056/NEJMoa2034577. - DOI - PMC - PubMed
    1. Schmidt AL, et al. COVID-19 vaccination and breakthrough infections in patients with cancer. Ann. Oncol. 2022;33:340–346. doi: 10.1016/j.annonc.2021.12.006. - DOI - PMC - PubMed
    1. Monin L, et al. Safety and immunogenicity of one versus two doses of the COVID-19 vaccine BNT162b2 for patients with cancer: interim analysis of a prospective observational study. Lancet Oncol. 2021;22:765–778. doi: 10.1016/S1470-2045(21)00213-8. - DOI - PMC - PubMed
    1. Goshen-Lago T, et al. Serologic status and toxic effects of the SARS-CoV-2 BNT162b2 vaccine in patients undergoing treatment for cancer. JAMA Oncol. 2021;7:1507–1513. doi: 10.1001/jamaoncol.2021.2675. - DOI - PMC - PubMed

Publication types