. 2023 Jun 27;8(1):22.
doi: 10.1038/s41539-023-00172-z.

Knee flexion of saxophone players anticipates tonal context of music

Affiliations

Knee flexion of saxophone players anticipates tonal context of music

Nádia Moura et al. NPJ Sci Learn. .

Abstract

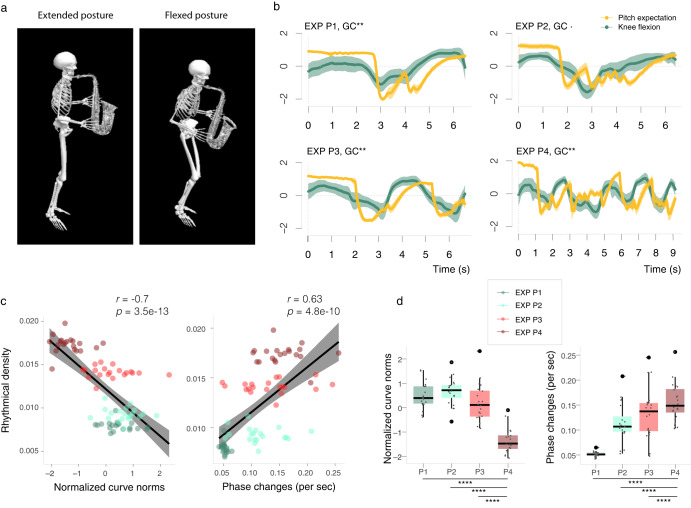
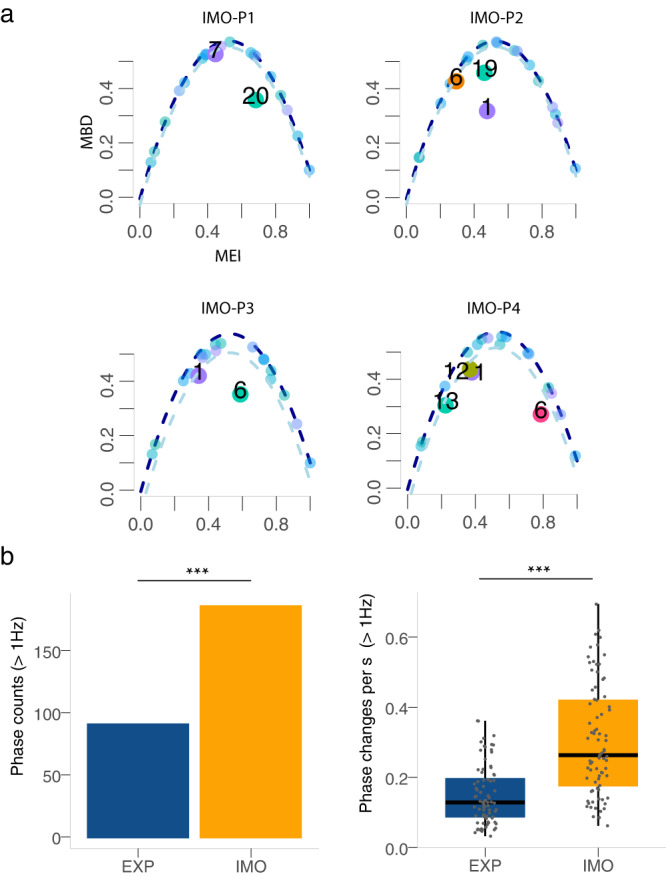
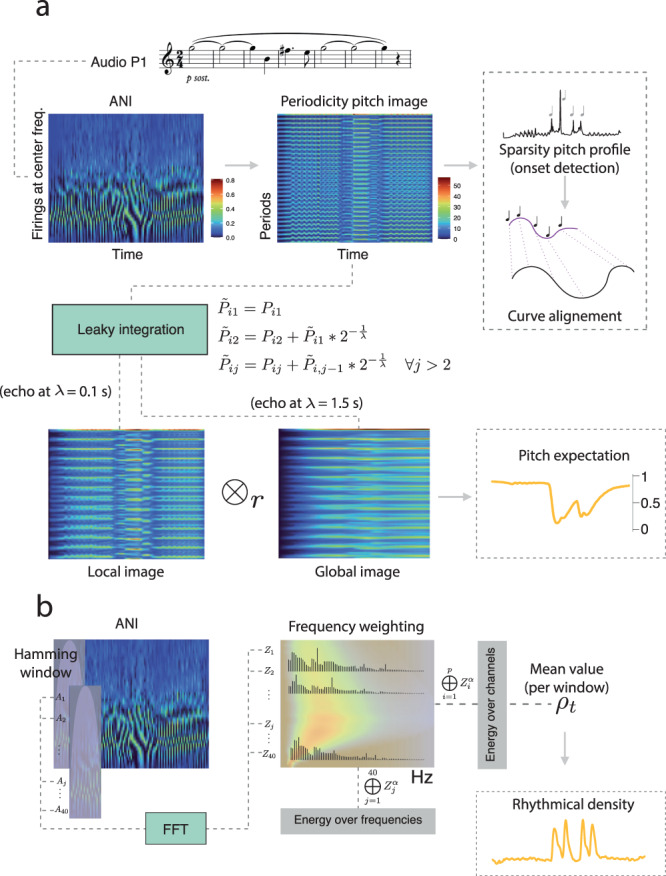
Music performance requires high levels of motor control. Professional musicians use body movements not only to accomplish and help technical efficiency, but to shape expressive interpretation. Here, we recorded motion and audio data of twenty participants performing four musical fragments varying in the degree of technical difficulty to analyze how knee flexion is employed by expert saxophone players. Using a computational model of the auditory periphery, we extracted emergent acoustical properties of sound to inference critical cognitive patterns of music processing and relate them to motion data. Results showed that knee flexion is causally linked to tone expectations and correlated to rhythmical density, suggesting that this gesture is associated with expressive and facilitative purposes. Furthermore, when instructed to play immobile, participants tended to microflex (>1 Hz) more frequently compared to when playing expressively, possibly indicating a natural urge to move to the music. These results underline the robustness of body movement in musical performance, providing valuable insights for the understanding of communicative processes, and development of motor learning cues.


Conflict of interest statement

The authors declare no competing interests.

Figures

Fig. 1
Fig. 1. Tonal and rhythmical relations to knee flexion.
a 3D model of one participant in extended (left) and flexed (right) posture. b Comparison of the average Hadamard product curves between right and left knees to pitch expectation profiles (curves were normalized for a better visualization). Granger causality (GC) interactions are noted for a lag equal to 0.15 s onset equivalence; error bands were calculated at a 95% bootstrap confidence interval. c The two plots show rhythmical density (vertical axis) compared to: weighted and normalized L2 norms (area bellow the curve) and phase changes per second of all curves in the expressive condition (EXP). Confidence intervals for the regression line are at 95%. d Boxplots showing differences across groups of passages for curve norms and phase changes. Statistical comparisons were made using the Wilcoxon signed-rank test (with Bonferroni-Holm correction for multiple comparisons). The centre line of each boxplot represents the data median and the bounds of the box show the interquartile range. The whiskers represent the bottom 25% and top 25% of the data range–excluding outliers, which are represented by a rounded point. –Significance levels are noted as follows: p < 0.1, *p < 0.05, **p < 0.01, ***p < 0.001, ****p < 0.0001, n.s. (not significant).
Fig. 2
Fig. 2. Analyses of participants in immobile condition (IMO) during performance.
a Functional outlier analysis representation for each passage P1–P4. The vertical axis is the modified band depth (MBD) and the horizontal the modified epigraph index (MEI); larger points and numbers represent outliers related to participants. b Boxplots of weighted phase counts and phase changes per second comparing expressive (EXP) and immobile (IMO) conditions. Statistical comparisons were made using the one-sided Wilcoxon signed-rank test (with Bonferroni-Holm correction). The centre line of each boxplot represents the data median and the bounds of the box show the interquartile range. The whiskers represent the bottom 25% and top 25% of the data range. –Statistical significance is measured as detailed in Fig. 1.
Fig. 3
Fig. 3. Schematic of the auditory modeling framework.
a The auditory nerve image (ANI) is estimated from a mono audio signal and then converted into periodicity pitch image from which we extract different pitch profiles for further analysis. Leaky integration is performed for echoes of 0.1, 1.5 s on the periodicity pitch image to obtain two images of different echo whose Pearsons' correlation index between running columns gives the pitch expectation profile. b Calculation of the rhythmical density from ANI. The operator ⊕ is used to denote the column/row sums of the matrix Zα.

References

    1. Leman, M. Embodied Music Cognition and Mediation Technology (MIT Press, 2008).
    1. Leman, M. The Expressive Moment: How Interaction (with Music) Shapes Human Empowerment (MIT Press, 2016).
    1. Chang A, Kragness HE, Livingstone SR, Bosnyak DJ, Trainor LJ. Body sway reflects joint emotional expression in music ensemble performance. Sci. Rep. 2019;9:1–10. - PMC - PubMed
    1. Chang A, Livingstone SR, Bosnyak DJ, Trainor LJ. Body sway reflects leadership in joint music performance. Proc. Natl. Acad. Sci. USA. 2017;114:E4134–E4141. doi: 10.1073/pnas.1617657114. - DOI - PMC - PubMed
    1. Tsay C-J. Sight over sound in the judgment of music performance. Proc. Natl. Acad. Sci. USA. 2013;110:14580–14585. doi: 10.1073/pnas.1221454110. - DOI - PMC - PubMed