. 2023 Dec;123(12):2755-2770.
doi: 10.1007/s00421-023-05256-7. Epub 2023 Jun 27.

Development and validation of dynamic bioenergetic model for intermittent ergometer cycling

Affiliations

Development and validation of dynamic bioenergetic model for intermittent ergometer cycling

Julius Lidar et al. Eur J Appl Physiol. 2023 Dec.

Abstract

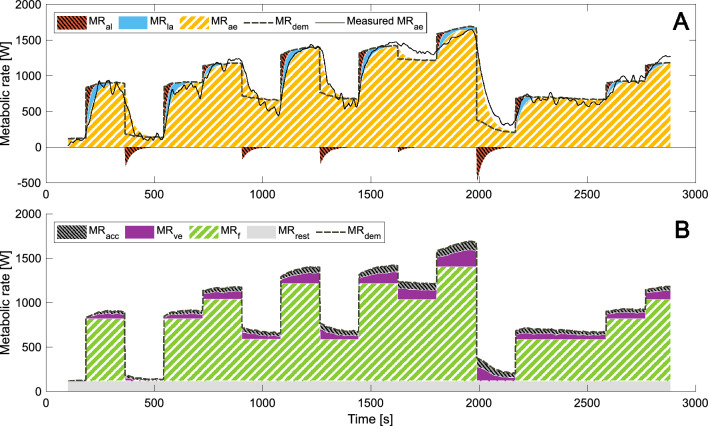
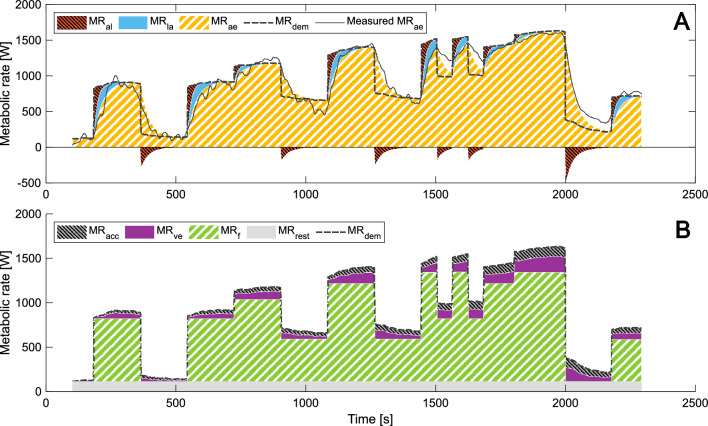
Purpose: The aim of this study was to develop and validate a bioenergetic model describing the dynamic behavior of the alactic, lactic, and aerobic metabolic energy supply systems as well as different sources of the total metabolic energy demand.

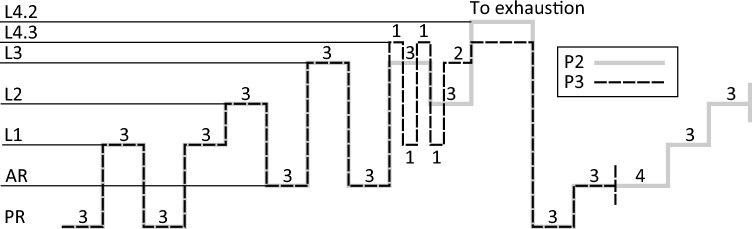
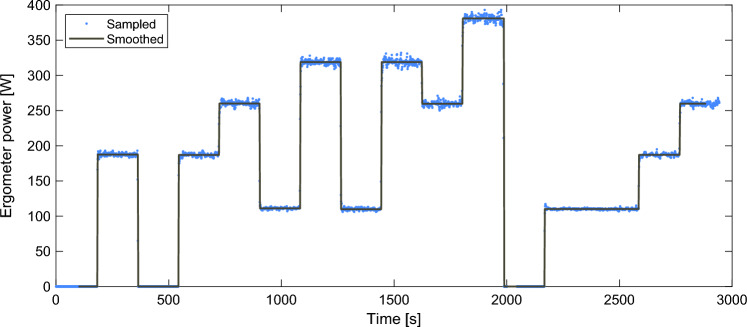
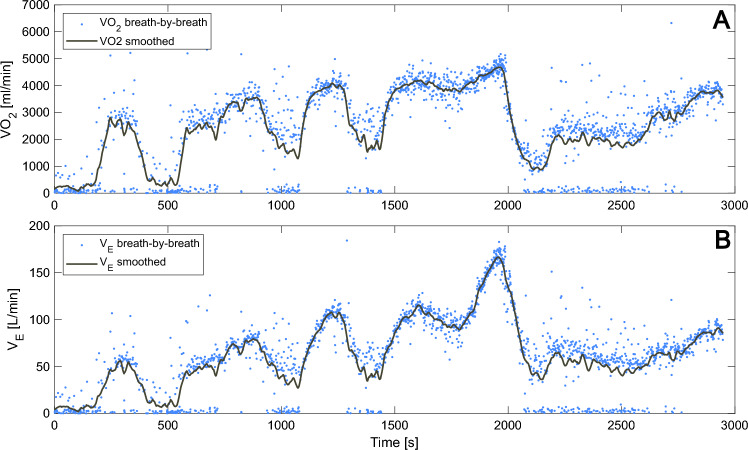
Methods: The bioenergetic supply model consisted of terms for the alactic, lactic, and aerobic system metabolic rates while the demand model consisted of terms for the corresponding metabolic rates of principal cycling work, pulmonary ventilation, and accumulated metabolites. The bioenergetic model was formulated as a system of differential equations and model parameters were estimated by a non-linear grey-box approach, utilizing power output and aerobic metabolic rate (MRae) data from fourteen cyclists performing an experimental trial (P2) on a cycle ergometer. Validity was assessed by comparing model simulation and measurements on a similar follow-up experimental trial (P3).

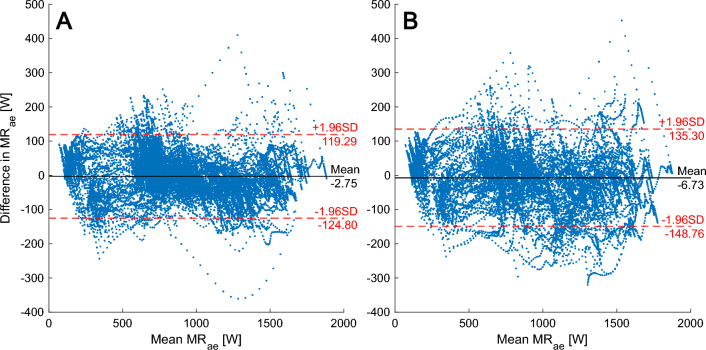
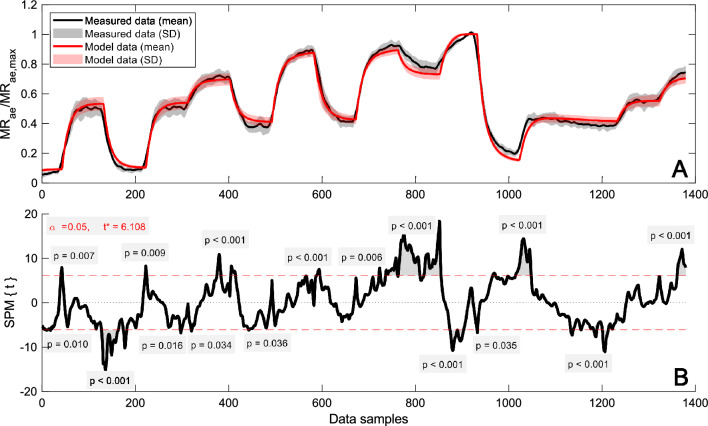
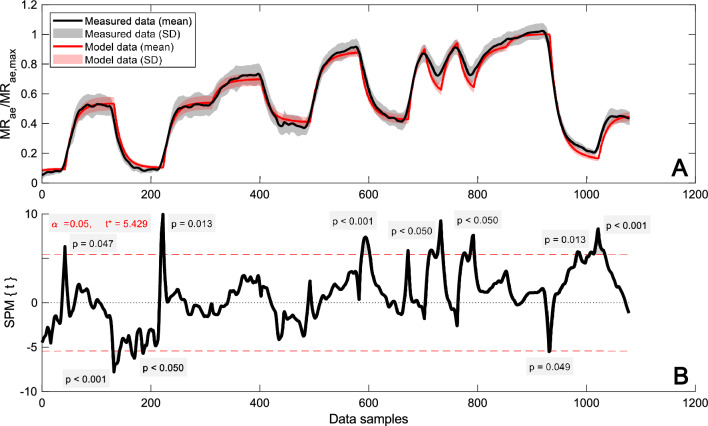
Results: The root mean square error between modelled and measured MRae was 61.9 ± 7.9 W and 79.2 ± 30.5 W for P2 and P3, respectively. The corresponding mean absolute percentage error was 8.6 ± 1.5% and 10.6 ± 3.3% for P2 and P3, respectively.

Conclusion: The validation of the model showed excellent overall agreement between measured and modeled MRae during intermittent cycling by well-trained male cyclist. However, the standard deviation was 38.5% of the average root mean square error for P3, indicating not as good reliability.

Keywords: Anaerobic work capacity; Cycle ergometer; Oxygen deficit; Oxygen kinetics; Parameter estimation.


Conflict of interest statement

The authors declare that there is no conflict of interest regarding the publication of this article.

Figures

Fig. 1
Fig. 1
Intermittent test protocols used during test day 2 (P2) and test day 3 (P3) where the numbers reflect the duration in minutes of each period of constant power. The constant power levels are shown to the left where PR is passive rest (no pedaling), AR is active rest, and L1, L2, etc., are individual ergometer power levels (see Table 1) intentionally designed to activate the subjects’ different metabolic energy supply systems to varying degrees
Fig. 2
Fig. 2
Sampled and smoothed ergometer power output for one representative subject for P2. The data was smoothed by setting the power output equal to the mean power output for each section. Additionally, the 100 first seconds and final 60 s were deleted to avoid smoothing error and reduce calculation times
Fig. 3
Fig. 3
Sampled and smoothed breath-by-breath oxygen uptake (Panel A) and expiratory minute ventilation as STPD (Panel B) for one representative subject for P2. Data was smoothed using locally weighted linear regression with a 40-s time window and resampled to 0.5 Hz using linear interpolation
Fig. 4
Fig. 4
Bland–Altman plot showing the mean of and difference between measured and modeled MRae for all data samples from all subjects during P2 (Panel A) and P3 (Panel B) including the model-to-measurement mean difference and 95% confidence intervals. 94.6% of the data points reside inside the confidence interval for P2 and 94.0% for P3
Fig. 5
Fig. 5
Time resolved mean and SD (Panel A) and statistical parametric mapping from the two-tailed paired t-test (Panel B) of measured and modeled individual MRae normalized with MRae,max for P2 (n = 11). Results from three subjects are omitted due to deviations in duration during one or more periods (same subjects as in Fig. 6). Data for the period leading to volitional exhaustion has been stretched/squeezed to allow comparison across the subjects. The dashed lines show the critical t-value, indicating the limit for significant differences (p < 0.05) between measured and modeled data
Fig. 6
Fig. 6
Time resolved mean and SD (Panel A) and statistical parametric mapping from the two-tailed paired t-test (Panel B) of measured and modeled individual MRae normalized with MRae,max for P3 (n = 11). Results from three subjects are omitted due to deviations in duration during one or more periods (same subjects as in Fig. 5). Data for the period leading to volitional exhaustion has been stretched/squeezed to allow comparison across the subjects. The dashed lines show the critical t-value, indicating the limit for significant differences (p < 0.05) between measured and modeled data
Fig. 7
Fig. 7
Metabolic supply rates (Panel A) and metabolic demand rates (Panel B) for P2 in a representative subject (S8). MRal is alactic metabolic rate, MRla lactic metabolic rate, MRae modeled aerobic metabolic rate, MRdem total metabolic demand rate and Measured MRae is the smoothed measured aerobic metabolic rate. MRacc is metabolic demand rate due to accumulated metabolites, MRve metabolic demand rate due to ventilation, MRf metabolic demand rate due to the fundamental work and MRrest the metabolic demand rate at rest. In Panel A MRrest is included in MRae
Fig. 8
Fig. 8
Metabolic supply rates (Panel A) and metabolic demand rates (Panel B) for P3 in a representative subject (S8). MRal is alactic metabolic rate, MRla lactic metabolic rate, MRae modeled aerobic metabolic rate, MRdem total metabolic demand rate and Measured MRae is the smoothed measured aerobic metabolic rate. MRacc is metabolic demand rate due to accumulated metabolites, MRve metabolic demand rate due to ventilation, MRf metabolic demand rate due to the fundamental work and MRrest the metabolic demand rate at rest. In Panel A MRrest is included in MRae

References

    1. Aaron EA, Seow KC, Johnson BD, Dempsey JA. Oxygen cost of exercise hyperpnea: implications for performance. J Appl Physiol. 1992;1985(72):1818–1825. doi: 10.1152/jappl.1992.72.5.1818. - DOI - PubMed
    1. Ainegren M, Jensen K, Rosdahl H. Breathing resistance in automated metabolic systems is high in comparison with the Douglas Bag method and previous recommendations. Proc Inst Mech Eng Part P J Sports Eng Technol. 2018;232:122–130. doi: 10.1177/1754337117715946. - DOI
    1. Andersson EP, Bachl P, Schmuttermair A, Staunton CA, Stöggl TL. Anaerobic work capacity in cycling: the effect of computational method. Eur J Appl Physiol. 2022;122:2637–2650. doi: 10.1007/s00421-022-05038-7. - DOI - PMC - PubMed
    1. Artiga Gonzalez A, Bertschinger R, Brosda F, Dahmen T, Thumm P, Saupe D. Kinetic analysis of oxygen dynamics under a variable work rate. Hum Mov Sci. 2019;66:645–658. doi: 10.1016/j.humov.2017.08.020. - DOI - PubMed
    1. Beltrami FG, Froyd C, Mamen A, Noakes TD. The validity of the Moxus modular metabolic system during incremental exercise tests: impacts on detection of small changes in oxygen consumption. Eur J Appl Physiol. 2014;114:941–950. doi: 10.1007/s00421-014-2825-x. - DOI - PubMed

Grants and funding

LinkOut - more resources