. 2023 Jun 12;15(12):3158.
doi: 10.3390/cancers15123158.

Integrating Multi-Omics Analysis for Enhanced Diagnosis and Treatment of Glioblastoma: A Comprehensive Data-Driven Approach

Affiliations

Integrating Multi-Omics Analysis for Enhanced Diagnosis and Treatment of Glioblastoma: A Comprehensive Data-Driven Approach

Amir Barzegar Behrooz et al. Cancers (Basel). .

Abstract

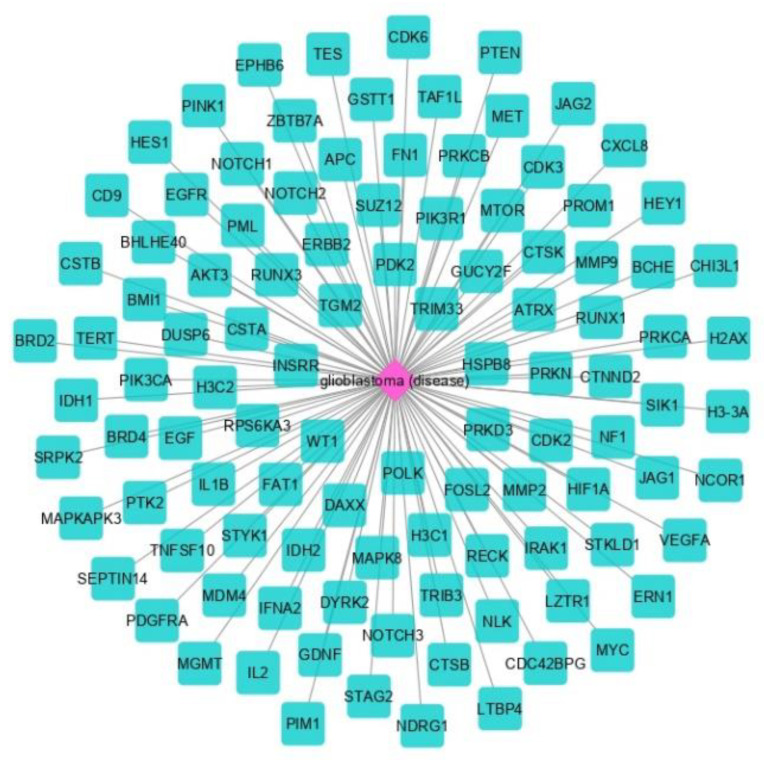
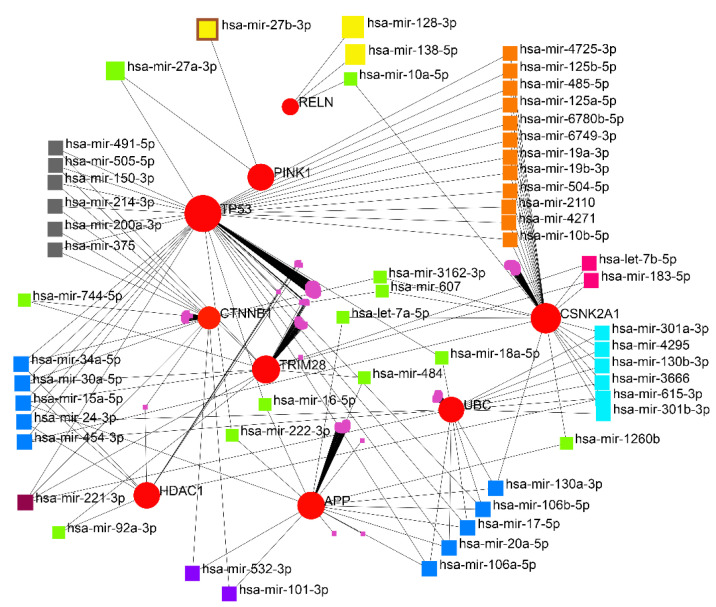
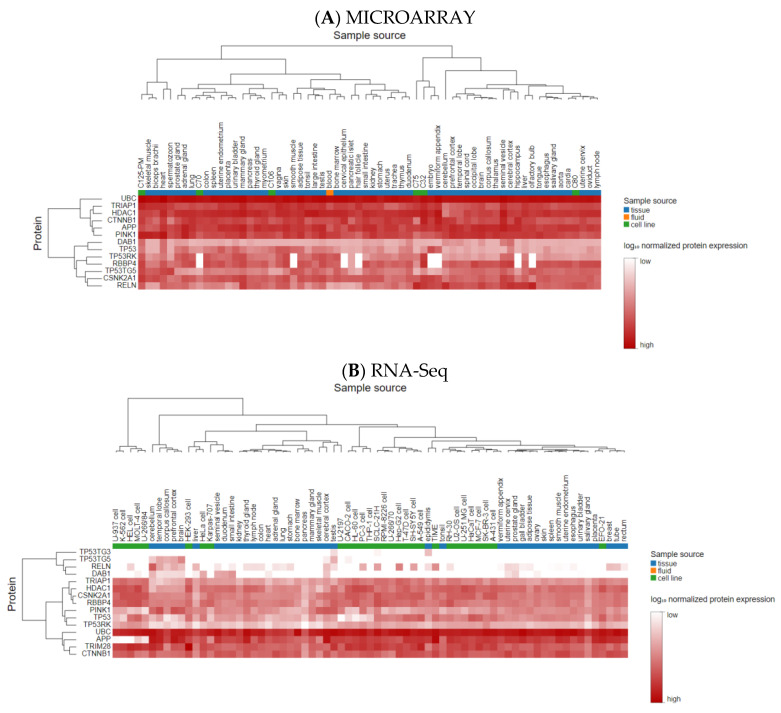
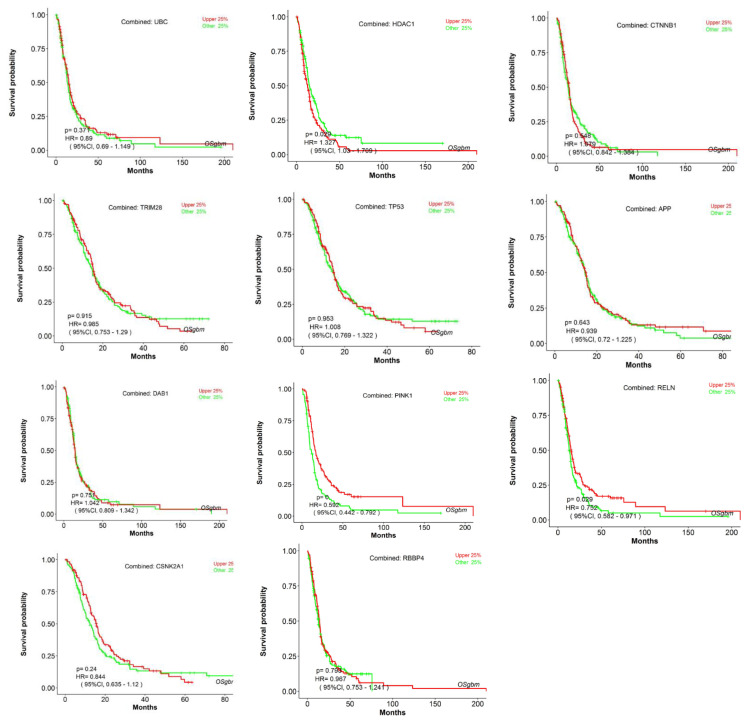
The most aggressive primary malignant brain tumor in adults is glioblastoma (GBM), which has poor overall survival (OS). There is a high relapse rate among patients with GBM despite maximally safe surgery, radiation therapy, temozolomide (TMZ), and aggressive treatment. Hence, there is an urgent and unmet clinical need for new approaches to managing GBM. The current study identified modules (MYC, EGFR, PIK3CA, SUZ12, and SPRK2) involved in GBM disease through the NeDRex plugin. Furthermore, hub genes were identified in a comprehensive interaction network containing 7560 proteins related to GBM disease and 3860 proteins associated with signaling pathways involved in GBM. By integrating the results of the analyses mentioned above and again performing centrality analysis, eleven key genes involved in GBM disease were identified. ProteomicsDB and Gliovis databases were used for determining the gene expression in normal and tumor brain tissue. The NetworkAnalyst and the mGWAS-Explorer tools identified miRNAs, SNPs, and metabolites associated with these 11 genes. Moreover, a literature review of recent studies revealed other lists of metabolites related to GBM disease. The enrichment analysis of identified genes, miRNAs, and metabolites associated with GBM disease was performed using ExpressAnalyst, miEAA, and MetaboAnalyst tools. Further investigation of metabolite roles in GBM was performed using pathway, joint pathway, and network analyses. The results of this study allowed us to identify 11 genes (UBC, HDAC1, CTNNB1, TRIM28, CSNK2A1, RBBP4, TP53, APP, DAB1, PINK1, and RELN), five miRNAs (hsa-mir-221-3p, hsa-mir-30a-5p, hsa-mir-15a-5p, hsa-mir-130a-3p, and hsa-let-7b-5p), six metabolites (HDL, N6-acetyl-L-lysine, cholesterol, formate, N, N-dimethylglycine/xylose, and X2. piperidinone) and 15 distinct signaling pathways that play an indispensable role in GBM disease development. The identified top genes, miRNAs, and metabolite signatures can be targeted to establish early diagnostic methods and plan personalized GBM treatment strategies.

Keywords: autophagy; biomarker selection; glioblastoma; inflammationomics; metabolomics; network analysis; pathway analysis; personalized therapy.


Conflict of interest statement

The authors declare no conflict of interest.

Figures

Figure 1
Figure 1
An overview of the bioinformatics approaches used in this study. We created four gene lists from several different study levels. By merging these gene lists and performing various analyses, 11 genes and five key miRNAs were identified.
Figure 2
Figure 2
Glioblastoma-related proteins identified by the NeDRex plugin.
Figure 3
Figure 3
Modules of disease identified by the MuST algorithm (A) and genes (B) that interconnect them. Five essential genes were identified: MYC, EGFR, PIK3CA, SUZ12, and SPRK2. Additionally, IRAK1, PTK2, and BMI1 represent bridging roles between the disease modules.
Figure 4
Figure 4
Gene regulatory network obtained from eleven identified proteins. A wide range of interacting genes-miRNAs was determined.
Figure 5
Figure 5
The scheme of the relationship between the five identified miRNAs and their targets. hsa-mir-221-3p and hsa-mir-30a-5p showed a higher degree and betweenness of the centrality levels.
Figure 6
Figure 6
The heatmap of the expression of eleven genes in normal brain tissue (A) based on a microarray and (B) based on RNA-Seq.
Figure 7
Figure 7
The results of correlation analysis between eleven identified genes. Ten positive correlations were found between UBC (APP), HDAC1 (TP53, RBBP4, TRIM28, and CTNNB1), RBBP4 (CTNNB1 and TP53), and TRIM28 (TP53, RBBP4, and CSNK2A1), and eight negative correlations were found between RBBP4 (APP), PINK1 (TRIM28, RBBP4, TP53, and HDAC1), and DAB1 (UBC, HDAC1, and TP53). *: p < 0.05, **: p < 0.01, ***: p < 0.001.
Figure 8
Figure 8
Survival analysis. Analysis of the prognostic value of identified genes using a combined cohort with pooling all datasets (Cancer Genome Atlas (TCGA), Gene Expression Omnibus (GEO), and Chinese Glioma Genome Atlas (CGGA)) together in OSgbm. The survival analysis results were presented using a Kaplan–Meier (KM) plot with a hazard ratio (HR) and log-rank p-value.
Figure 9
Figure 9
The results of gene ontology analysis between eleven identified genes: (A) molecular function; (B) cellular components. Darker shades have greater significance.
Figure 10
Figure 10
The association of the KEGG pathway enrichment analysis results with eleven identified genes. Darker shades are more significant.
Figure 11
Figure 11
The association of metabolic pathway enrichment analysis results with 182 metabolites: (A) based on the KEGG database; (B) based on the SMPDB database.
Figure 12
Figure 12
Gene–metabolite interaction network. The factors involved in the relationship between TP53, CTNNB1, CSNK2A1, and RELN with APP were further investigated.
Figure 13
Figure 13
The determination of the top 25 SNPs using the MetaboAnalyst 5.0 database.

References

    1. Fekrirad Z., Barzegar Behrooz A., Ghaemi S., Khosrojerdi A., Zarepour A., Zarrabi A., Arefian E., Ghavami S. Immunology Meets Bioengineering: Improving the Effectiveness of Glioblastoma Immunotherapy. Cancers. 2022;14:3698. doi: 10.3390/cancers14153698. - DOI - PMC - PubMed
    1. Samiei E., Seyfoori A., Toyota B., Ghavami S., Akbari M. Investigating Programmed Cell Death and Tumor Invasion in a Three-Dimensional (3D) Microfluidic Model of Glioblastoma. Int. J. Mol. Sci. 2020;21:3162. doi: 10.3390/ijms21093162. - DOI - PMC - PubMed
    1. Shojaei S., Koleini N., Samiei E., Aghaei M., Cole L.K., Alizadeh J., Islam M.I., Vosoughi A.R., Albokashy M., Butterfield Y., et al. Simvastatin increases temozolomide-induced cell death by targeting the fusion of autophagosomes and lysosomes. FEBS J. 2020;287:1005–1034. doi: 10.1111/febs.15069. - DOI - PubMed
    1. Shojaei S., Alizadeh J., Thliveris J., Koleini N., Kardami E., Hatch G.M., Xu F., Hombach-Klonisch S., Klonisch T., Ghavami S. Statins: A new approach to combat temozolomide chemoresistance in glioblastoma. J. Investig. Med. 2018;66:1083–1087. doi: 10.1136/jim-2018-000874. - DOI - PubMed
    1. Rong L., Li N., Zhang Z. Emerging therapies for glioblastoma: Current state and future directions. J. Exp. Clin. Cancer Res. 2022;41:142. doi: 10.1186/s13046-022-02349-7. - DOI - PMC - PubMed