. 2023 Jun 6;12(12):1563.
doi: 10.3390/cells12121563.

GPCR Binding and JNK3 Activation by Arrestin-3 Have Different Structural Requirements

Affiliations

GPCR Binding and JNK3 Activation by Arrestin-3 Have Different Structural Requirements

Chen Zheng et al. Cells. .

Abstract

Arrestins bind active phosphorylated G protein-coupled receptors (GPCRs). Among the four mammalian subtypes, only arrestin-3 facilitates the activation of JNK3 in cells. In available structures, Lys-295 in the lariat loop of arrestin-3 and its homologue Lys-294 in arrestin-2 directly interact with the activator-attached phosphates. We compared the roles of arrestin-3 conformational equilibrium and Lys-295 in GPCR binding and JNK3 activation. Several mutants with enhanced ability to bind GPCRs showed much lower activity towards JNK3, whereas a mutant that does not bind GPCRs was more active. The subcellular distribution of mutants did not correlate with GPCR recruitment or JNK3 activation. Charge neutralization and reversal mutations of Lys-295 differentially affected receptor binding on different backgrounds but had virtually no effect on JNK3 activation. Thus, GPCR binding and arrestin-3-assisted JNK3 activation have distinct structural requirements, suggesting that facilitation of JNK3 activation is the function of arrestin-3 that is not bound to a GPCR.

Keywords: GPCR; JNK3; arrestin; conformation; signaling bias.


Conflict of interest statement

The authors declare no conflict of interest.

Figures
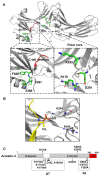
Figure 1
Figure 1
Arrestin-3 structure and mutations. (A). The crystal structure of arrestin-3 (PDB: 3P2D [3]) with selected elements highlighted to indicate the positions of mutations, which are shown in the insets: 3A: I386A, V387A, F388A; RE: R170E; DR: D291R. (B). The K294 (corresponding to K295 of arrestin-3) of arrestin-2 interacts with the phosphorylated GPCR C-terminus (shown in yellow; PDB 4JQI [42]. (C). Schematic diagram of the arrestin-3 linear sequence with mutations indicated.
Figure 2
Figure 2
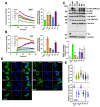
GPCR binding of arrestin-3 mutants with shifted conformational equilibrium. The results of the NanoBiT complementation assay (performed as described in Methods) for β2AR (A) and M2R (B) with WT arrestin-3 and indicated mutants. After the addition of the nanoluciferase substrate, the total luminescence was measured for 20 min until it reached the steady state. Then the agonist (10 μM isoproterenol for β2AR, 10 μM carbachol for M2R) was added, and the luminescence was measured for 40–50 min. Representative results are shown as traces. The receptor binding was normalized to the basal signal without an agonist (read at 20 min). The bars represent the mean ± SEM of four independent experiments performed in triplicate. (C) Arrestin-3-dependent JNK3 activation. HEK293 arrestin-2/3 KO cells [30] were co-transfected with Venus or the indicated Venus-tagged arrestin-3 constructs, HA-ASK1 and HA-JNK3α2. Phosphorylation of JNK3 was analyzed by western blot 48 h post-transfection. Upper panel: representative Western blots of phosphor-JNK3α2 and transfected proteins (to show equal expression). Lower panel: Quantification of the phospho-JNK3α2 values. The bars represent means ± SEM of three independent experiments. Data points from each experiment are shown as dots on the bar graphs. The statistical significance of the differences shown, as follows: according to Dunnett’s post hoc comparison to WT arr3: *, p < 0.05; ***, p < 0.001; or Bonferroni’s post hoc comparison to Δ7: aa, p < 0.01; aaa, p < 0.001; and to Tr: bb, p < 0.01; ns, the difference between the indicated groups is not significant. (D) Representative images of the subcellular localization of the arr3 mutants in arrestin-null HEK293 cells. The Venus-tagged arr3 mutants were transfected into cells alongside ASK1 and HA-JNK3 in conditions identical to those used to measure JNK activation (C). The cells were counterstained with NucBlue and imaged live on an Olympus confocal microscope. (E) The intensity of Venus fluorescence (488 nm) was quantified with Nikon NIS-Elements software and expressed as nuclear fluorescence per pixel (upper panel) or total nuclear fluorescence as a percentage of total cellular fluorescence (lower panel). ***—p < 0.001 Dunnett’s post hoc comparison to WT arr3.
Figure 3
Figure 3
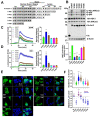
The effect of C-terminal deletions on arrestin-3-dependent JNK3 activation and GPCR binding. (A) Stepwise deletions in the C-tail of arrestin-3. The nuclear export signal disrupted by ∆393 and ∆389 is indicated. (B) Arrestin-3-dependent JNK3 activation is not affected by the deletion of six C-terminal residues but sharply declines thereafter. Upper panel: representative Western blots of phosphor-JNK3α2 and transfected proteins (to show equal expression). Lower panel: Quantification of the phosphor-JNK3α2 values. The bars represent the mean ± SEM of three independent experiments performed in triplicate. Data points from each experiment are shown as dots on the bar graphs. Statistical analysis was performed by one-way ANOVA followed by Dunnett’s post hoc comparison. ***, p < 0.001 to WT arr3. Binding of the C-tail deletion mutants with β2AR (C) and M2R (D) was performed as described in Methods. The bars represent the mean ± SEM of four independent experiments. Data points from each experiment are shown as dots on the bar graphs. The statistical significance of the differences is shown according to Dunnett’s post hoc comparison to WT arr3 as follows: *, p < 0.05; ***, p < 0.001. (E) Representative images of the subcellular localization of the arr3 mutants in arrestin-null HEK293 cells. The Venus-tagged arr3 truncation mutants were transfected into cells alongside ASK1 and HA-JNK3 in conditions identical to those used to measure JNK activation (as in Figure 2C). The cells were counterstained with NucBlue and imaged live on an Olympus confocal microscope. (F) The intensity of Venus fluorescence (488 nm) was quantified with Nikon NIS-Elements software and expressed as nuclear fluorescence per pixel (upper panel) or total nuclear fluorescence as a percentage of total cellular fluorescence (lower panel). **, p < 0.01; *** p < 0.001 Dunnett’s post hoc comparison to WT arr3.
Figure 4
Figure 4
K295 substitutions yield diverse effects on arrestin-3 recruitment to β2AR. NanoBiT complementation assay results for β2AR with indicated arrestin-3 mutants: (A) WT group; (B) 3A group; (C) Tr393 group; (D) RE group; (E) DR group. The curves are colored as follows: arrestin-3 WT, green; pre-activated mutants, gray; +K295A, blue; +K295E, orange. After the addition of the nanoluciferase substrate, the total luminescence was measured for 20 min until it reached the steady state. Then the agonist (10 μM isoproterenol) was added, and the luminescence was measured for 40 min. Representative results are shown as traces. The receptor binding was normalized to the basal signal without an agonist (read at 20 min). The bars represent the mean ± SEM of four independent experiments performed in triplicate. Data points from each experiment are shown as dots on the bar graphs. Statistical significance of the differences is shown as follows: according to Dunnett’s post hoc comparison; **, p < 0.01; ***, p < 0.001 to WT arr3; or Bonferroni’s post hoc comparison #, p < 0.05; ###, p < 0.001 between indicated groups.
Figure 5
Figure 5
The effect of K295 substitutions on arrestin-3 recruitment to M2R. The results of the NanoBiT complementation assay (performed as described in Methods) for M2R with the indicated arrestin-3 mutants: (A) WT group; (B) 3A group; (C) Tr393 group; (D) RE group; (E) DR group. The curves are colored as follows: arrestin-3 WT, green; pre-activated mutants, gray; +K295A, blue; +K295E, orange. After the addition of the nanoluciferase substrate, the total luminescence was measured for 20 min until it reached the steady state. Then the agonist (10 μM carbachol) was added, and the luminescence was measured for 40 min. Representative results are shown as traces. The receptor binding was normalized to the basal signal without an agonist (read at 20 min). The bars represent the mean ± SEM of four independent experiments performed in triplicate. Data points from each experiment are shown as dots on the bar graphs. The statistical significance of the differences is shown as follows: according to Dunnett’s post hoc comparison *, p < 0.05; ***, p < 0.001 to WT arr3; or Bonferroni’s post hoc comparison ###, p < 0.001 between indicated groups.
Figure 6
Figure 6
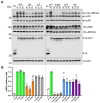
The effect of K295 substitutions on arrestin-3-dependent JNK3 activation. (A) Western blot analysis of JNK3 activation. HEK293 arrestin-2/3 KO cells [30] were co-transfected with Venus or the indicated Venus-tagged arrestin-3 constructs, HA-JNK3α2 and HA-ASK1. K, A, and E refer to K295, K295A, and K295E. Ve indicates Venus only (no arrestin-3 control). (B) Quantification of blots. The relative JNK3 activation was normalized to total JNK3 expression. The bars represent the mean ± SEM of three independent experiments. Data points from each experiment are shown as dots on the bar graphs. The statistical significance of the differences is shown as follows: according to Dunnett’s post hoc comparison ***, p < 0.001 to WT arr3; according to Bonferroni’s post hoc comparison aa, p < 0.01 to 3A. Note that except for the 3A group, no differences between the parental protein and its K295A and K295E derivates were detected.

Update of

References

    1. Carman C.V., Benovic J.L. G-protein-coupled receptors: Turn-ons and turn-offs. Curr. Opin. Neurobiol. 1998;8:335–344. doi: 10.1016/S0959-4388(98)80058-5. - DOI - PubMed
    1. Indrischek H., Prohaska S.J., Gurevich V.V., Gurevich E.V., Stadler P.F. Uncovering missing pieces: Duplication and deletion history of arrestins in deuterostomes. BMC Evol. Biol. 2017;17:163. doi: 10.1186/s12862-017-1001-4. - DOI - PMC - PubMed
    1. Zhan X., Gimenez L.E., Gurevich V.V., Spiller B.W. Crystal structure of arrestin-3 reveals the basis of the difference in receptor binding between two non-visual arrestins. J. Mol. Biol. 2011;406:467–478. doi: 10.1016/j.jmb.2010.12.034. - DOI - PMC - PubMed
    1. Barak L.S., Ferguson S.S., Zhang J., Caron M.G. A beta-arrestin/green fluorescent protein biosensor for detecting G protein-coupled receptor activation. J. Biol. Chem. 1997;272:27497–27500. doi: 10.1074/jbc.272.44.27497. - DOI - PubMed
    1. Peterson Y.K., Luttrell L.M. The Diverse Roles of Arrestin Scaffolds in G Protein-Coupled Receptor Signaling. Pharmacol. Rev. 2017;69:256–297. doi: 10.1124/pr.116.013367. - DOI - PMC - PubMed

Publication types

MeSH terms

LinkOut - more resources