. 2023 Jun 17;12(12):1653.
doi: 10.3390/cells12121653.

The Effect of Xevinapant Combined with Ionizing Radiation on HNSCC and Normal Tissue Cells and the Impact of Xevinapant on Its Targeted Proteins cIAP1 and XIAP

Affiliations

The Effect of Xevinapant Combined with Ionizing Radiation on HNSCC and Normal Tissue Cells and the Impact of Xevinapant on Its Targeted Proteins cIAP1 and XIAP

Julia Fleischmann et al. Cells. .

Abstract

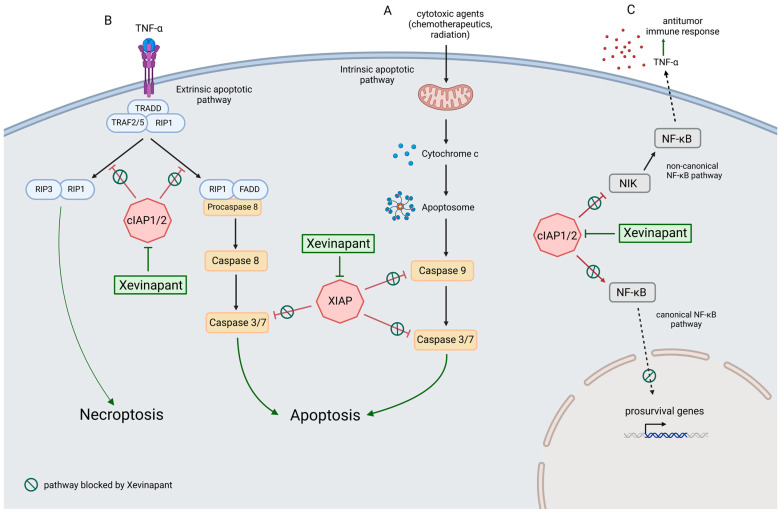
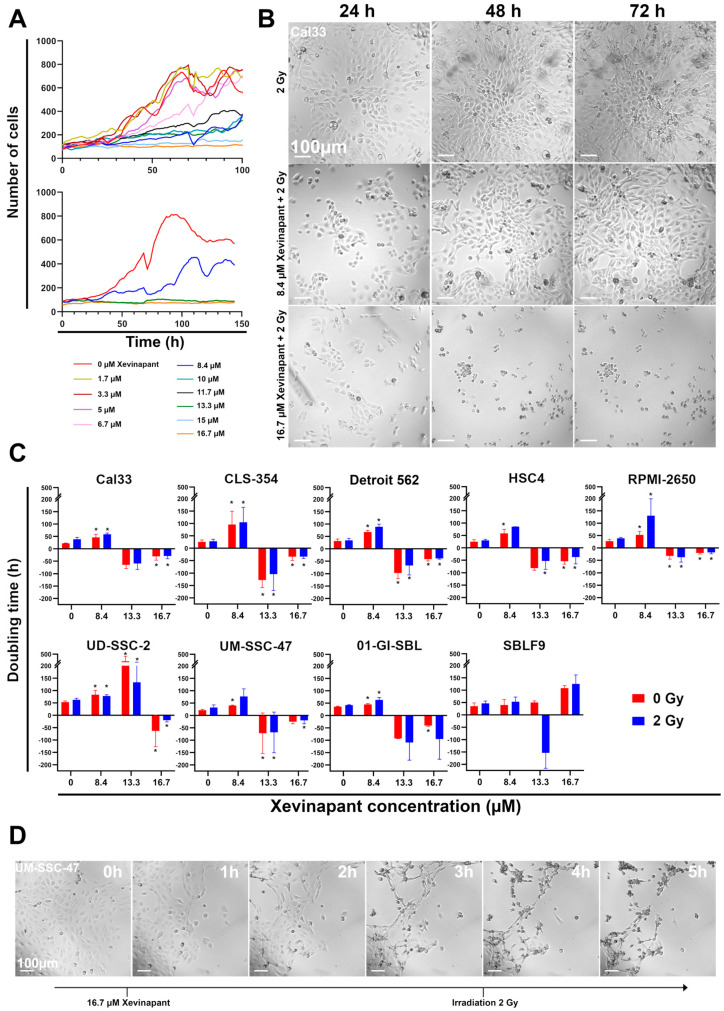
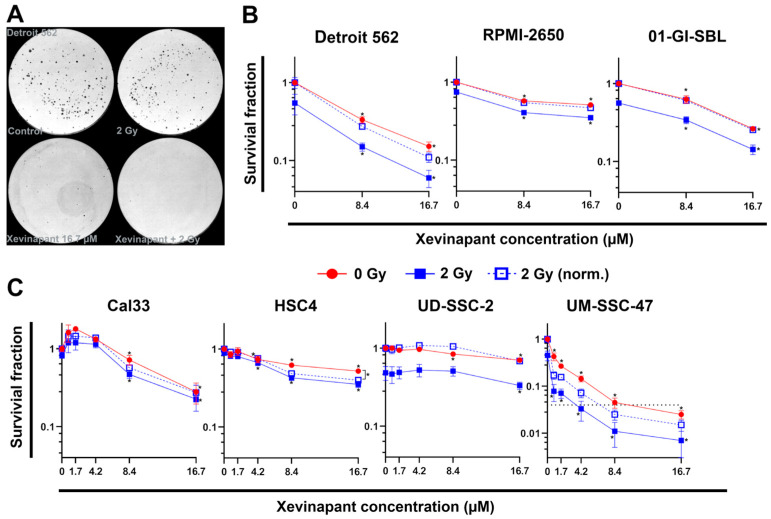
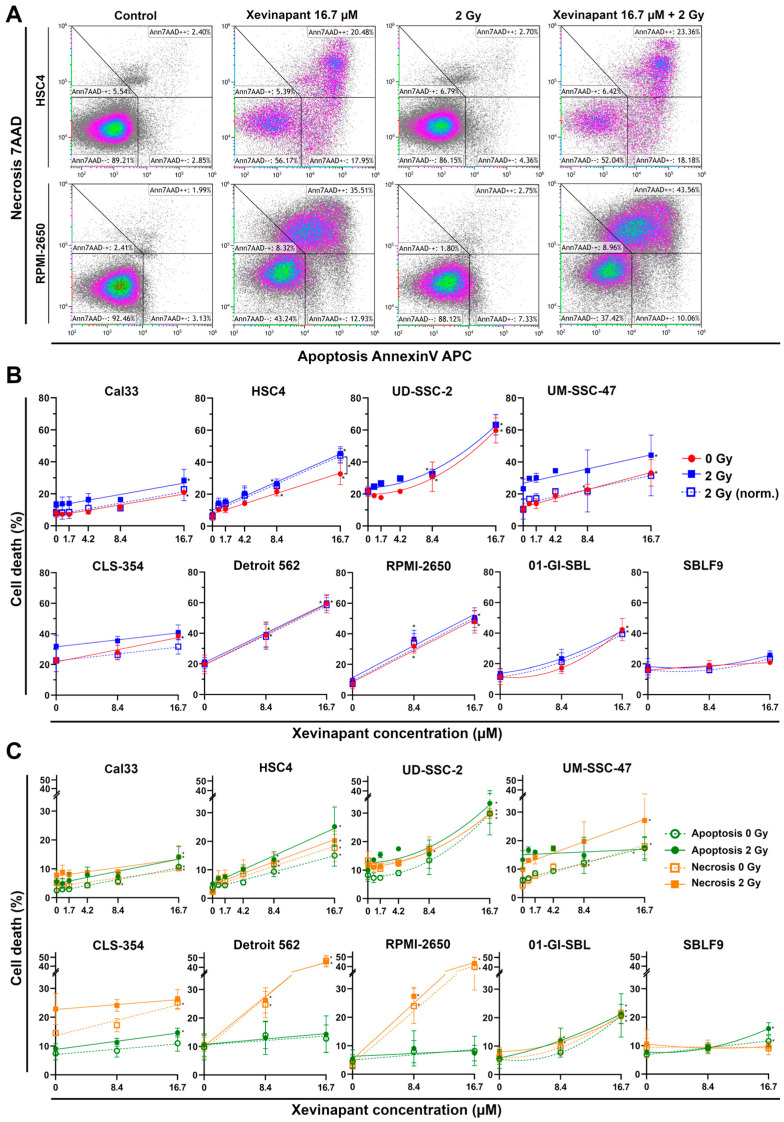
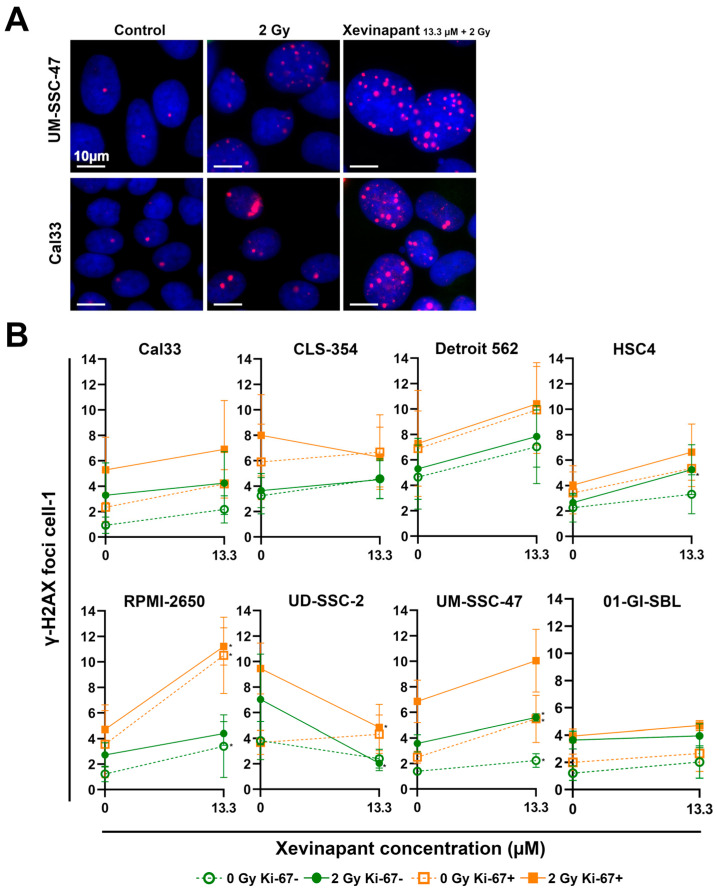
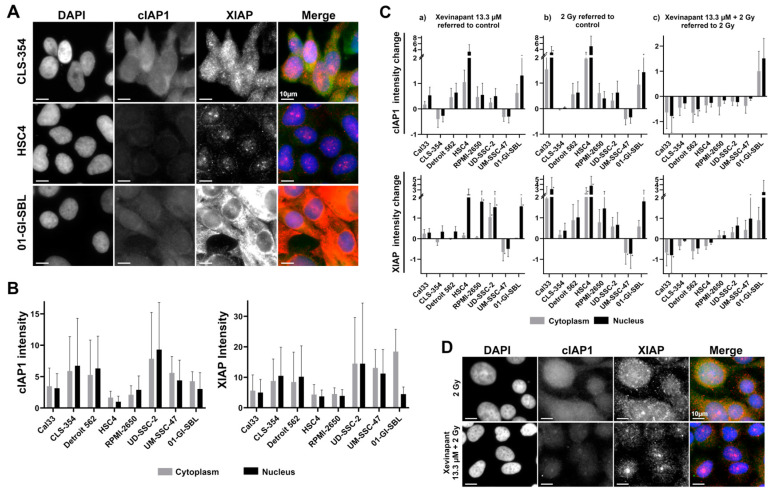
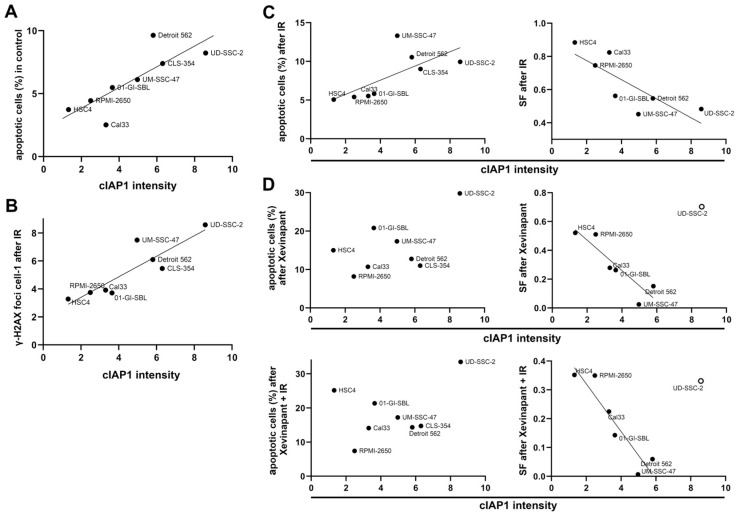
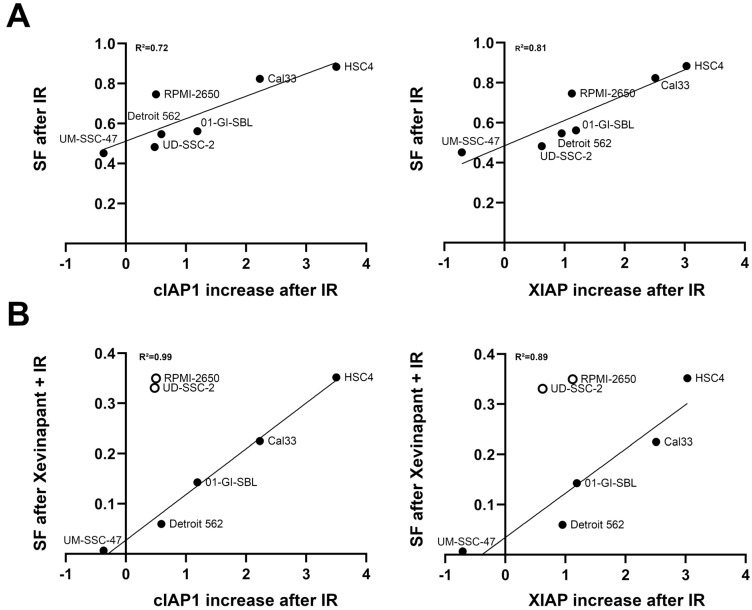
The poor prognosis of HNSCC is partly due to treatment resistance. The SMAC mimetic Xevinapant is a promising new approach to targeted cancer therapy. Xevinapant inhibits cIAP1/2 and XIAP, leading to apoptosis, necroptosis and inhibition of prosurvival signaling. Combining Xevinapant with IR could improve therapeutic potential. The effect of Xevinapant in combination with IR on HNSCC and healthy tissue cells was investigated. Cell growth, cell death, clonogenic survival and DNA double-strand breaks (DSBs) were studied, and intracellular cIAP1 and XIAP levels were evaluated. Xevinapant had cytostatic and cytotoxic, as well as radiosensitizing, effects on the malignant cells, while healthy tissue cells were less affected. Apoptotic and necrotic cell death was particularly affected, but the increase in residual DSBs and the reduced survival implied an additional effect of Xevinapant on DNA damage repair and other cell inactivation mechanisms. cIAP1 and XIAP levels varied for each cell line and were affected by Xevinapant and IR treatment. There was an association between higher IAP levels and increased cell death. Xevinapant appears to be a potent new drug for HNSCC therapy, especially in combination with IR. IAP levels could be an indicator for impaired DNA damage repair and increased susceptibility to cellular stress.

Keywords: XIAP; Xevinapant; apoptosis; cIAP1/2; head and neck squamous cell carcinoma; inhibitor; interactions; ionizing radiation; targeted therapy.


Conflict of interest statement

The authors declare no conflict of interest.

Figures

Figure 1
Figure 1
Xevinapant mode of action through blocking cIAP1/2 and XIAP: (A) In the intrinsic apoptotic pathway, cytochrome c is released from the mitochondria into the cytosol in response to apoptotic stimuli that cause intracellular stress or DNA damage. Cytochrome c molecules associate with Apaf-1 (apoptotic protease activating factor 1) to form the apoptosome. This leads to activation of caspase 9, followed by activation of caspases 3 and 7, resulting in apoptosis. XIAP inhibits apoptosis by blocking caspases 9, 3 and 7. Xevinapant inhibits XIAP, allowing the release of caspase activity and promotion of apoptotic signaling. (B) In the extrinsic pathway, death receptor ligands such as TNF-α stimulate apoptosis by binding to their membrane receptors. This leads to the assembly of TRADD (TNF receptor type 1-associated death domain protein), TRAF2/5 (TNF receptor associated factor) and protein kinase RIP1. In the presence of cIAP1/2, RIP1 is ubiquitylated, and activation of the apoptotic cascade is inhibited. When cIAP1/2 is blocked by Xevinapant, RIP1 is deubiquitylated and forms a complex with FADD (Fas-associated protein with death domain) and procaspase 8. This leads to activation of caspase 8, followed by caspases 3 and 7, and apoptosis takes place. Alternatively, in the absence of caspase 8, deubiquitylated RIP1 can form a complex with RIP3, called the necrosome. This promotes necrotic signaling and results in necroptosis, a programmed necrotic cell death. (C) cIAP1/2 blocks the noncanonical NF-κB pathway and enables canonical NF-κB signaling. Xevinapant inhibits cIAP1/2 downstream of the TNF-receptor, leading to activation of NIK and noncanonical NF-κB signaling. Proinflammatory cytokines such as TNF-α are released and the antitumor immune response of the tumor microenvironment is stimulated. In addition, Xevinapant inhibits the transcription of prosurvival genes by blocking the canonical NF-κB pathway (modified after [30,31,32,33,34,35,36,37,38,39,40,41,43,44,45,60,61,62] and created with BioRender.com, accessed on 28 April 2023).
Figure 2
Figure 2
Analysis of cell growth by live microscopy: (A) Growth curves of HNSCC Cal33 cells with different concentrations of SMAC mimetic Xevinapant. Xevinapant was applied at 24 h and removed at 72 h. (B) Representative images of Cal33 cells treated with IR (2 Gy) alone and in combination with Xevinapant (8.4 µM; 16.7 µM) 24, 48 and 72 h after beginning of monitoring. Addition of Xevinapant was at 24 h. (C) Doubling times of all cell lines under treatment with different concentrations (0; 8.4; 13.3; 16.7 µM) of Xevinapant alone (red) and in combination with 2 Gy IR (blue). Negative doubling time is the time for the number of cells to fall to half its current level. Each value represents mean ± SD (n ≥ 3). Significance of doubling time between the Xevinapant-treated groups and the untreated, nonirradiated group, and between the Xevinapant-treated groups with IR and the group with IR alone, was determined by Mann–Whitney U test * p ≤ 0.05. * means that the values were compared with those of the same group (0 Gy or 2 Gy) at 0 µM Xevinapant. (D) Representative images of HNSCC cell line UM-SSC-47 from 1 to 5 h after application of 16.7 µM Xevinapant.
Figure 3
Figure 3
Colony formation assay of six HNSCC cell lines and one healthy oral mucosa cell line: (A) Representative images of HNSCC Detroit 562 cells seeded in petri dishes. Untreated cells (control), cells treated with only IR (2 Gy), with only Xevinapant (16.7 µM) and with the combination of both are shown. (B) Semilogarithmic plots of mean survival fraction ± SD (n = 3) after treatment with 8.4 or 16.7 µM Xevinapant. Red line shows the unirradiated and blue line the irradiated fraction at 2 Gy IR dose. Dashed line represents mean survival fraction at 2 Gy, normalized to the unirradiated group. (C) Semilogarithmic plots of mean survival fraction ± SD (n = 3) after treatment with different concentrations (0; 0.8; 1.7; 4.2; 8.4; 16,7 µM) of Xevinapant alone (red) and in combination with 2 Gy IR (blue). Significance of the SF between Xevinapant-treated cells and untreated control and between Xevinapant-treated cells with IR and IR alone was determined by Mann–Whitney U test * p ≤ 0.05. * without parenthesis means that the values are compared with those of the same group (0 Gy or 2 Gy) at 0 µM.
Figure 4
Figure 4
Flow cytometric cell death analysis after monotherapy with Xevinapant or in combination with 2 Gy IR: (A) Exemplary gating strategy of AnnexinV/7AAD staining. Ann7AAD − − cells defined as “alive”, Ann7AAD + + as “necrotic” and Ann7AAD + − as “apoptotic”. Plots of HSC4 and RPMI-2650 cells untreated (control), treated with either Xevinapant (16.7 µM) or IR (2 Gy) alone and in combination. (B) All cells were treated with 8.4 µM and 16.7 µM Xevinapant alone (red) and in combination with 2 Gy IR (blue). A total of 4 cell lines were additionally treated with lower concentrations of Xevinapant (0.8; 1.7; 4.2 µM). Graphs were fitted using linear regression analysis. Dashed line represents cell death at 2 Gy, normalized to the unirradiated group. (C) Cell death separated into apoptosis (green) and necrosis (orange). Xevinapant doses are equal to (B). Dashed line represents cells treated with Xevinapant alone, and straight line represents cells treated with Xevinapant and IR (2 Gy) in combination. Each value represents mean ± SD (8.4, 16.7 µM, n = 3; 0.8, 1.7, 4.2 µM, n = 2). Significance of cell death between Xevinapant-treated cells and the untreated control and between Xevinapant-treated cells with IR and IR alone was determined by Mann–Whitney U test * p ≤ 0.05. * without parenthesis means that the values were compared with those of the same group (0 Gy or 2 Gy) at 0 µM.
Figure 5
Figure 5
Analysis of remaining DNA DSBs after 48 h using γH2AX immunostaining assay: (A) Representative images of γH2AX foci in HNSCC cells Cal33 and UM-SSC-47 in untreated cells (control) 48 h after treatment with IR (2 Gy) alone or after combined treatment with IR and Xevinapant (13.3 µM). γH2AX foci are red and localized in the blue nucleus. (B) Number of foci per cell in each cell line after treatment with Xevinapant (13.3 µM) alone (dashed line) and in combination with IR dose of 2 Gy (straight line). Green line represents foci in Ki-67 negative cells, and orange line represents foci in Ki-67 positive cells. The average of the foci of all cells (n > 400) counted was determined in each experiment. Each value in the graph represents the total mean ± SD of at least 3 independent experiments. Significance of DNA DSBs between Xevinapant-treated cells and the untreated control and between Xevinapant-treated cells with IR and IR alone was determined by Mann–Whitney U test * p ≤ 0.05. * means that the values were compared with those of the same group (0 Gy or 2 Gy) at 0 µM.
Figure 6
Figure 6
Analysis of Xevinapant target proteins cIAP1 and XIAP using immunostaining: (A) Representative images of untreated cells from three different cell lines (CLS-354, HSC4, 01-GI-SBL) stained with DAPI (blue), cIAP1 (green) and XIAP (red)—fluorescence microscopy image. (B) Background expression levels of cIAP1 and XIAP in untreated cells of seven HNSCC cell lines and one healthy cell line. Gray bar represents protein intensity in the cytoplasm, and black bar represents protein intensity in the nucleus of the cells. (C) Change in cIAP1 and XIAP expression levels in (a) cells treated with Xevinapant (13.3 µM) compared with untreated cells (negative control), (b) cells treated with IR (2 Gy) compared with untreated cells or (c) cells treated with a combination of Xevinapant (13.3 µM) and IR (2 Gy) compared with treatment with IR alone. In each experiment, the average protein intensity of all counted cells (n > 400) was determined. Each value in the graph represents the total mean ± SD of at least 3 independent experiments. Significance was determined by Mann–Whitney U test * p ≤ 0.05. (D) Representative images of Cal33 cells stained with DAPI (blue), cIAP1 (green) and XIAP (red)—fluorescence microscopy image. Top: cells after treatment with IR (2 Gy); bottom: cells treated with combination of IR (2 Gy) and Xevinapant (13.3 µM).
Figure 7
Figure 7
Association between cIAP1 levels and response to IR and Xevinapant therapy: (A) cIAP1 background levels in relation to apoptotic cells in seven HNSCC cell lines and one healthy cell line measured by AnnexinV flow cytometry. Line represents linear regression. (B) cIAP1 background levels associated with number of γH2AX foci per cell after 2 Gy IR. (C) cIAP1 background levels associated with apoptotic cells in flow cytometry and survival fraction (SF) in colony formation assay after IR. (D) cIAP1 background levels associated with apoptotic cells and SF after treatment with Xevinapant alone or combined with IR. The line represents linear regression. An open circle means that the cell line was excluded from the regression.
Figure 8
Figure 8
Association between upregulation of cIAP1 and XIAP levels and clonogenic survival: (A) Increase in cIAP1 and XIAP levels after IR plotted against the survival fraction (SF) after IR and (B) after the combination of IR and Xevinapant, measured by colony formation assay. Line represents linear regression analysis. An open circle means that the cell line was excluded from the regression.

Similar articles

Cited by

References

    1. Bose P., Brockton N.T., Dort J.C. Head and neck cancer: From anatomy to biology. Int. J. Cancer. 2013;133:2013–2023. doi: 10.1002/ijc.28112. - DOI - PubMed
    1. Sung H., Ferlay J., Siegel R.L., Laversanne M., Soerjomataram I., Jemal A., Bray F. Global Cancer Statistics 2020: GLOBOCAN Estimates of Incidence and Mortality Worldwide for 36 Cancers in 185 Countries. CA. Cancer J. Clin. 2021;71:209–249. doi: 10.3322/caac.21660. - DOI - PubMed
    1. Hashibe M., Brennan P., Benhamou S., Castellsague X., Chen C., Curado M.P., Dal Maso L., Daudt A.W., Fabianova E., Fernandez L., et al. Alcohol drinking in never users of tobacco, cigarette smoking in never drinkers, and the risk of head and neck cancer: Pooled analysis in the International Head and Neck Cancer Epidemiology Consortium. J. Natl. Cancer Inst. 2007;99:777–789. doi: 10.1093/jnci/djk179. - DOI - PubMed
    1. Blot W.J., McLaughlin J.K., Winn D.M., Austin D.F., Greenberg R.S., Preston-Martin S., Bernstein L., Schoenberg J.B., Stemhagen A., Fraumeni J.F., Jr. Smoking and drinking in relation to oral and pharyngeal cancer. Cancer Res. 1988;48:3282–3287. - PubMed
    1. Ghiani L., Chiocca S. High Risk-Human Papillomavirus in HNSCC: Present and Future Challenges for Epigenetic Therapies. Int. J. Mol. Sci. 2022;23:3483. doi: 10.3390/ijms23073483. - DOI - PMC - PubMed

Publication types

MeSH terms

Substances