. 2023 May 31;10(6):983.
doi: 10.3390/children10060983.

Differences in Anthropometric Parameters of Children in Six European Countries

Affiliations

Differences in Anthropometric Parameters of Children in Six European Countries

Csilla Semánová et al. Children (Basel). .

Abstract

Background: The databases of children's anthropometric parameters are often outdated, rarely representative and are not always available at an international level.

Objectives: To present children's anthropometric parameters in six European countries that contributed to the Feel4Diabetes project and find country-specific differences.

Design/setting: The Feel4Diabetes study was performed between 2016 and 2018, targeting children in Belgium, Bulgaria, Finland, Greece, Hungary and Spain. The current study presents data from the baseline and the yearly follow-up anthropometric measurements.

Subjects: In total, 20,832 measurements of children (48.7% boys) between 6 and 10 years of age were conducted.

Main outcome measure: weight, height, BMI.

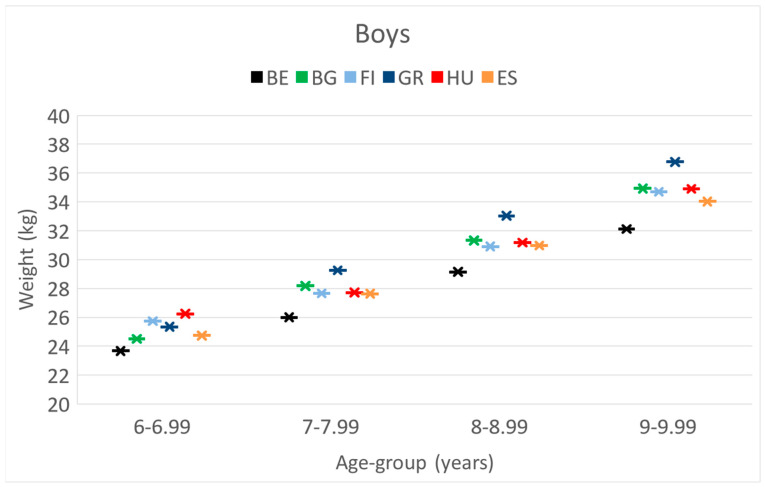
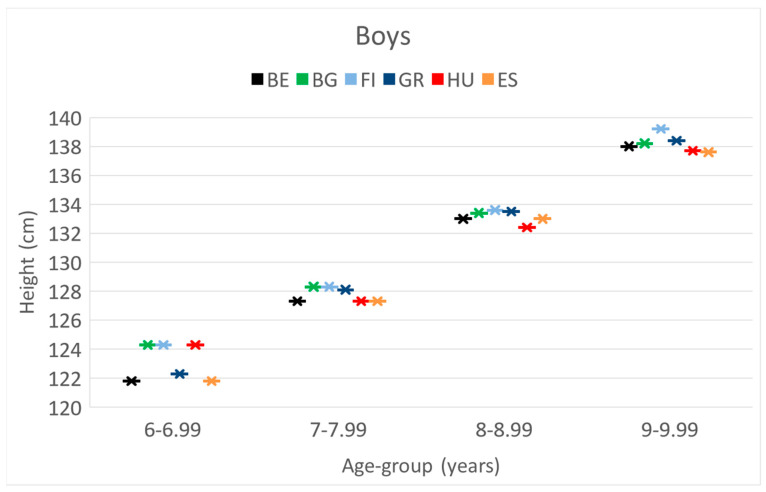
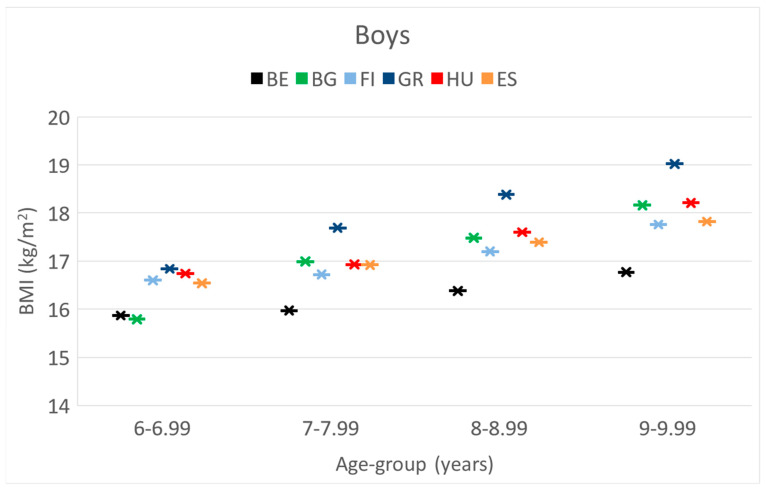
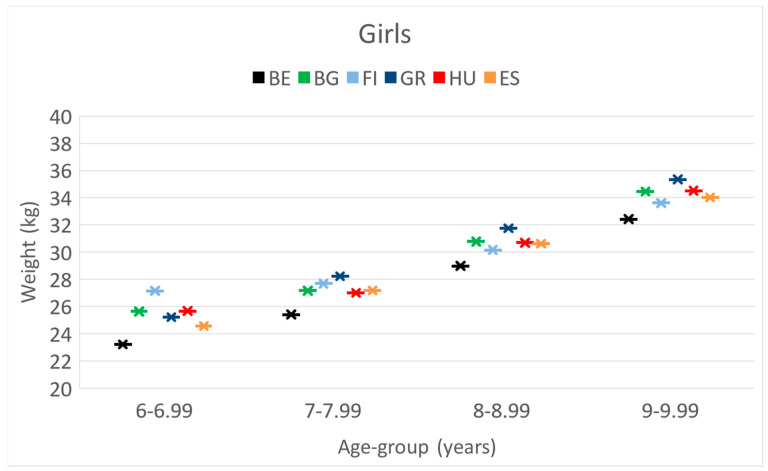
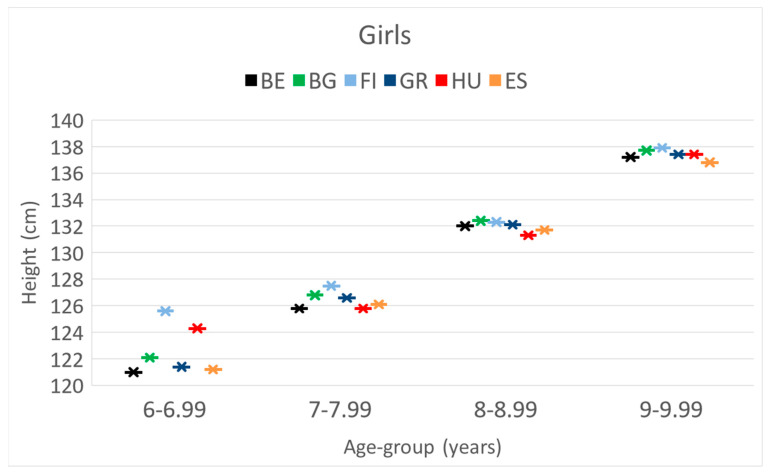
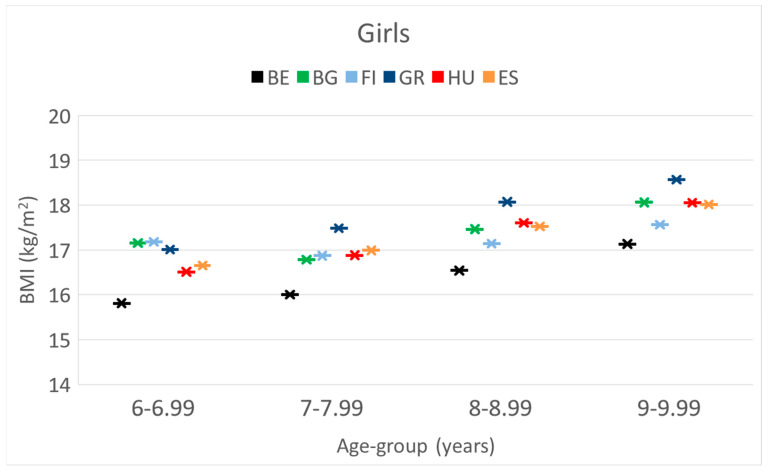
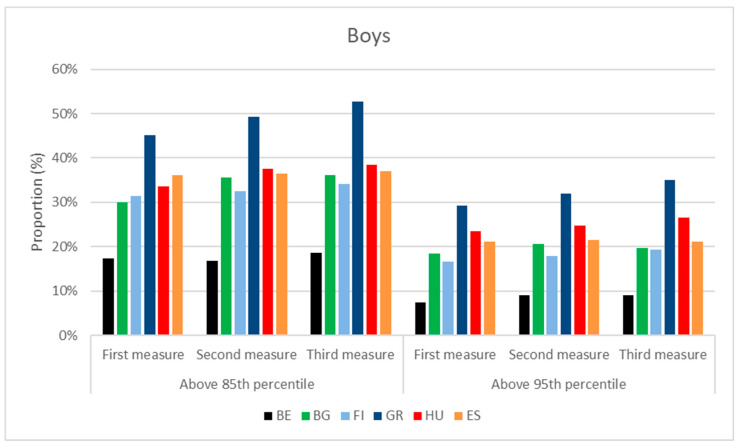
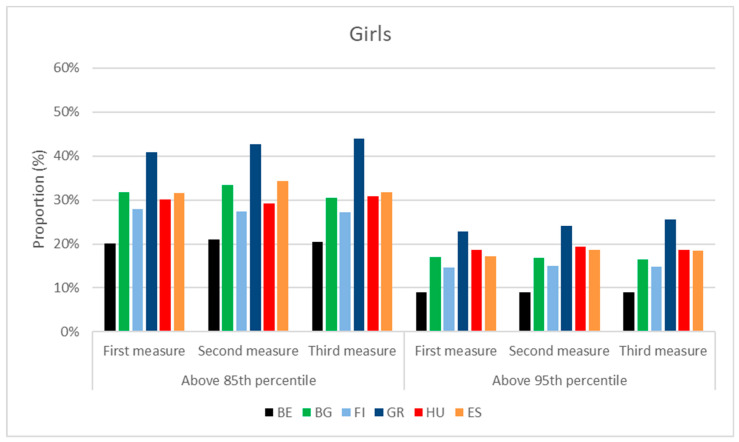
Results: Belgian boys had the lowest body weight and height, while Greek boys had the highest body weight, and Finnish had the highest body height. The highest proportion of overweight (percentile above 85%) and obese boys (percentile above 95%) was in Greece, followed by Hungarian, Spanish, Bulgarian and Finnish boys. In contrast, Belgian boys had the lowest ratio in both categories. Among girls, Greece had the highest; Belgium had the lowest body weight; Finland was the highest in all age categories. The ratio in the overweight range was the highest in Greece, followed by Spanish, Bulgarian and Hungarian girls, who were second in the obese category. Finnish girls had lower and Belgian girls had the lowest ratio in both BMI categories. All the detailed data are presented in tables, and the trends are figures.

Conclusions: Our study presents fresh and comparable anthropometric data of children between 6 and 10 years of age in six European countries, supporting the need for appropriate obesity prevention.

Keywords: BMI of children; Belgium; Bulgaria; Feel4Diabetes; Finland; Greece; Hungary; Spain; body height; body weight; child growth.


Conflict of interest statement

The authors declare no conflict of interest.

Figures

Figure 1
Figure 1
The increase in the mean values of weight [kg] and boys by their age [years] in the 6 countries. (BE = Belgium; BG = Bulgaria; FI = Finland; GR = Greece; HU = Hungary; ES = Spain).
Figure 2
Figure 2
The increase in the mean values of the height [cm] of boys by their age [years] in the 6 countries. (BE = Belgium; BG = Bulgaria; FI = Finland; GR = Greece; HU = Hungary; ES = Spain).
Figure 3
Figure 3
The increase in the mean values of BMI [kg/m2] of boys by their age [years] in the 6 countries. (BE = Belgium; BG = Bulgaria; FI = Finland; GR = Greece; HU = Hungary; ES = Spain).
Figure 4
Figure 4
The increase in the mean weight [kg] of girls by their age [years] in the 6 countries. (BE = Belgium; BG = Bulgaria; FI = Finland; GR = Greece; HU = Hungary; ES = Spain).
Figure 5
Figure 5
The increase in the mean height [cm] of girls by their age [years] in the 6 countries. (BE = Belgium; BG = Bulgaria; FI = Finland; GR = Greece; HU = Hungary; ES = Spain).
Figure 6
Figure 6
The changes in the mean BMI [kg/m2] by age [years] of girls in the 6 countries. (BE = Belgium; BG = Bulgaria; FI = Finland; GR = Greece; HU = Hungary; ES= Spain).
Figure 7
Figure 7
BMI distribution of boys at the time of 3 consecutive anthropometric measurements, performed during the project. (BE = Belgium; BG = Bulgaria; FI = Finland; GR = Greece; HU = Hungary; ES = Spain).
Figure 8
Figure 8
BMI distribution of girls at the time of 3 consecutive anthropometric measurements, performed during the project. (BE = Belgium; BG = Bulgaria; FI = Finland; GR = Greece; HU = Hungary; ES = Spain).

References

    1. Bleich S.N., Segal J., Wilson R., Wang J. Systematic Review of Community-Based Childhood Obesity Prevention Studies. Pediatrics. 2013;132:e201–e210. doi: 10.1542/peds.2013-0886. - DOI - PMC - PubMed
    1. Pandita A., Sharma D., Pandita D., Pawar S., Tariq M., Kaul A. Childhood obesity: Prevention is better than cure. Diabetes Metab. Syndr. Obes. Targets Ther. 2016;9:83–89. doi: 10.2147/DMSO.S90783. - DOI - PMC - PubMed
    1. Koletzko B., Fishbein M., Lee W.S., Moreno L., Mouane N., Mouzaki M., Verduci E. Prevention of Childhood Obesity: A Position Paper of the Global Federation of International Societies of Paediatric Gastroenterology, Hepatology and Nutrition (FISPGHAN) JPGN. 2020;70:702–710. doi: 10.1097/MPG.0000000000002708. - DOI - PubMed
    1. Antwi F., Fazylova N., Garcon M.C., Lopez L., Rubiano R., Slyer J.T. The effectiveness of web-based programs on the reduction of childhood obesity in school-aged children: A systematic review. JBI Libr. Syst. Rev. 2012;10((Suppl. S42)):1–14. doi: 10.11124/jbisrir-2012-248. - DOI - PubMed
    1. Weihrauch-Blüher S., Kromeyer-Hauschild K., Graf C., Widhalm K., Korsten-Reckf U., Jödickeg B., Markerta J., Müller M.J., Moss A., Wabitschj M., et al. Current Guidelines for Obesity Prevention in Childhood and Adolescence. Obes. Facts. 2018;11:263–276. doi: 10.1159/000486512. - DOI - PMC - PubMed

LinkOut - more resources