Review
. 2023 May 31;13(6):926.
doi: 10.3390/biom13060926.

Leaflet Tensions Control the Spatio-Temporal Remodeling of Lipid Bilayers and Nanovesicles

Affiliations
Review

Leaflet Tensions Control the Spatio-Temporal Remodeling of Lipid Bilayers and Nanovesicles

Reinhard Lipowsky et al. Biomolecules. .

Abstract

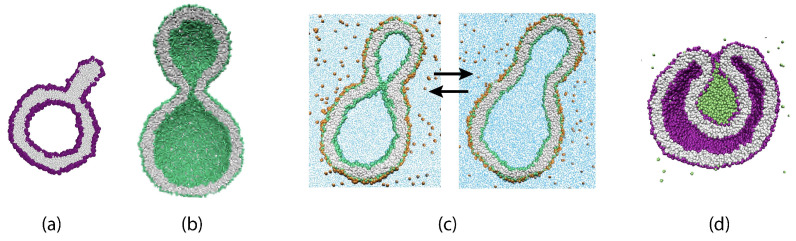
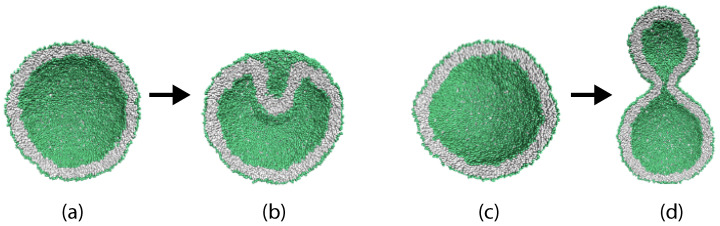
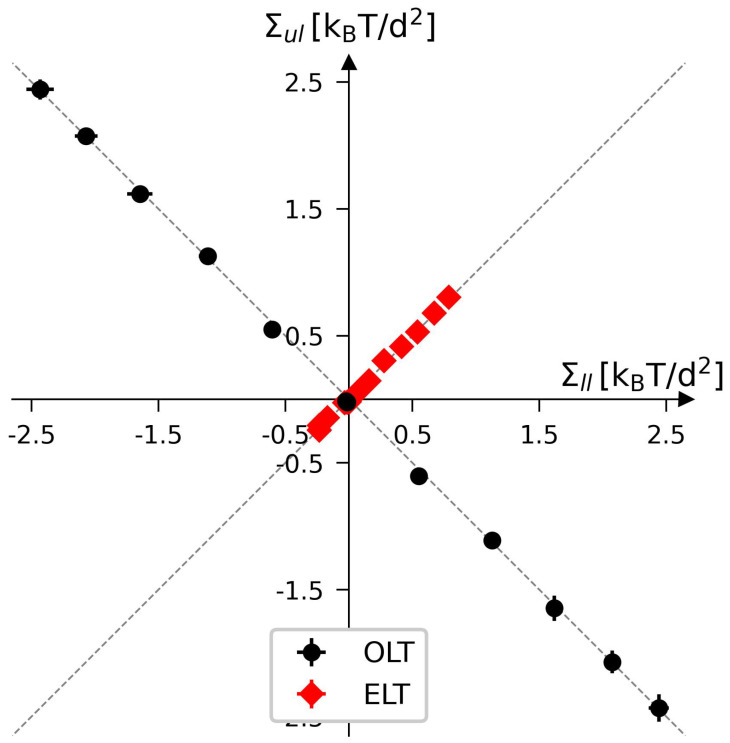
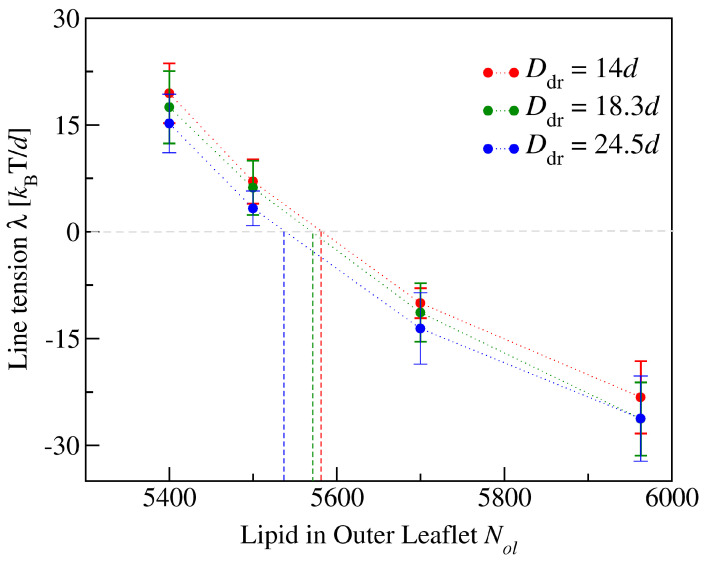
Biological and biomimetic membranes are based on lipid bilayers, which consist of two monolayers or leaflets. To avoid bilayer edges, which form when the hydrophobic core of such a bilayer is exposed to the surrounding aqueous solution, a single bilayer closes up into a unilamellar vesicle, thereby separating an interior from an exterior aqueous compartment. Synthetic nanovesicles with a size below 100 nanometers, traditionally called small unilamellar vesicles, have emerged as potent platforms for the delivery of drugs and vaccines. Cellular nanovesicles of a similar size are released from almost every type of living cell. The nanovesicle morphology has been studied by electron microscopy methods but these methods are limited to a single snapshot of each vesicle. Here, we review recent results of molecular dynamics simulations, by which one can monitor and elucidate the spatio-temporal remodeling of individual bilayers and nanovesicles. We emphasize the new concept of leaflet tensions, which control the bilayers' stability and instability, the transition rates of lipid flip-flops between the two leaflets, the shape transformations of nanovesicles, the engulfment and endocytosis of condensate droplets and rigid nanoparticles, as well as nanovesicle adhesion and fusion. To actually compute the leaflet tensions, one has to determine the bilayer's midsurface, which represents the average position of the interface between the two leaflets. Two particularly useful methods to determine this midsurface are based on the density profile of the hydrophobic lipid chains and on the molecular volumes.

Keywords: bilayer tension; biomembranes; endocytosis; engulfment; leaflet tensions; molecular dynamics; simulations; synthetic biosystems.


Conflict of interest statement

The authors declare no conflict of interest.

Figures

Figure 1
Figure 1
Simulation snapshots of nanovesicles that illustrate their remodeling for different leaflet tensions: (a) Cross-sectional view of a nanovesicle that undergoes a structural instability, generating a micellar protrusion [30]; (b) Half cut view of a vesicle that forms a dumbbell shape with a closed membrane neck [28]; (c) Cross-sectional views of recurrent shape changes between dumbbells with open and closed necks [29]; (d) Half cut view of a condensate droplet (green) that is completely engulfed by the in-bud of a nanovesicle and will divide into two daughter vesicles [31]. All vesicle bilayers in (bd) have the same surface area, which is about 3.6 times larger than the area of the vesicle bilayer in (a).
Figure 2
Figure 2
Coarse-grained molecular architecture of a phospholipid with three hydrophilic headgroup beads (red) and two hydrophobic chains, each of which contains six chain beads (yellow). All beads have the same diameter, d, which also provides the range of the interactions between the beads. The tensionless bilayer has a thickness of about 5d which implies that the diameter d is about 0.8 nm in physical units [25].
Figure 3
Figure 3
(a) Oblique view onto a planar lipid bilayer consisting of 841 lipid molecules in each leaflet; and (b) Half cut view of a nanovesicle with Nol=1685 lipids in its outer and Nil=840 lipids in its inner leaflet. In order to highlight the interface between the two leaflets, the lipids in the upper and inner leaflet are drawn with red headgroups and yellow chains whereas the lipids in the lower and outer leaflet have green headgroups and blue chains, even though all lipids are identical. For the bilayers displayed in (a,b), both leaflets are tensionless which implies that each lipid attains its optimal area and its optimal volume. The lipid bilayers are immersed in plenty of water but the water molecules are not displayed for visual clarity [32].
Figure 4
Figure 4
Emergence of membrane curvature in molecular dynamics simulations of a symmetric and tensionless bilayer. The lipid bilayer has a thickness of about 4 nm, the smallest curvature radius of its midsurface (red) is about 6 nm. For comparison, two circles (broken lines) with a radius of 6 nm are also displayed. The red line indicates the position of the fluctuating leaflet-leaflet interface [36].
Figure 5
Figure 5
Three symmetric planar bilayers which contain the same number of lipids, Nll=Nul=841 in their lower and upper leaflets. The three bilayers differ in the base area of simulation box which provides another control parameter for the leaflet tensions, Σll and Σul, acting in the two leaflets. (a) Compressed bilayer with negative leaflet tensions, Σll=Σul<0, and (projected) area per lipid, a=1.18d2; (b) Reference state of planar bilayer with tensionless leaflets, Σll=Σul=0, and optimal area per lipid, a=a0=1.22d2; and (c) Stretched bilayer with positive leaflet tensions Σll=Σul>0 and increased area per lipid a=1.29d2 [32].
Figure 6
Figure 6
Shape transformations of spherical nanovesicles induced by volume reduction: (a,b) Transformation of a spherical vesicle with Nil=4400 lipids in the inner and Nol=5700 lipids in the outer leaflet. For the slightly deflated vesicle with vanishing bilayer tension, the inner leaflet is compressed and the outer leaflet is stretched which implies that the bilayer prefers to bulge towards the inner leaflet; and (c,d) Transformation of a spherical vesicle with Nil=3800 lipids in the inner and Nol=6300 lipids in the outer leaflet. For the slightly deflated vesicle with vanishing bilayer tension, the inner leaflet is stretched and the outer leaflet is compressed which implies that the bilayer prefers to bulge towards the outer leaflet [28].
Figure 7
Figure 7
Density and stress profiles across lipid bilayers as functions of the coordinate z perpendicular to the bilayers. All bilayers are tensionless, i.e., the bilayer tension Σ as given by the integral over z, see Equation (2), is close to zero. The bilayers contain Nll lipids in their lower leaflet and Nul lipids in their upper leaflet: (ac) Density profiles of the water (W), headgroup (H), and hydrophobic chain (C) beads; and (df) Stress profiles across the same bilayers as in the upper row. The bilayer in (a,d) is symmetric with Nll=Nul=841 lipids in each leaflet. The bilayer in (b,e) is asymmetric with Nll=815 and Nul=862. The bilayer in (c,f) has a larger transbilayer asymmetry with Nll=801 and Nul=875. The blue, red, and black lines correspond to different heights of the simulation box, as given by 32d, 40d, and 48d. Comparison of these three lines implies that finite-size effects arising from the box height can be ignored [24].
Figure 8
Figure 8
Three-dimensional Voronoi tessellation of a planar bilayer and a single lipid molecule: (a) Simulation snapshot of planar bilayer with tensionless leaflets and Nll=Nul=841. The lipids in the lower leaflet have green headgroups and blue hydrocarbon chains; those in the upper leaflet have red headgroups and yellow hydrocarbon chains; (b) Typical conformation of a single lipid molecule within the upper leaflet in ball-and-stick representation; (c) Voronoi cells assigned to each bead of the bilayer in panel a; and (d) Voronoi cells assigned to each bead of the lipid molecule in panel (b). Voronoi cells are also assigned to each water bead but these cells are not shown here for visual clarity [32].
Figure 9
Figure 9
Leaflet tension space for planar bilayers that contain a total number of Nll+Nul=1682 lipids. The two coordinates are the leaflet tensions Σll and Σul in the lower and upper leaflets. Negative and positive leaflet tensions describe compressed and stretched leaflets. The reference state with tensionless leaflets, corresponding to Σll=Σul=0, is obtained for the symmetric bilayer with Nll=Nul=841 lipids. The red data points describe elastic deformations with equal leaflet tensions (ELT), Σll=Σul. The black data represent bilayers with opposite leaflet tensions (OLT), Σll=Σul. All OLT states can be obtained from the reference state by reshuffling lipids from one leaflet to the other and adjusting the base area of the simulation box to obtain tensionless bilayers. The midplanes of the asymmetric OLT states were calculated using the CHAIN protocol [32].
Figure 10
Figure 10
Tensionless bilayers assembled from two lipid components, small-head (SH) lipids and large-head (LH) lipids: (a,b) Molecular architecture of small-head (SH) and large-head (LH) lipids. In both cases, the two hydrocarbon chains are modeled by 2×6 chain (C) beads (green or gray). The headgroup of the SH lipid consists of three H beads (red) whereas the headgroup of the LH lipid has six H beads (blue); and (c) Upper leaflet tension Σ1Σul<0 (black circles) and lower leaflet tension Σ2Σll=Σul>0 (red squares) as a function of the mole fraction ϕϕulLH of the LH lipids in the upper leaflet for a lower leaflet that contains only SH lipids. The two-component bilayer was assembled from NulSH+NulLH=NllSH+NllLH=841 lipids. The bilayer tension Σ=Σul+Σil (green stars) is close to zero, demonstrating that the bilayers attain OLT states. The midplanes of the bilayers were determined by the CHAIN protocol.
Figure 11
Figure 11
Fluctuation spectra of bending undulations for planar and symmetric bilayers with two lipid components as functions of wavenumber q. The two leaflets contain the same lipid number, Nul=Nll=841, and the same mole fraction ϕle of the large-head (LH) lipids. The different panels correspond to different mole fractions. The box size is adjusted in such a way that each bilayer is tensionless and has (almost) zero bilayer tension Σ=Σul+Σll=0. It then follows from the symmetry between the two leaflets that both leaflet tensions vanish, Σul=Σll=0. For all mole fractions, the low-q part of the spectrum behaves as S(q)kBT/(κq4) as in Equation (17) with composition-dependent κ-values. The bending rigidities κ, as obtained from the spectra, the area compressibility modulus KA, and the membrane thickness me, as determined by independent analysis, are found to satisfy the relationship in Equation (16) with the prefactor 1/48 for all lipid compositions [25].
Figure 12
Figure 12
Relaxation of leaflet tensions in a lipid bilayer which is composed of two phospholipids and cholesterol (orange): The top row shows a bilayer membrane with two lipid components (blue and red) that do not undergo flip-flops from one leaflet to the other. The bilayer is tensionless in the sense that the bilayer tension Σ=Σll+Σul is (close to) zero. However, the upper leaflet of the bilayer is compressed by a negative leaflet tension Σul<0 whereas the lower leaflet is stretched by a positive leaflet tension Σll>0, as indicated by the schematic springs on the left and on the right of the bilayer. As a third component, cholesterol (orange) is added to both leaflets so that they initially contain the same number of cholesterol molecules, as depicted in the middle row. After the cholesterol has been redistributed by flip-flops, both leaflets have attained a tensionless state as indicated by the relaxed springs. The cartoon at the bottom also indicates that the two tensionless leaflets typically differ in the preferred areas that they would assume in a symmetric bilayer [27].
Figure 13
Figure 13
Simulation data for an asymmetric bilayer with 66 POPCs and 24 GM1s in the upper leaflet, 87 POPCs in the lower leaflet, as well as 20 cholesterols that undergo frequent flip-flops between the two leaflets: (a) Different distributions for the number of cholesterol molecules in the two bilayer leaflets, with an average number of 9 cholesterols in the upper leaflet (striped blue) and of 11 cholesterol in the lower leaflet (black). The inset shows a sketch of the Martini cholesterol model [44]; and (b) Time-dependent relaxation (black solid line) of the stress asymmetry ΔΣ=ΣulΣll towards the state with tensionless leaflets and ΔΣ=0. After the first 500 ps, the relaxation curve is well fitted by a single exponential with a time constant of 55 ns. The inset displays the non-exponential behavior observed during the first 2.5 ns [27].
Figure 14
Figure 14
Asymmetric bilayers composed of POPC in the lower leaflet and a mixture of POPC and GM1 in the upper leaflet. The upper leaflet contains a fixed number of 100 lipid molecules while the lower leaflet contains a varible number of POPCs: (a) Torque density 2κm, corresponding to the negative first moment of the stress profile s(z) as in Equation (11), versus GM1 mole fraction in the upper leaflet. All bilayers have vanishing bilayer tension; and (b) Stress profile s(z) for a bilayer with 17 GM1 molecules and thus 17 mol% of GM1 in the upper leaflet and 98 POPCs in the lower leaflet, corresponding to the red encircled data point in (a). Even though the stress profile in (b) is clearly asymmetric, as follows by comparison of the two headgroup layers around z=±2.5 nm, the two leaflet tensions Σll and Σul, which are obtained by integrating s(z) over negative and positive values of z as in Equation (3), are both close to zero [27].
Figure 15
Figure 15
Upper leaflet tension Σul (blue) and lower leaflet tension Σll (red) versus lipid number Nul for constant total lipid number Nul+Nll=1682. The lipid number Nul is reduced by moving lipids from the upper to the lower leaflet, thereby increasing the upper leaflet tension and decreasing the lower one. Both leaflet tensions vanish for Nul=841 (vertical dashed line) which defines the relaxed reference state of the planar bilayers. The green data display the bilayer tension Σ=Σul+Σll, which is close to zero, demonstrating that all bilayer states are OLT states. For 945Nul737, the bilayer remains stable and the lipids do not undergo flip-flops from one leaflet to the other during the first 12.5 μs of the simulations. The midplanes of the OLT states were obtained via the CHAIN protocol [30].
Figure 16
Figure 16
Cumulative distribution function Pcdf versus time t, for a planar bilayer with Nul lipids in the upper leaflet and Nll=1682Nul lipids in the lower leaflet. Three sets of data for Nul=986 (black circles), Nul=1015 (red squares), and Nul=1073 (blue diamonds). These data sets are well fitted, using least squares, by an exponential distribution (broken lines) as in Equation (18), which involves only a single fit parameter, the flip-flop rate ωpl. Each data set represents the outcome of more than 120 statistically independent simulations. Inset: Monotonic increase of the flip-flop rate ωpl with the absolute value |ΔΣ|=|ΣulΣll| of the stress asymmetry between the two leaflets [30].
Figure 17
Figure 17
Structural instability and self-healing of a tensionless planar bilayer. At time t=0, the bilayer is initially assembled from Nul=986 red-green lipids in the compressed upper leaflet and from Nll=696 purple-blue lipids in the stretched lower leaflet: (a) At t=200 ns, the metastable bilayer bulges towards the upper leaflet; (b) At t=1000 ns, a globular micelle has been formed from about 100 red-green lipids that were expelled from the upper leaflet; (c) At t=1120 ns, red-green lipids move towards the stretched lower leaflet along the contact line between micelle and bilayer; and (d) This lipid exchange leads to a self-healing process of the bilayer that is completed at t=1700 ns. At this time point, 93 red-green lipids have moved from the upper to the lower leaflet. The restored bilayer remains stable without flip-flops until the end of the simulations at t=12.5μs [30].
Figure 18
Figure 18
Leaflet tensions Σil and Σol of the inner and outer leaflets for nanovesicles enclosed by bilayers with constant Nil+Nol=10,100. The lipid number Nol is increased by reshuffling lipids from the inner to the outer leaflet: (a) Spherical vesicles with rescaled volume ν=1 in (a) and with ν=ν0<1, corresponding to tensionless bilayers, in (b). The reference state with tensionless leaflets is estimated by linear intrapolation, which leads to Nol=Nol=5963 in (a) and to Nol=Nol=5993 in (b). In (b), all vesicle bilayers attain OLT states, for which the midsurface was calculated using the CHAIN protocol [28].
Figure 19
Figure 19
Shape transformations of a spherical vesicle which contains Nol=6300 lipids in its outer and Nil=3800 lipids in its inner leaflet, induced by the reduction of the vesicle volume from ν=1 to ν=0.7, mimicking the experimental procedure of osmotic deflation. In the second panel with ν0=0.978, the vesicle has a tensionless bilayer, for which the outer leaflet is compressed with Σol=0.99kBT/d2 and the inner leaflet is stretched with Σil=+0.99kBT/d2. For rescaled volume ν0.9, the nanovesicle exhibits an out-bud with a closed membrane neck [28].
Figure 20
Figure 20
Shape transformations of a spherical nanovesicle with Nol=5700 and Nil=4400, induced by the reduction of vesicle volume from ν=1 to ν=0.7. The second panel with ν=ν0=0.966 represents a tensionless bilayer: the outer leaflet is stretched with Σol=+0.87kBT/d2 whereas the inner leaflet is compressed with Σil=0.82kBT/d2. For volume ν=0.7, the vesicle exhibits an in-bud with an open neck [28].
Figure 21
Figure 21
Shape transformations of a spherical vesicle with Nol=5963 and Nil=4137 as driven by the reduction of its volume from ν=1 to ν=0.5. The second panel with ν0=0.966 displays the reference state of the bilayer, for which both leaflet tensions are close to zero. More precisely, for ν=ν0, the outer leaflet is slightly stretched by the positive leaflet tension Σol=+0.03kBT/d2 and the inner leaflet is slightly compressed by the negative leaflet tension Σil=0.02kBT/d2. As the volume is further reduced. the vesicle attains a prolate shape for vs. = 0.8 and vs. = 0.7, an oblate or discocyte shape for vs. = 0.6, and a stomatocyte shape for vs. = 0.5 [28].
Figure 22
Figure 22
Time-dependent shape evolution of a nanovesicle with Nol=5500 and Nil=4600 lipids. The vesicle has a spherical shape with volume ν=1 until time t=0μs, when the vesicle volume is reduced to ν=0.8. After this volume reduction, the vesicle develops an in-bud with a membrane neck that is closed at t=5μs. The neck is cleaved at about t=15μs, thereby generating an interluminal daughter vesicle that adheres to the larger daughter vesicle. The two vesicles remain in this adhering state at least until t=40μs. [Simulations by Rikhia Ghosh].
Figure 23
Figure 23
Leaflet tension space for the closed bilayers of nanovesicles with a total number of Nil+Nol=2525 lipids in both leaflets. The two coordinates are the leaflet tensions Σil and Σol in the inner and outer leaflets. Negative and positive leaflet tensions describe compressed and stretched leaflets. The reference state with tensionless leaflets, corresponding to Σil=Σol=0, is obtained for a vesicle bilayer with Nil=840 lipids in the inner leaflet and Nol=1685 lipids in the outer one. The black data represent elastic OLT deformations obtained from the reference state by reshuffling lipids from one leaflet to the other and adjusting the vesicle volume to obtain tensionless bilayers with Σ=Σil+Σol=0. The green data represent the elastic deformations arising from changes in vesicle volume, corresponding to vesicle inflation or deflation (VID). For all data shown here, the midsurface of the vesicle bilayer was determined by the VORON protocol [32].
Figure 24
Figure 24
Outer leaflet tension Σol (blue) and inner leaflet tension Σil (red) versus lipid number Nol for constant Nol+Nil=2875. The lipid number Nol is reduced by moving lipids from the outer to the inner leaflet, thereby increasing the outer leaflet tension and decreasing the inner one. Both leaflet tensions vanish for Nol=1921 (vertical dashed line) and Nil=954, which defines the relaxed reference state of the nanovesicles. The green data correspond to the bilayer tension Σ=Σol+Σil, which is close to zero, demonstrating that all bilayer states are OLT states. During the run time of 12.5μs, we observed no flip-flops within the stability regime (white), corresponding to 2095Nol1775. The left vertical line at Nol=2105 represents the instability line at which the lipids start to undergo flip-flops from the compressed outer to the stretched inner leaflet. The right vertical line at Nol=1755 represents the instability line at which the lipids start to undergo flip-flops from the compressed inner to the stretched outer leaflet. The vesicles have a diameter of 23.8d. The midsurface of the OLT states was obtained via the CHAIN protocol [30].
Figure 25
Figure 25
Cumulative distribution function Pcdf versus time t for flip-flops in tensionless bilayers of nanovesicles, assembled from Nol+Nil=2875 lipids. Three sets of data are displayed with Nol=2105 (black circles), Nol=2125 (red squares), and Nol=2150 (blue diamonds) lipids in the outer leaflet, which belong to the left instability regime in Figure 24. The three sets of data are well fitted, using least squares, to Weibull distributions (broken lines) as in Equation (27), which depend on two parameters, the shape parameter k and the rate parameter ωve. Each data set represents the outcome of at least 70 statistically independent simulations. Inset: Monotonic increase of the rate parameter ωve with the absolute value |ΔΣve| of the stress asymmetry as defined by Equation (25) [30].
Figure 26
Figure 26
Structural instability and self-healing process of vesicle bilayer. At time t=0, the bilayer is assembled from Nol=2105 and Nil=770 lipids and the vesicle volume is adjusted in such a way that the bilayer tension is close to zero, which leads to a compressed outer leaflet with negative leaflet tension Σol=1.97kBT/d2: (a) At t=780ns, the compressed outer leaflet exhibits some kinks; (b) At t=1720ns, a cylindrical micelle has been formed from about 180 red-green lipids that were expelled from the outer leaflet; (c) At t=2160ns, lipids move towards the stretched inner leaflet along the contact line between micelle and bilayer; and (d) At t=2710ns, the self-healing process via stress-induced lipid exchange has been completed and 111 red-green lipids have moved to the inner leaflet. The restored bilayer undergoes no further flip-flops until the end of the simulations.
Figure 27
Figure 27
Phase diagram for a binary mixture of water and solute molecules as a function of solute mole fraction ΦS and solubility ζ of the solute molecules in water [29]: (a) Global phase diagram for 0ΦS1. The phase diagram is mirror symmetric with respect to the dashed vertical line at ΦS=1/2, which implies horizontal tie lines. The critical demixing point (red star) with coordinates (ΦS,ζ)=(1/2,0.746) is located at the crossing point of the dashed vertical line and the binodal line (dark blue). The binary mixture forms a uniform phase above the binodal line and undergoes phase separation into a water-rich phase α with ΦS<0.5 and a solute-rich phase β with ΦS>0.5; and (b) Phase diagram for 0ΦS0.2 corresponding to the left blue-shaded region of panel a. The green points correspond to good solvent conditions with ζ=25/32=0.781 above the critical point, the red points to poor solvent conditions with ζ=25/40=0.625 below the critical point. Replacing the solubility by temperature leads to a very similar phase diagram.
Figure 28
Figure 28
Budding of nanovesicles for good solvent condition: (a) A spherical vesicle with volume ν=1 is exposed to solute mole fraction ΦS=0.1 and subsequently deflated to volume ν=0.7; and (b) The same spherical vesicle is first deflated to volume ν=0.7 and then exposed to an increasing solute mole fraction from ΦS=0 up to ΦS=0.1. Both protocols lead to the same final dumbbell morphology with a closed membrane neck, corresponding to the rightmost snapshots. The solute-induced budding process in panel b is reversible as demonstrated by decreasing and increasing the solute concentration several times [29].
Figure 29
Figure 29
Time evolution of an individual nanovesicle exposed to solute concentration ΦS=0.025 close to the binodal line, which is located at ΦS=0.0275 for solubility ζ=0.625: At time t=0μs, the volume of the vesicle is reduced from ν=0.80 to ν=0.75 and then kept constant at this latter value. The vesicle responds to this volume decrease by closing and reopening its neck in a recurrent fashion. This recurrent process of neck closure and neck opening persists for at least 90μs, see next Figure 30, which displays the time evolution of the neck diameter [29].
Figure 30
Figure 30
Time evolution of outer neck diameter Dne corresponding to the time-lapse snapshots of the nanovesicle in Figure 29 for volume ν=0.75. The membrane neck repeatedly closes and opens up again. We consider the neck to be closed for Dne10d and to be open for Dne10d. where Dne10d represents the outer diameter of the closed neck [29].
Figure 31
Figure 31
Nanovesicle exposed to exterior solution with solute concentration ΦS=0.026 close to the binodal line, which is located at ΦS=0.0275 for solubility ζ=0.625: At time t=0μs, we start from a prolate shape with volume ν=0.9 and reduce the vesicle volume to ν=0.85, which is then kept fixed for all later times. The vesicle transforms into a dumbbell shape with a membrane neck that is closed at t=30.5μs and reopens fast within about one μs. The cross-sectional snapshot at t=33.85μs indicates that the geometry of the neck has changed by adhesion of two membrane segments close to the neck. This adhesion is mediated by a layer of adsorbed solutes (orange dots), which generate a rapidly expanding contact area until the neck is cleaved and the vesicle is divided into two daughter vesicles. These two separate vesicles continue to adhere to each other via an intermediate adsorption layer of solutes and form a stable morphology for later times t34.20μs. The time dependence of the neck diameter and the growing contact area are displayed in Figure 32 [29].
Figure 32
Figure 32
Time evolution of (a) neck diameter Dne and (b) contact area between the two adhering membrane segments close to the neck, corresponding to the time series of snapshots in Figure 31. In this example, the neck was cleaved and the nanovesicle divided after a fission time of 34.15 μs. Note that the fission process involves a free energy barrier that has to be overcome by thermal noise. Therefore, the fission time varies from one fission event to another [29].
Figure 33
Figure 33
Starting from two adhering daughter vesicles as displayed in the last snapshot of Figure 31, we remove the solute molecules from the solution by transmuting all solute beads into water beads at time t=0μs. As a result of this removal, a fusion pore starts to appear in the contact zone after 0.3μs and leads to complete fusion of the two adhering daughter vesicles into a prolate vesicle within less than 0.6μs. [Simulations by Rikhia Ghosh].
Figure 34
Figure 34
Partial engulfment of a condensate nanodroplet (β, dark blue) by a planar bilayer, consisting of lipids with yellow headgroups and green lipid tails as studied by molecular dynamics simulations [26]. The αβ interface between the droplet and the liquid bulk phase α forms a contact line with the bilayer which partitions this bilayer into a βγ segment in contact with the β droplet and into an αγ segment exposed to the α phase.
Figure 35
Figure 35
Formation of a non-circular, tight-lipped membrane neck generated by a nanodroplet (dark blue) that adheres to a planar bilayer [26]. This process was induced by a time-dependent reduction of the lateral size L of the simulation box, keeping the box volume fixed: (a) Bottom views of circular bilayer segments (yellow) around the αβ interface (blue) of the β droplet, separated by the contact line which is circular at time t=0μs, strongly non-circular after t=3μs, and has closed into a tight-lipped shape after t=4μs; and (b) Side views of the same bilayer-droplet morphology, with perpendicular cross-sections through membrane (green) and droplet (blue) taken along the red dashed lines in panel (a). The non-circular shape of the membrane neck is caused by the negative line tension of the contact line and prevents membrane fission. Same color code as in Figure 34.
Figure 36
Figure 36
Engulfment of spherical nanoparticles by planar bilayers: (a) Partial engulfment of a nanoparticle with radius 5d; [25] and (b) Complete engulfment of particle with radius 8d. [Simulations by Aparna Sreekumari]. The complete engulfment process leads to a tight-lipped membrane neck as follows from the bottom views of the same bilayer-nanoparticle system displayed in Figure 37. The bilayer in panel b contains 59×59 lipids (red-green) in each leaflet. The bilayer edges indicate the lateral size of the simulation box.
Figure 37
Figure 37
Engulfment of a spherical nanoparticle (purple) by a symmetric planar bilayer: The radius of the nanoparticle is equal to 8d. The planar bilayer contains 59×59=3481 lipids (red-green) in each leaflet. The different snapshots show the bottom view of the equilibrated bilayer-particle system for decreasing lateral sizes L of the simulation box. The initial snapshot displays the system for L=63.62d, with a circular contact line between particle and bilayer. The contact line becomes strongly non-circular for L=52.52d and is hardly visible in the last snapshot for L=48.82d. For L=43.62d, corresponding to the side view in Figure 36b, the nanoparticle is no longer visible from the bottom. [Simulations by Aparna Sreekumari].
Figure 38
Figure 38
Partial engulfment of a condensate droplet (green) by the lipid bilayer (purple-grey) of a nanovesicle. The vesicle encloses the aqueous solution γ (blue). Both the nanodroplet and the nanovesicle are immersed in the aqueous bulk phase α (white): (a) Initially, the droplet is well separated from the vesicle which implies that the outer leaflet of the bilayer is only in contact with the α phase; (b) When the droplet is attracted towards the vesicle, it spreads onto the lipid bilayer, thereby increasing its contact area with the vesicle bilayer; and (c) Partial engulfment of the droplet by the membrane after the vesicle-droplet couple has relaxed to a new stable state. The contact area between bilayer and β droplet defines the βγ segment of the bilayer membrane whereas the rest of the bilayer represents the αγ segment still exposed to the α phase [31].
Figure 39
Figure 39
Complete axisymmetric engulfment of condensate droplets (green) followed by the division of the nanovesicle (purple-grey) into two nested daughter vesicles: (a) Vesicle bilayer with Nol=5400 lipids in the outer and Nil=4700 lipids in the inner leaflet. At time t=0, the droplet is partially engulfed by the vesicle membrane, which forms an open membrane neck. At t=0.3, the neck closes and the droplet becomes completely engulfed. The neck undergoes fission at t=2μs, thereby generating a small intraluminal vesicle around the droplet; and (b) Vesicle bilayer with Nol=5500 lipids in the outer and Nil=4600 lipids in the inner leaflet. The membrane neck now closes at t=4μs and undergoes fission at t=9μs, again generating a small intraluminal vesicle around the droplet. In both panels (a) and (b), the vesicle volume is equal to ν=0.6 during the whole endocytic process [31].
Figure 40
Figure 40
Complete non-axisymmetric engulfment of condensate droplets (green), which impedes the division of the nanovesicle (purple-grey): (a) Vesicle bilayer with Nol=5700 lipids in its outer and Nil=4400 lipids in its inner leaflet. At time t=0, both the vesicle with volume ν=0.7 and the partially engulfed droplet (green) are axisymmetric, a morphology that persists until t=12μs, see white dashed circles around the contact lines. At t=12μs, we reduce the vesicle volume from ν=0.7 to ν=0.6, which leads to complete engulfment of the droplet via non-axisymmetric shapes. The broken rotational symmetry is directly visible from the strongly non-circular and highly elongated contact line, see white dashed rectangles around the contact lines at t=13.5μs and t=30μs; and (b) Vesicle bilayer with Nol=5963 lipids in its outer and Nil=4137 lipids in its inner leaflet. Now, the vesicle volume is kept at the constant value ν=0.7. At t=0, the droplet is partially engulfed by the vesicle membrane with an axisymmetric contact line, see white dashed circle. The axial symmetry is broken at t=5μs, as follows from the strongly non-circular and highly elongated contact lines for t5μs, see white dashed rectangles [31].
Figure 41
Figure 41
Line tension λ of contact line between droplet and vesicle membrane as a function of lipid number Nol in the outer leaflet for constant total lipid number Nol+Nil=10,100, corresponding to OLT states of the vesicle bilayers. The line tension is calculated for droplets with three different diameters Ddr, see inset, via the force balance relationship in Equation (30). As we increase Nol, the line tension undergoes a transition from positive to negative values. The line tension is positive for Nol=5400 and 5500, for which the whole engulfment process remains axisymmetric as in Figure 39. On the other hand, for Nol=5700 and 5963, the line tension has a negative value and leads to the formation of a tight-lipped membrane neck as in Figure 40. The dashed vertical lines provide estimates for the lipid numbers Nol=Nol[0], at which the line tension vanishes. The numerical values of Nol[0] vary from Nol[0]=5582 for the smallest droplets to Nol[0]=5538 for the largest droplets [31].
Figure 42
Figure 42
Stress asymmetry of tensionless bilayers for spherical nanovesicles with volume ν=ν0: Leaflet tensions Σol (black squares) and Σil (blue circles) of the outer and inner leaflet as a function of the lipid number Nol assembled in the outer leaflet which implies the lipid number Nil=10,100Nol in the inner leaflet. For 5400Nol<5963, the outer leaflet is stretched by the positive tension Σol whereas the inner leaflet is compressed by the negative tension Σil. Both leaflet tensions vanish for Nol=5963. In all cases, the bilayer tension Σ=Σol+Σil (green diamonds) is close to zero [31].
Figure 43
Figure 43
Two identical vesicles that come into contact adhere to each other when their outer leaflets are stretched provided the outer leaflet tensions remain below a certain threshold value. Each vesicle contains Nil=4400 lipids in its inner and Nol=5700 lipids in its outer leaflet. Up to time t=0μs, each vesicle has the volume ν=0.8 and its outer leaflet is stretched by the positive leaflet tension Σol=+0.87kBT/d2 whereas its inner leaflet is compressed by the negative leaflet tension Σil=0.82kBT/d2. At t=0μs, the volume of each vesicle is reduced from ν=0.8 to ν=0.7. The vesicles then transform into oblate shapes that form a large contact area as shown in the last snapshot at t=20μs. [Simulations by Rikhia Ghosh].
Figure 44
Figure 44
Two identical vesicles that come into contact undergo fusion when their outer leaflets are stretched by a sufficiently large leaflet tension and their bilayers experience a sufficiently large stress asymmetry. Initially, each vesicle contains Nil=4500 lipids in its inner and Nol=5600 lipids in its outer leaflet. Thus, compared to the initial state in Figure 43, 100 lipids have been moved from the outer to the inner leaflet, thereby increasing the tension in the outer leaflet to Σol=+1.02kBT/d2 whereas the inner leaflet tension is Σil=1.02kBT/d2. Each vesicle has the initial volume ν=1 which remains unchanged during the whole process, in contrast to the adhesion process displayed in Figure 43. At time t=0, the two vesicles are brought into contact and promptly undergo fusion within 0.3μs without any volume reduction. [Simulations by Rikhia Ghosh].

Similar articles

Cited by

References

    1. Gorter E., Grendel F. On bimolecular layers of lipoids on the chromocytes of the blood. J. Exp. Med. 1925;41:439–443. doi: 10.1084/jem.41.4.439. - DOI - PMC - PubMed
    1. Robertson J.D. The molecular structure and contact relationships of cell membranes. Prog. Biophys. Mol. Biol. 1960;10:343–418. doi: 10.1016/S0096-4174(18)30194-X. - DOI - PubMed
    1. Robertson J.D. The ultrastructure of cell membranes and their derivatives. Biochem. Soc. Symp. 1959;16:3–43. - PubMed
    1. Bangham A., Horne R. Negative Staining of Phospholipids and their Structural Modification by Surface-active Agents as observed in the Electron Microscope. J. Mol. Biol. 1964;8:660–668. doi: 10.1016/S0022-2836(64)80115-7. - DOI - PubMed
    1. Jahn A., Stavis S.M., Hong J.S., Vreeland W.N., DeVoe D.L., Gaitan M. Microfluidic Mixing and the Formation of Nanoscale Lipid Vesicles. ACS Nano. 2010;4:2077–2087. doi: 10.1021/nn901676x. - DOI - PubMed

Publication types

LinkOut - more resources