. 2023 Jun 14;12(6):1274.
doi: 10.3390/antiox12061274.

Each Cellular Compartment Has a Characteristic Protein Reactive Cysteine Ratio Determining Its Sensitivity to Oxidation

Affiliations

Each Cellular Compartment Has a Characteristic Protein Reactive Cysteine Ratio Determining Its Sensitivity to Oxidation

Ricardo Pires das Neves et al. Antioxidants (Basel). .

Abstract

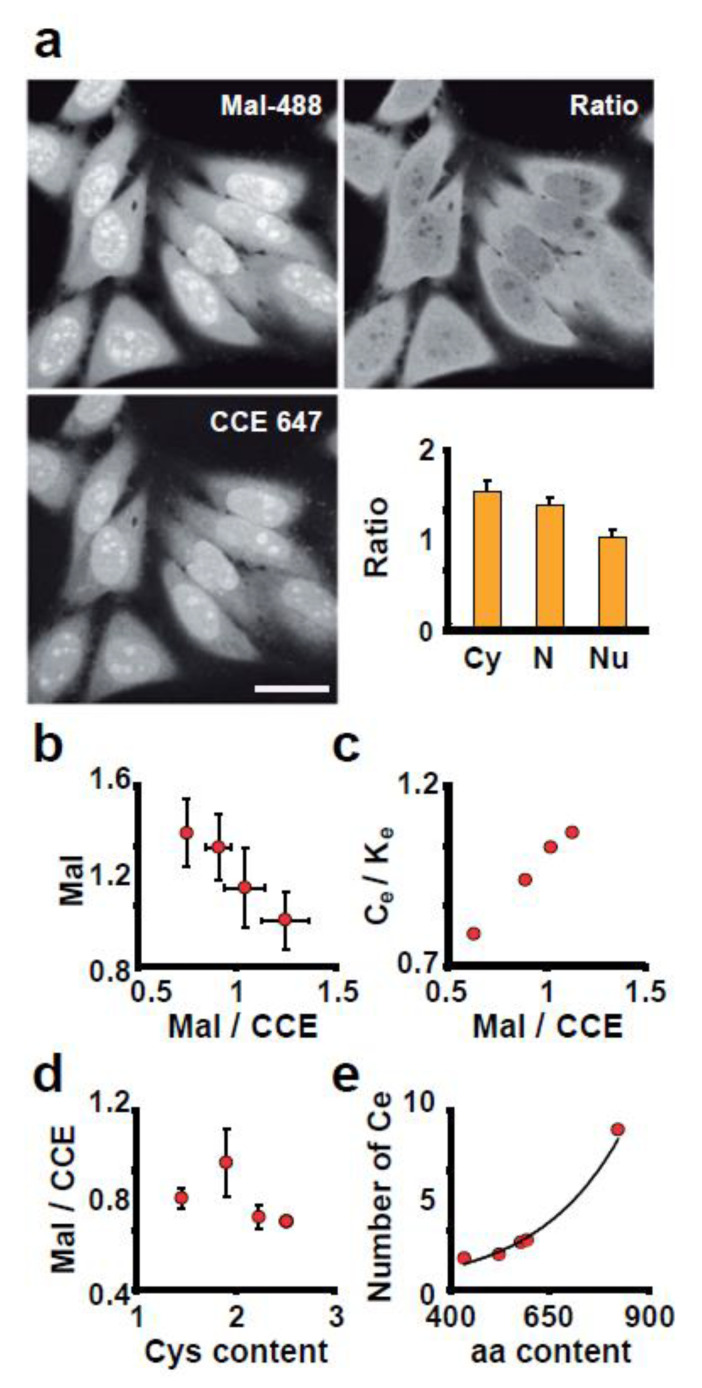
Signaling and detoxification of Reactive Oxygen Species (ROS) are important patho-physiologcal processes. Despite this, we lack comprehensive information on individual cells and cellular structures and functions affected by ROS, which is essential to build quantitative models of the effects of ROS. The thiol groups from cysteines (Cys) in proteins play a major role in redox defense, signaling, and protein function. In this study, we show that the proteins in each subcellular compartment contain a characteristic Cys amount. Using a fluorescent assay for -SH in thiolate form and amino groups in proteins, we show that the thiolate content correlates with ROS sensitivity and signaling properties of each compartment. The highest absolute thiolate concentration was found in the nucleolus, followed by the nucleoplasm and cytoplasm whereas protein thiolate groups per protein showed an inverse pattern. In the nucleoplasm, protein reactive thiols concentrated in SC35 speckles, SMN, and the IBODY that accumulated oxidized RNA. Our findings have important functional consequences, and explain differential sensitivity to ROS.

Keywords: 8-hydroxy guanosine; RNA polymerase; SMN; nuclear speckles; oxidative stress; oxidized RNA; thioredoxin; transcription.


Conflict of interest statement

IC Biomed provided support in the form of salary to author J.C. This does not alter our adherence to all the Scientific Reports policies on sharing data and materials.

Figures

Figure 1
Figure 1
Cys distribution analysis in proteins from various compartments. Bioinformatic analysis of the aminoacid content of proteins from various cellular compartments, as standardised by proteome composition. As a result, a value greater than 1 indicates that the aminoacid is overrepresented in the compartment. The letter Cys is highlighted in red. Cys is overrepresented in the extracellular compartment and the cytoskeleton, but is underrepresented in mitochondria and SC35 nuclear speckles. 2.2. Maleimide-Alexa Dye staining is specific for reactive thiolic groups in proteins.
Figure 2
Figure 2
A new method to study protein thiols compartmentalization. (a) Blocking of amino groups. To see if Mal-488 reacts with amino groups in proteins, we blocked amino groups in fixed and permeabilized cells with CEE before staining with Mal-488 (100 nM). The intensity of the Mal-488 staining in cells incubated with CCE (+) was identical to that in cells not incubated with CCE (−). (b) Mal-488 titration and specificity. We titrate the concentration of Mal-488 and measure the intensity as a function of [Mal-488] to determine the degree of reactive Cys saturation. To avoid changes in Mal-488 intensity caused by changes in protein content, we plotted the Mal-488/CCE-647 ratio. The red dots represent control cells, while the blue dots represent cells treated with 10 mM iodoacetamide 30 min. (c) In order to calculate the specificity of Mal-488 staining we plotted for all the concentrations tested the ratio of iodoacetamide cells versus control. (d) Cells stained with GSH-specific antibodies revealed no signal, indicating that free GSH is extracted after fixation. Bar 10 μm. (e) To investigate the specificity of Mal-488 staining further, Thioredoxin was knocked down to 20% of its normal value for 48 h using siRNA. Trx reduction resulted in a significant reduction in Mal-488 staining. This decrease was not due to a possible global decrease in cellular protein content, as evidenced by the significant decrease in the ratio of Mal-488 and CCE-647 in co-stained cells with these two markers (* p > 0.005). (f) Hela cells were exposed for 2 h to various concentrations of diamide (0, 50, 100, and 200 M). As the concentration of diamide increases, the signal of Mal-488 decreases. Bar 10 μm. (g) Quantification of the Mal-488 signal throughout the cell. GSH depletion resulted in a direct decrease in the amount of reduced Cys in the cell. (h) Distribution of Mal-488 staining in unfixed cells permeabilised with 100 μg/mL saponin.
Figure 3
Figure 3
Not all of the exposed cysteines are reactive. (a) The increase in the ratio for Mal-488 and CCE-647 after 1 h of 1 mM NAC incubation demonstrated that cellular proteins are not completely reduced. As expected, treatment with 100 μM diamide (D) reduced the ratio of these two markers. (b) Apoptotic cells (Apo.) had a lower content of reactive Cys in proteins than controls. (c) The cell’s reduction status affects the length of the cell cycle (hours). Cells were incubated continuously in the presence of NAC (concentration in mM). The experiment lasted four days.
Figure 4
Figure 4
The signal of P-Nrf2 is related to the Mal-488/CCE-647 ratio. (a) The ratio of Mal-488/CCE-647 was different between cells. Only 10% of the cells displayed extreme Mal-488/CCE-647 values, falling outside of the yellow area representing cells with less than 10% variability. (b) P-Nrf2 intensity distribution in the nucleus of cells similar to panel c. Cells treated with diamide 50 μM for 1 h are represented by blue bars. (c) Cells stained with Mal-488, CCE-647, and P-Nrf2. The sub-panels show Mal-488 staining (Mal), P-Nrf2, a Merge panel of Mal-488 and P-Nrf2, and a scatter plot of P-Nrf2 versus the Mal-488/CCE-647 ratio. This plot shows that P-Nrf2 is strongly dependent on the amount of reduced Cys. Blue dots represent stratified data sampling, with samples taken every 0.05 unit of Mal-488/CCE-647 ratio. The stratified data can be fitted to an exponential decay with a ρ2 of 0.995. # Cells Stands for number of cells. Bar 10 μm.
Figure 5
Figure 5
Each cell compartment has a distinct amount of reduced Cys. (a) Cells stained with Mal-488 and CCE-647. The ratio panel is created by dividing the Mal-488 signal by CCE-647 in each pixel. The bar chart shows the quantification of Mal-488/CCE-647 across different compartments (Cy is cytoplasm, N is nucleoplasm, and Nu is nucleolus). Bar 10 μm. (b) The relationship between Mal-488 content and the Mal-488/CCE-647 ratio in different compartments (nucleoplasm, nucleolus, cytoplasm, and mitochondria) is shown in this panel. The plot demonstrates an inverse relationship. (c) Plot of theoretical ratio of exposed Cys (Ce) and Lys (Ke); (Ce/Ke) versus Mal-488/CCE-647 values (the compartments were mitochondria, nucleoplasm, nucleolus, cytoplasm, and actin cytoskeleton). (d) A plot of the Mal-488/CCE-647 ratio versus the Cys content in different compartments. (e) Relationship between the average number of exposed Cys and the average number of aminoacids in proteins per compartment.
Figure 6
Figure 6
The amount of reduced Cys in a compartment determines its susceptibility to ROS. (a) This panel shows the quantification of Mal-488 staining/pixel in different compartments. The nucleolus is red, the nucleoplasm is green, the cytoplasm is blue, and the actin cytoskeleton is yellow. Each compartment’s standardisation was done separately. After 1 h of exposure to 125 μM diamide, all compartments showed a reduction in the staining signal, but it was not uniform. (b) Comparison between the initial level of Mal-488 per pixel in each compartment under investigation and the relative decline following diamide exposure. In this graph, the initial concentration of thiolates in a compartment is directly correlated with the relative signal loss. (c) Proteins stained to detect carbonyl groups. This panel demonstrates that the cytoplasm and nucleolus contain more carbonyls than the nucleoplasm does. Bar 5 μm. (d) Using Mal-488 to stain UBF or Br-RNA. This panel illustrates the relationship between high Mal-488 staining areas and transcription foci for both RNA pol I (UBF) and RNA pol II. Bars: for UBF 300 nm and for Br-RNA 2μm. (e) Evaluation of the Br-RNA synthesis activity’s sensitivity to a 1 h diamide exposure. Different effects are seen on the RNA pol II (blue) and RNA pol I (red) activities. (f) The RNA pol I activity (Br-RNA)’s sensitivity to exposure to diamide is demonstrated in this panel. Bar 5 μm. (g) Following a 1 h exposure to 250 μM diamide, the glutathionylated proteins are stained in the first panel. Only cells that have been exposed to light are clearly stained, and the GSH signal gathers near the cytoplasmic edge. Bar 10 μm. Quantitative analysis of GSH staining in various compartments is shown in the upper graph. Yellow represents the actin cytoskeleton, green the nucleolus, blue the cytoplasm, and red the nucleolus. The lower plot shows the relationship between the slope of the lines in the top panel and the Mal-488/CCE-647 ratio. This graph clearly shows a direct relationship between compartment glutathionylation and thiolate group concentration per protein. 2.5. Intra-nuclear reactive thiol compartmentalization.
Figure 7
Figure 7
The cell nucleus compartmentalises oxidised RNA. (a) Mal-488, 8HG (oxidised RNA), and SMN bodies were used to stain the cell nucleus. A zoom of the new IBODY, which is close to SMN and is highly concentrated in oxidised RNA, is shown in the four panels insert. Bar 2 μm. (b) At the SC35 nuclear speckles, oxidised RNA accumulate. The different panels demonstrate the rise in oxidised RNA in the cell following a 1 h exposure to diamide. It is easy to see that the 8HG signal in the SC35 nuclear speckles has increased. Bar 5 μm. (c) Quantification of the 8HG signal/pixel in the nucleoplasm (blue) and nuclear speckles (red) of the SC35 image. The SC35 nuclear speckles line has a slope that is steeper than the nucleoplasms line, indicating that oxidised RNA has accumulated selectively in the speckles. (d) Measuring the 8HG signal and Trx in specific cells. According to the Section 2, red circles represent Trx knockdown cells and blue circles represent control cells.

Similar articles

Cited by

References

    1. Toyokuni S., Okamoto K., Yodoi J., Hiai H. Persistent oxidative stress in cancer. FEBS Lett. 1995;358:1–3. doi: 10.1016/0014-5793(94)01368-B. - DOI - PubMed
    1. Boonstra J., Post J.A. Molecular events associated with reactive oxygen species and cell cycle progression in mammalian cells. Gene. 2004;337:1–13. doi: 10.1016/j.gene.2004.04.032. - DOI - PubMed
    1. Schafer F.Q., Buettner G.R. Redox environment of the cell as viewed through the redox state of the glutathione disulfide/glutathione couple. Free Radic. Biol. Med. 2001;30:1191–1212. doi: 10.1016/S0891-5849(01)00480-4. - DOI - PubMed
    1. LoPachin R.M., Gavin T. Reactions of electrophiles with nucleophilic thiolate sites: Relevance to pathophysiological mechanisms and remediation. Free Radic. Res. 2015;50:195–205. doi: 10.3109/10715762.2015.1094184. - DOI - PMC - PubMed
    1. Go Y.-M., Chandler J.D., Jones D.P. The cysteine proteome. Free Radic. Biol. Med. 2015;84:227–245. doi: 10.1016/j.freeradbiomed.2015.03.022. - DOI - PMC - PubMed

LinkOut - more resources