. 2023 Jun 8;12(6):834.
doi: 10.3390/biology12060834.

Bilirubin-Induced Transcriptomic Imprinting in Neonatal Hyperbilirubinemia

Affiliations

Bilirubin-Induced Transcriptomic Imprinting in Neonatal Hyperbilirubinemia

John Paul Llido et al. Biology (Basel). .

Abstract

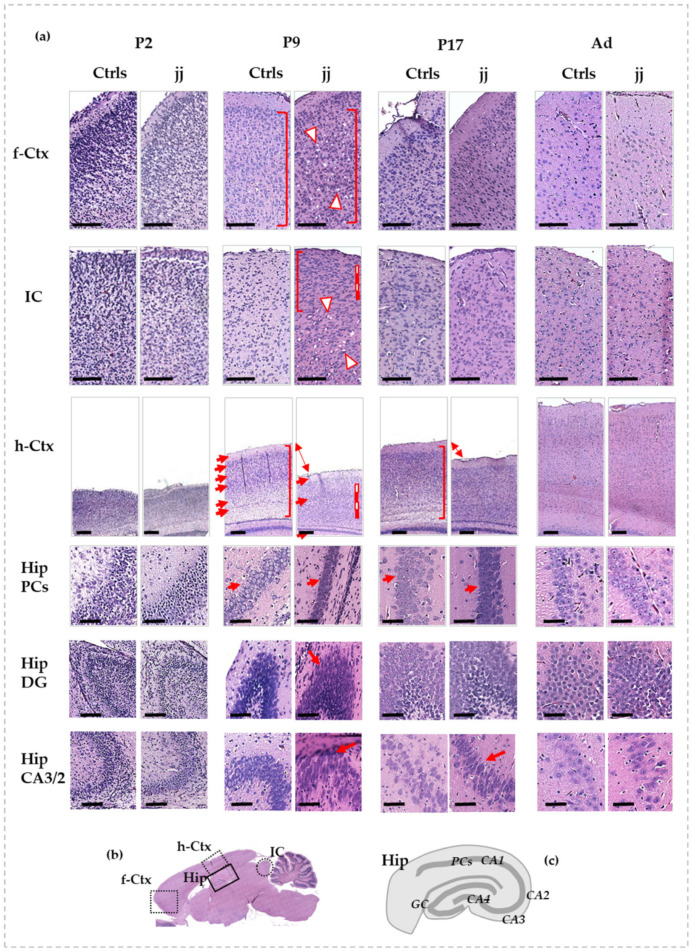
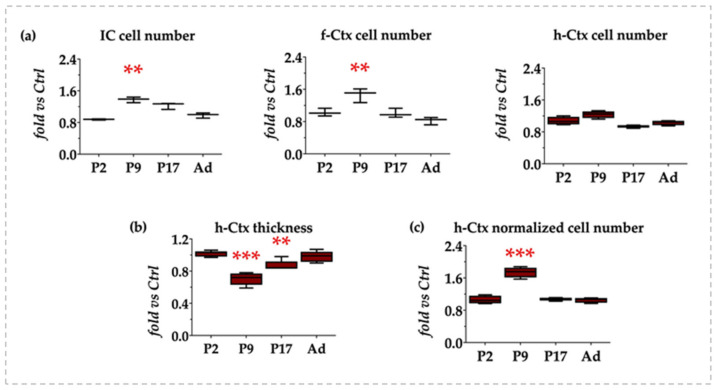
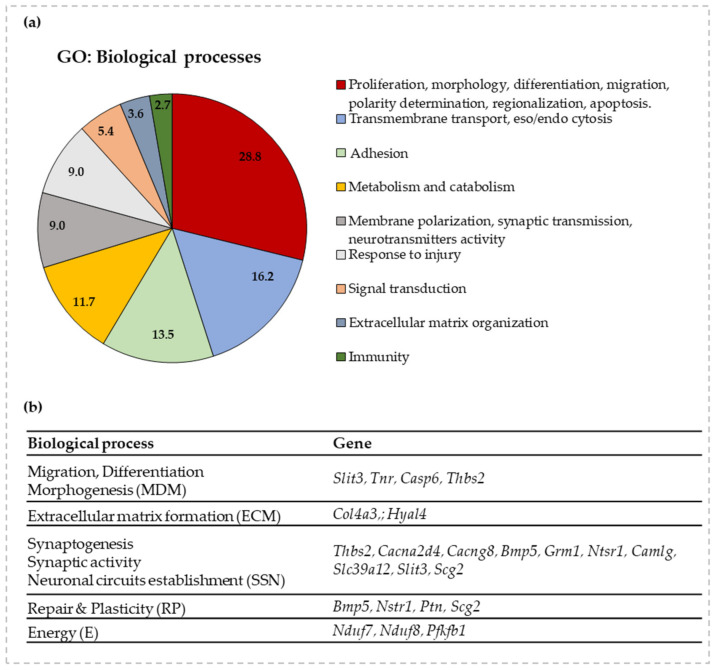
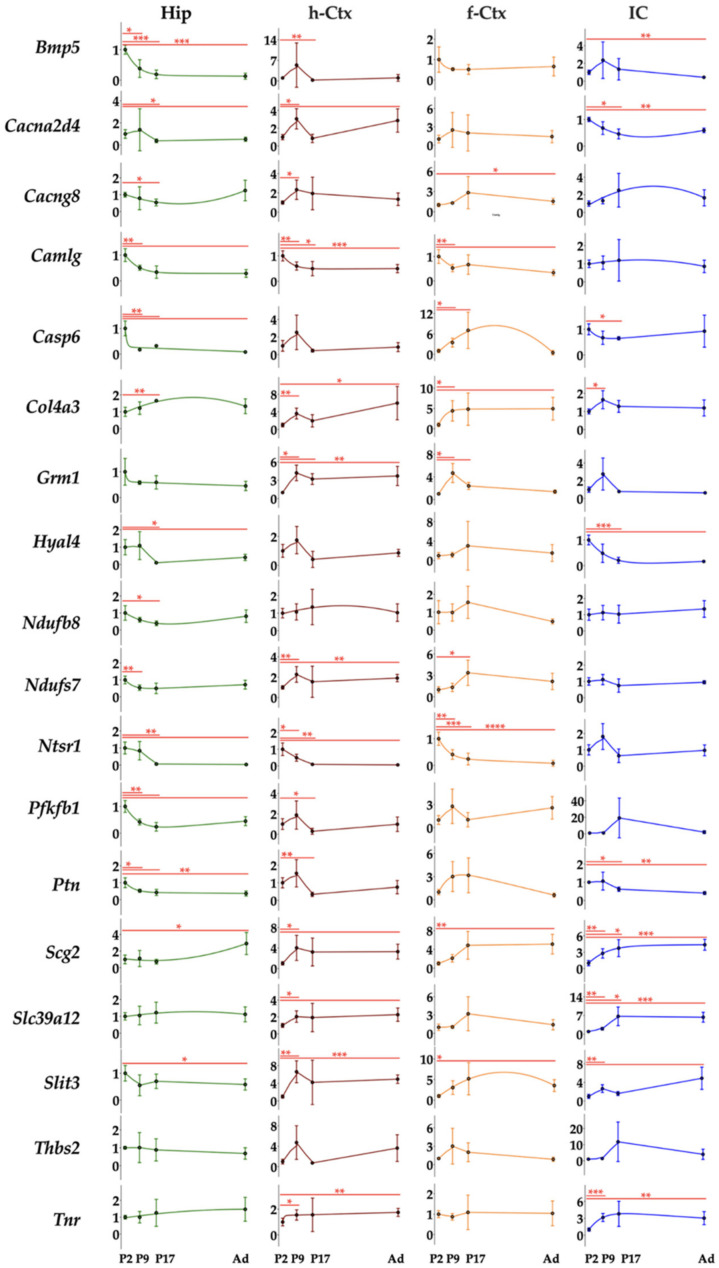
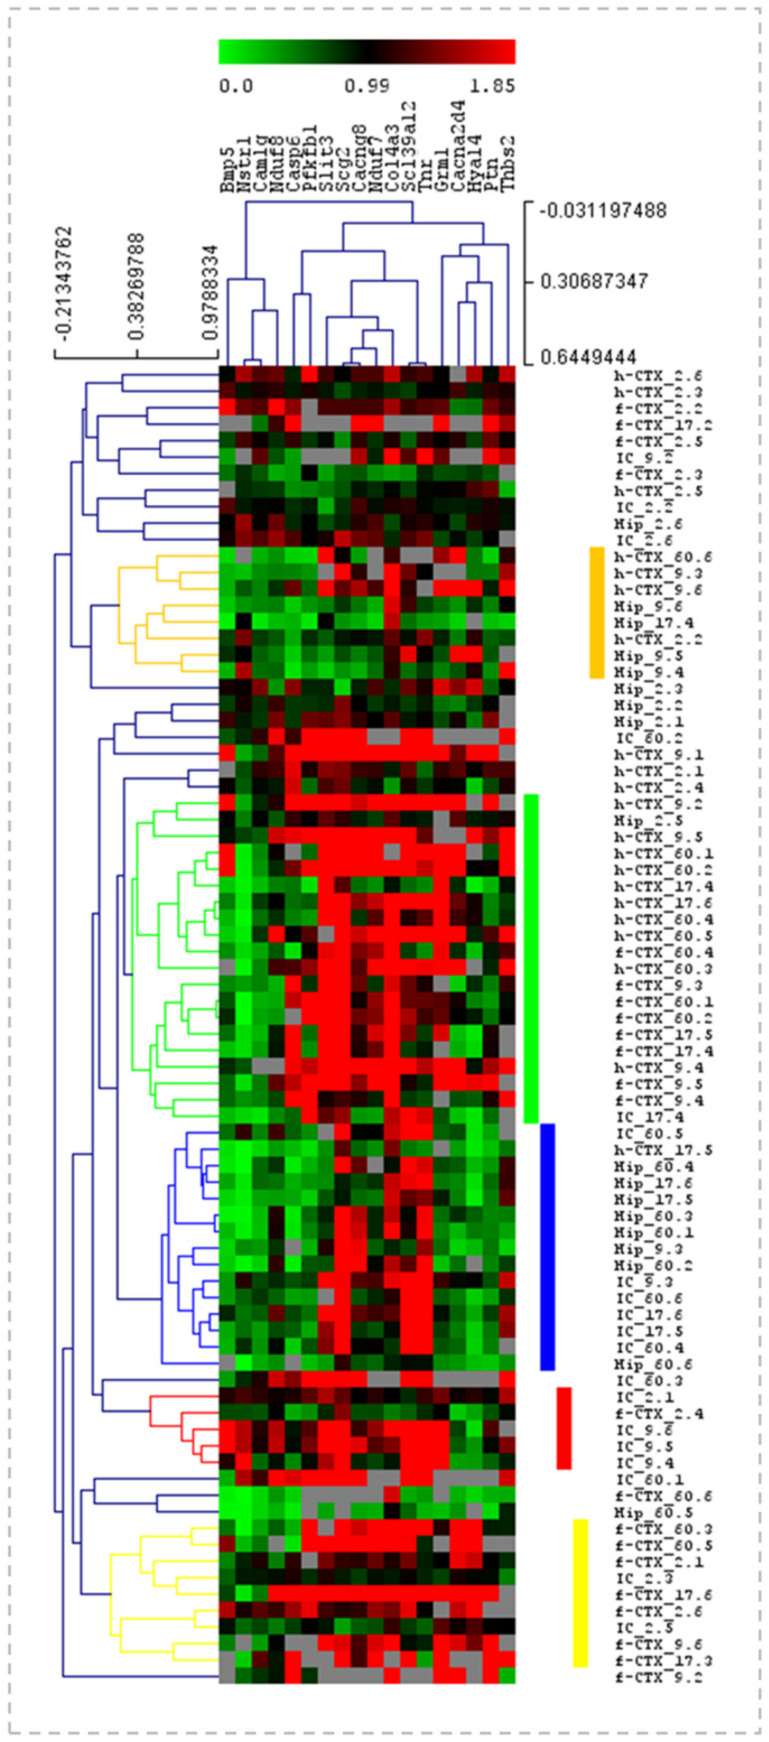
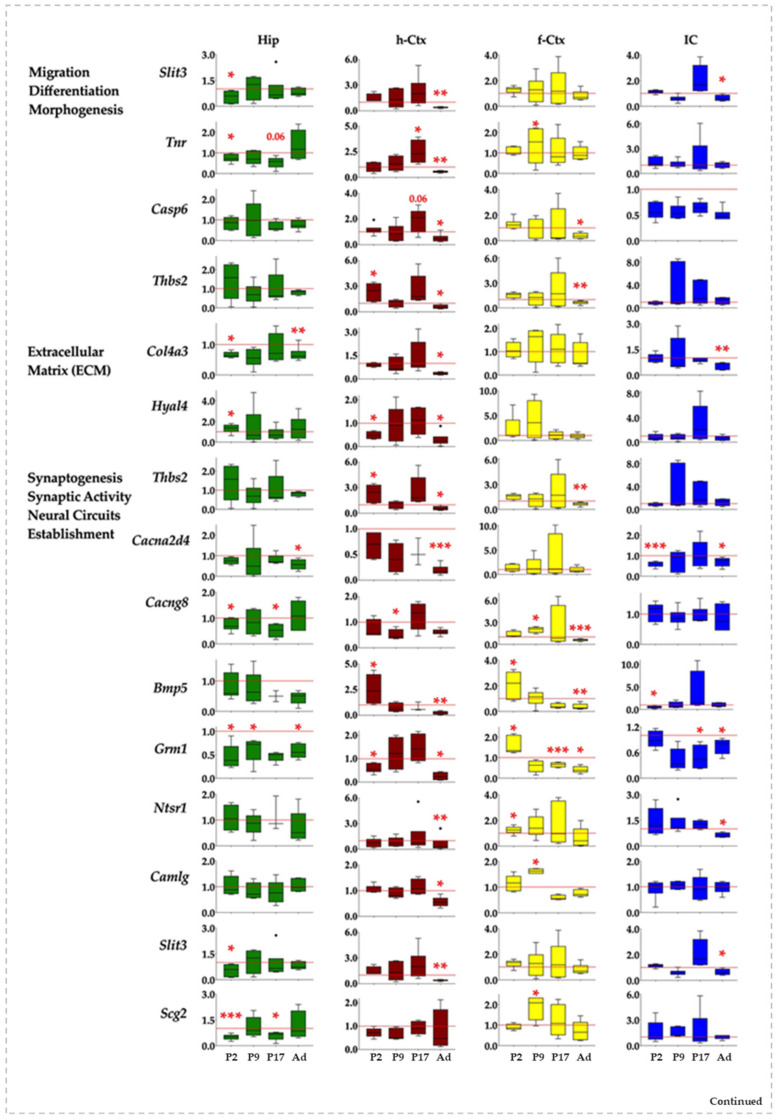
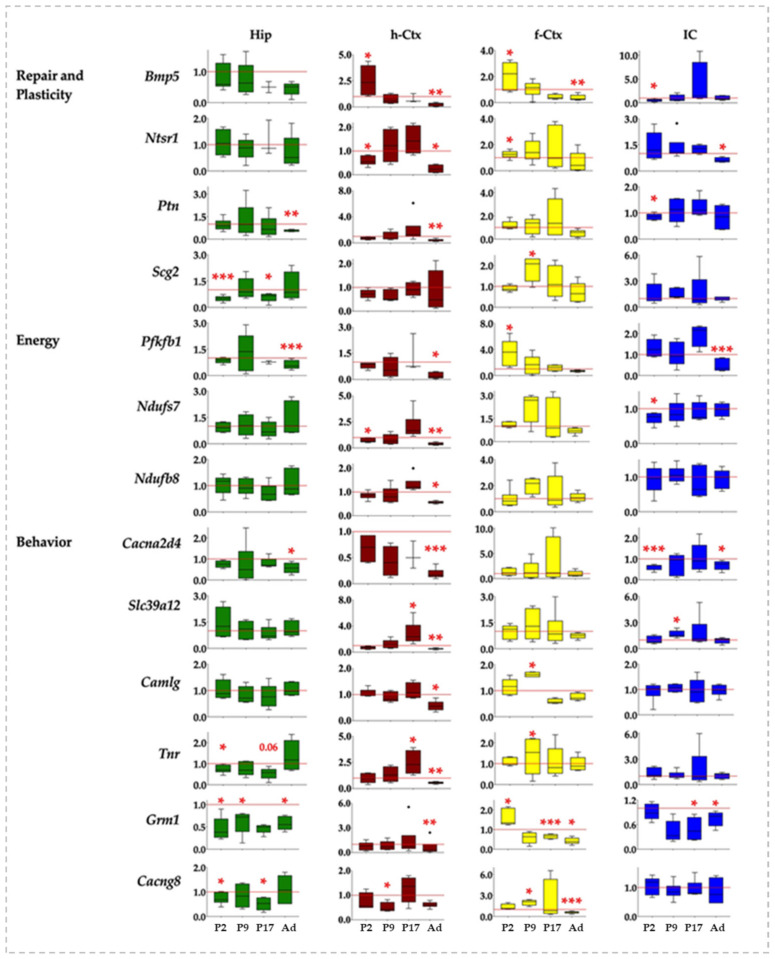
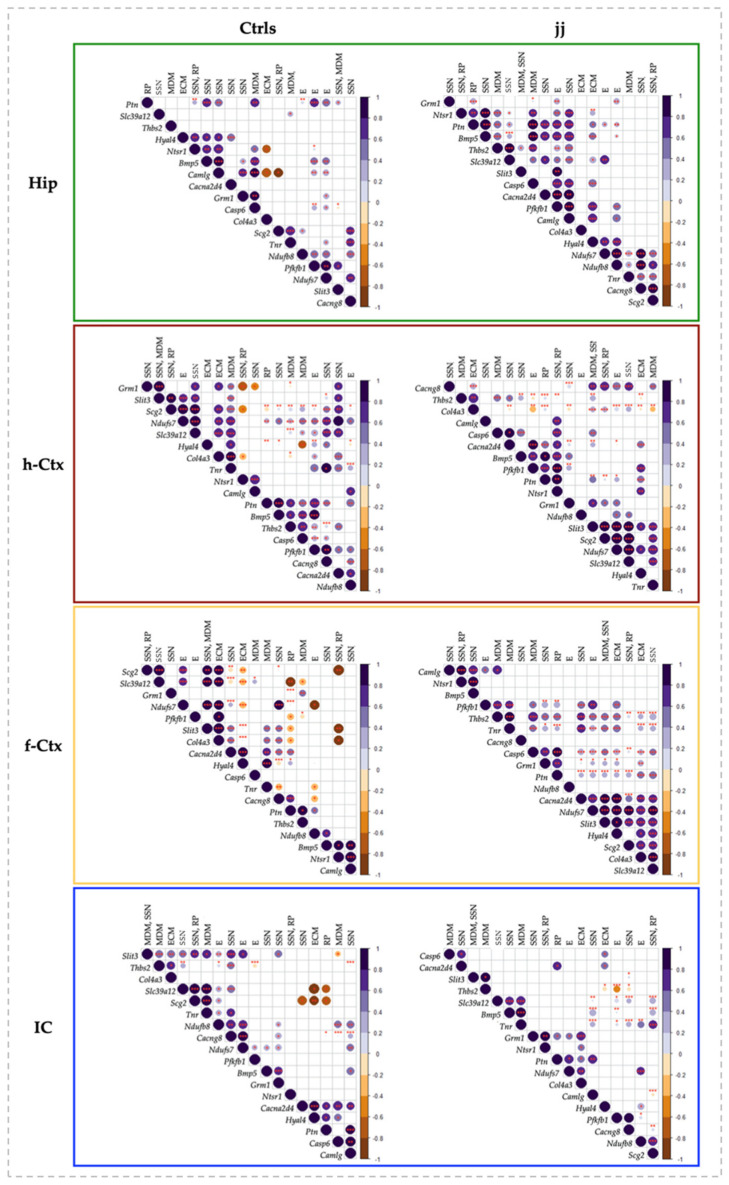
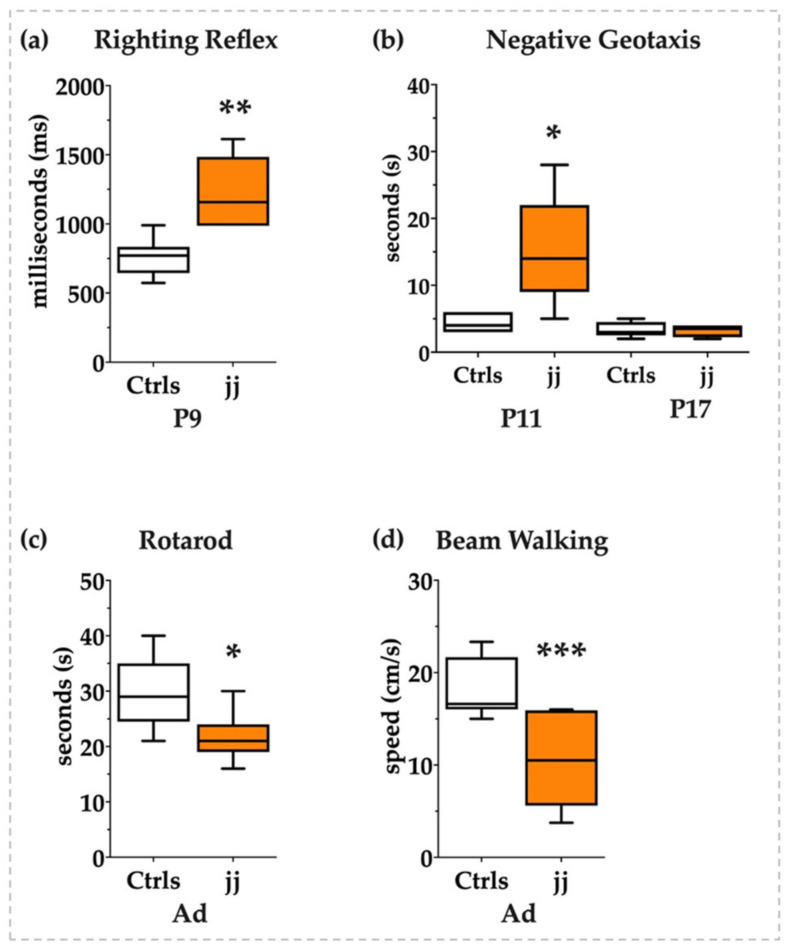
Recent findings indicated aberrant epigenetic control of the central nervous system (CNS) development in hyperbilirubinemic Gunn rats as an additional cause of cerebellar hypoplasia, the landmark of bilirubin neurotoxicity in rodents. Because the symptoms in severely hyperbilirubinemic human neonates suggest other regions as privileged targets of bilirubin neurotoxicity, we expanded the study of the potential impact of bilirubin on the control of postnatal brain development to regions correlating with human symptoms. Histology, transcriptomic, gene correlation, and behavioral studies were performed. The histology revealed widespread perturbation 9 days after birth, restoring in adulthood. At the genetic level, regional differences were noticed. Bilirubin affected synaptogenesis, repair, differentiation, energy, extracellular matrix development, etc., with transient alterations in the hippocampus (memory, learning, and cognition) and inferior colliculi (auditory functions) but permanent changes in the parietal cortex. Behavioral tests confirmed the presence of a permanent motor disability. The data correlate well both with the clinic description of neonatal bilirubin-induced neurotoxicity, as well as with the neurologic syndromes reported in adults that suffered neonatal hyperbilirubinemia. The results pave the way for better deciphering the neurotoxic features of bilirubin and evaluating deeply the efficacy of new therapeutic approaches against the acute and long-lasting sequels of bilirubin neurotoxicity.

Keywords: brain development; corplot; gene clustering; histone acetylation; kernicterus; motor disabilities; neurologic syndrome; opisthotonus; schizophrenia.


Conflict of interest statement

The authors declare no conflict of interest.

Figures

Figure 1
Figure 1
Histological features of f-Ctx, h-Ctx, IC, and Hip of developing Gunn rats compared to age-matched controls. In (a): Histologic pictures showing the major alterations observed in jj vs. Ctrls rats. P—postnatal age in days; Ad—adults, more than 6-month-old; jj—hyperbilirubinemic Gunn rats; Ctrls—normobilirubinemic age-matched Gunn rats; f-Ctx—frontal cortex; h-Ctx—parietal cortex; IC—Inferior colliculi; Hip—hippocampus; PCs—pyramidal cells; DG—Dentate gyrus; CA—Cornus of Ammonis. Red-white triangles: necrotic lesions. Red and white lines: attracting attention to cellular density. Red square bracket: attracting attention to cellular heterogeneity. Red arrows: drawing attention to different tissue organization, layers, architecture, and shapes of cells. Double arrow: attracting attention to the different thickness. Scale bar: 100 um in each figure. (b) A picture showing where each region under study is located on the rat brain. (c) A representative picture of the Hip structure.
Figure 2
Figure 2
Quantification of the number of cells and h-Ctx thickness in the developing jj Gunn rats. IC—Inferior colliculi; f-Ctx—frontal cortex; h-Ctx—parietal cortex; P—postnatal age in days; Ad—adults, more than 6 months old. (a) Quantification of the cell number in IC, f-Ctx, and h-Ctx. (b) Quantification of the h-Ctx thickness. (c) Number of cells in h-Ctx after normalization for the thickness of the region at each postnatal age. Results are expressed as fold vs. age-matched Ctrls. Statistical significance: ** p < 0.01; *** p < 0.001.
Figure 3
Figure 3
GO enrichment for biological functions and selected genes to follow the impact of bilirubin on postnatal brain development. (a) A graphical representation of the GO analysis. The % of genes belonging to each biological function is detailed in the pie-chart. (b) A list of the selected genes for each relevant biological process (with acronyms for each of them) of postnatal brain development based on GO enrichment analysis. Slit3—slit guidance ligand 3; Tnr—tenascin R, Casp6—caspase 6; Thbs2—thrombospondin-2; Col4a3—collagen 4a3; Hyal4—hyaluronidase 4; Cacna2d4—calcium channel, voltage-dependent, α 2/Δ subunit 4; Cacng8—calcium voltage-gated channel auxiliary subunit gamma 8; Bmp5—bone morphogenetic protein 5; Grm1—glutamate metabotropic receptor 1; Ntsr1—neurotensin receptor 1; Camlg—calcium modulating ligand; Scg2—secretogranin II; Ptn—pleiotrophin; Nduf7/8—NADH: ubiquinone oxidoreductase core subunit 7/8; Pfkfb1—6-phosphofructo-2-kinase/fructose-2,6-biphosphatase 1; Slc39a12—solute carrier family 39 member 12.
Figure 4
Figure 4
Region specific mRNA transcription level during the postnatal development of Ctrl rats. Hip—hippocampus; h-Ctx—parietal cortex; f-Ctx—frontal cortex; IC—inferior colliculi; Bmp5—bone morphogenetic protein; Cacna2d4—calcium voltage-dependent calcium channel complex alpha-2/delta subunit family; Cacng8—calcium voltage-gated channel auxiliary subunit gamma 8; Camlg—calcium modulating ligand; Casp6—caspase 6; Col4a3—collagenase 4a3; Grm1—glutamate metabotropic receptor 1; Hyal4—hyaluronic acid 4; Nduf7/8: NADH—ubiquinone oxidoreductase (complex I) subunit 7/8; Ntsr1—neurotensin receptor 1; Pfkfb1—6-phosphofructo-2-kinase/fructose-2,6-biphosphatase 1; Ptn—pleiotrophin; Scg2—secretogranin II; Slc39a12—solute carrier family 39 member 12; Slit3—slit guidance ligand 3; Thbs2—thrombospondin 2; Tnr—tenascin R. Data are in fold vs. P2 Ctrls. Statistical significance: * p < 0.05; ** p < 0.01; *** p < 0.001.
Figure 5
Figure 5
Heatmap analysis of the gene expression in Ctrls. Heatmap with the pseudocolor scale underneath, unsupervised hierarchical clustering is used to order samples and genes. The sample tree with optimized leaf-ordering is drawn using Euclidean distances and average linkages for cluster-to-cluster distance. Color scale: green = lower expression; red = higher expression. Columns: the 18 genes under analysis. Rows: the expression of each gene in the selected regions, and at a specific postnatal age. f-Ctx—frontal cortex; h-Ctx—parietal cortex; Hip—hippocampus; IC—inferior colliculi; Bmp5—bone morphogenetic protein; Cacna2d4—calcium voltage-dependent calcium channel complex α-2/Δ subunit family; Cacng8—calcium voltage-gated channel auxiliary subunit gamma 8; Camlg—calcium modulating ligand; Casp6—caspase 6; Col4a3—collagenase 4a3; Grm1—glutamate metabotropic receptor 1; Hyal4—hyaluronic acid 4; Nduf7/8: NADH—ubiquinone oxidoreductase (complex I) subunit 7/8; Ntsr1—neurotensin receptor 1; Pfkfb1—6-phosphofructo-2-kinase/fructose-2,6-biphosphatase 1; Ptn—pleiotrophin; Scg2—secretogranin II; Slc39a12—solute carrier family 39 member 12; Slit3—slit guidance ligand 3; Thbs2—thrombospondin 2; Tnr—tenascin R.
Figure 6
Figure 6
Gene and region-specific mRNA transcription levels in hyperbilirubinemic Gunn rats during postnatal development vs. age-matched Ctrl littermates. Gene expression was presented based on the GO functions plus the behavior group, which was added based on literature evidence of single gene involvement in neurological conditions/diseases. Hip—hippocampus; h-Ctx—parietal cortex; f-Ctx—frontal cortex; IC—inferior colliculi. Red line: Ctrls (=1 at each postnatal age). Bmp5—bone morphogenetic protein; Camlg—calcium modulating ligand; Casp6—caspase6; Col4a3—collagenase 4a3; Cacna2d4—calcium voltage-dependent calcium channel complex α-2/Δ subunit family; Cacng8—calcium voltage-gated channel auxiliary subunit gamma 8; Grm1—glutamate metabotropic receptor 1; Hyal4—hyaluronic acid 4; Ntsr1—neurotensin receptor 1; Nduf7/8: NADH—ubiquinone oxidoreductase (complex I) subunit 7/8; Slit3—slit guidance ligand 3; Scg2—secretogranin II; Slc39a12—solute carrier family 39 member 12; Tnr—tenascin R; Thbs2—thrombospondin 2; Ptn—pleiotrophin; Pfkfb1—6-phosphofructo-2-kinase/fructose-2,6-biphosphatase 1. Data are in fold vs. age-matched Ctrls. Statistical significance: * p < 0.05; ** p < 0.01; *** p < 0.001.
Figure 6
Figure 6
Gene and region-specific mRNA transcription levels in hyperbilirubinemic Gunn rats during postnatal development vs. age-matched Ctrl littermates. Gene expression was presented based on the GO functions plus the behavior group, which was added based on literature evidence of single gene involvement in neurological conditions/diseases. Hip—hippocampus; h-Ctx—parietal cortex; f-Ctx—frontal cortex; IC—inferior colliculi. Red line: Ctrls (=1 at each postnatal age). Bmp5—bone morphogenetic protein; Camlg—calcium modulating ligand; Casp6—caspase6; Col4a3—collagenase 4a3; Cacna2d4—calcium voltage-dependent calcium channel complex α-2/Δ subunit family; Cacng8—calcium voltage-gated channel auxiliary subunit gamma 8; Grm1—glutamate metabotropic receptor 1; Hyal4—hyaluronic acid 4; Ntsr1—neurotensin receptor 1; Nduf7/8: NADH—ubiquinone oxidoreductase (complex I) subunit 7/8; Slit3—slit guidance ligand 3; Scg2—secretogranin II; Slc39a12—solute carrier family 39 member 12; Tnr—tenascin R; Thbs2—thrombospondin 2; Ptn—pleiotrophin; Pfkfb1—6-phosphofructo-2-kinase/fructose-2,6-biphosphatase 1. Data are in fold vs. age-matched Ctrls. Statistical significance: * p < 0.05; ** p < 0.01; *** p < 0.001.
Figure 7
Figure 7
Correlation charts of studied genes in different brain regions of jj and Ctrls rats. The upper-right side shows the correlation coefficient and p-value for each pairwise correlation. The diameter and color depth of the dots were proportional to the R coefficient of correlation, while the color tone indicated if the correlation was positive or negative. The statistical significance of the correlation was indicated as follows: * p < 0.05; ** p < 0.01; *** p < 0.001. Only significant correlations were reported. The order of the genes along the X and Y-axes of each correlogram was automatically clustered depending on the R-values. The corrplots of both Ctrls and jj rats were normalized to P2 Ctrls. Hip—hippocampus; h-Ctx—parietal cortex; f-Ctx—frontal cortex; IC—inferior colliculi; Bmp5—bone morphogenetic protein; Camlg—calcium modulating ligand; Casp6—caspase6; Col4a3—collagenase 4a3; Cacna2d4—calcium voltage-dependent calcium channel complex α-2/Δ subunit family; Cacng8—calcium voltage-gated channel auxiliary subunit gamma 8; Grm1—glutamate metabotropic receptor 1; Hyal4—hyaluronic acid 4; Ntsr1—neurotensin receptor 1; Nduf7/8: NADH—ubiquinone oxidoreductase (complex I) subunit 7/8; Slit3—slit guidance ligand 3; Scg2—secretogranin II; Slc39a12—solute carrier family 39 member 12; Tnr—tenascin R; Thbs2—thrombospondin 2; Ptn—pleiotrophin; Pfkfb1—6-phosphofructo-2-kinase/fructose-2,6-biphosphatase 1. The upper row resumes the biological function of each gene based on GO analysis. RP—repair and plasticity; SSN—synaptogenesis, synaptic activity, and neuronal circuit establishment; MDM—migration, differentiation, and morphogenesis; ECM—extracellular matrix formation; E—energy.
Figure 8
Figure 8
Behavioral tests. White bars: Ctrls; orange bars: hyperbilirubinemic rats. P: postnatal age in days, Ad: adults, from P45 to 1 year old. (a) Righting reflex and (b) negative geotaxis in pups. (c) Rotarod and (d) beam walking tests in adult animals. Statistical significance: * p < 0.05; ** p < 0.01; *** p < 0.001.

Similar articles

Cited by

References

    1. Slusher T.M., Zamora T.G. Burden of Severe Neonatal Jaundice: A Systematic Review and Meta-Analysis. BMJ Paediatr. Open. 2017;1:e000105. doi: 10.1136/bmjpo-2017-000105. - DOI - PMC - PubMed
    1. Jayanti S., Ghersi-Egea J.-F. Severe Neonatal Hyperbilirubinemia and the Brain: The Old but Still Evolving Story. Pediatr. Med. 2021;4:37. doi: 10.21037/pm-21-5. - DOI
    1. Le Pichon J.-B., Riordan S.M. The Neurological Sequelae of Neonatal Hyperbilirubinemia: Definitions, Diagnosis and Treatment of the Kernicterus Spectrum Disorders (KSDs) Curr. Pediatr. Rev. 2017;13:199–209. doi: 10.2174/1573396313666170815100214. - DOI - PubMed
    1. Shapiro S.M. Definition of the Clinical Spectrum of Kernicterus and Bilirubin-Induced Neurologic Dysfunction (BIND) J. Perinatol. 2005;25:54–59. doi: 10.1038/sj.jp.7211157. - DOI - PubMed
    1. Olusanya B.O., Teeple S., Kassebaum N.J. The Contribution of Neonatal Jaundice to Global Child Mortality: Findings from the GBD 2016 Study. Pediatrics. 2018;141:e20171471. doi: 10.1542/peds.2017-1471. - DOI - PubMed

LinkOut - more resources