. 2023 May 24;14(6):1139.
doi: 10.3390/genes14061139.

Complex/cryptic EWSR1::FLI1/ERG Gene Fusions and 1q Jumping Translocation in Pediatric Ewing Sarcomas

Affiliations

Complex/cryptic EWSR1::FLI1/ERG Gene Fusions and 1q Jumping Translocation in Pediatric Ewing Sarcomas

Ying S Zou et al. Genes (Basel). .

Abstract

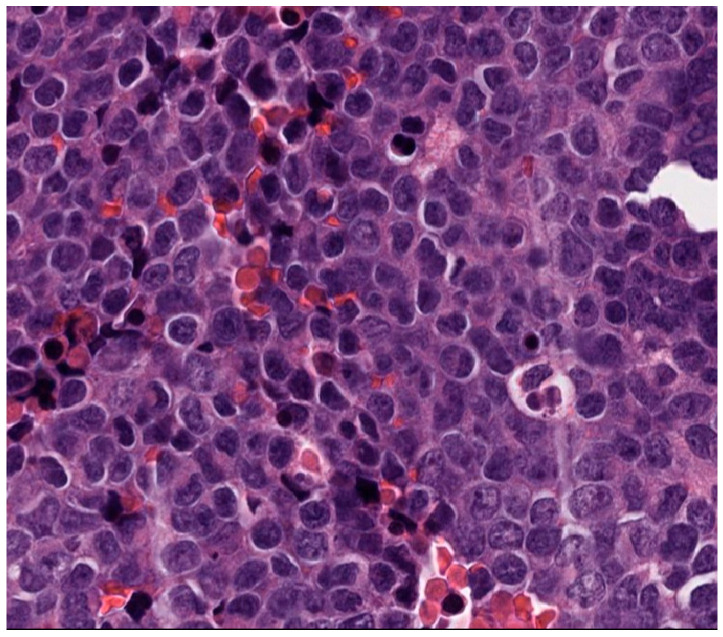
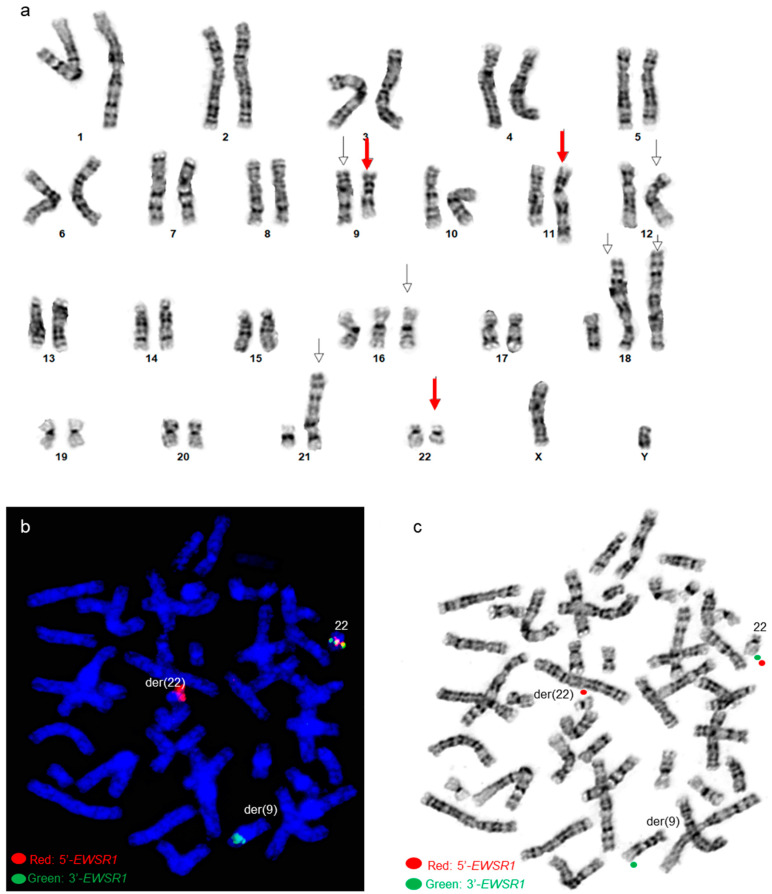
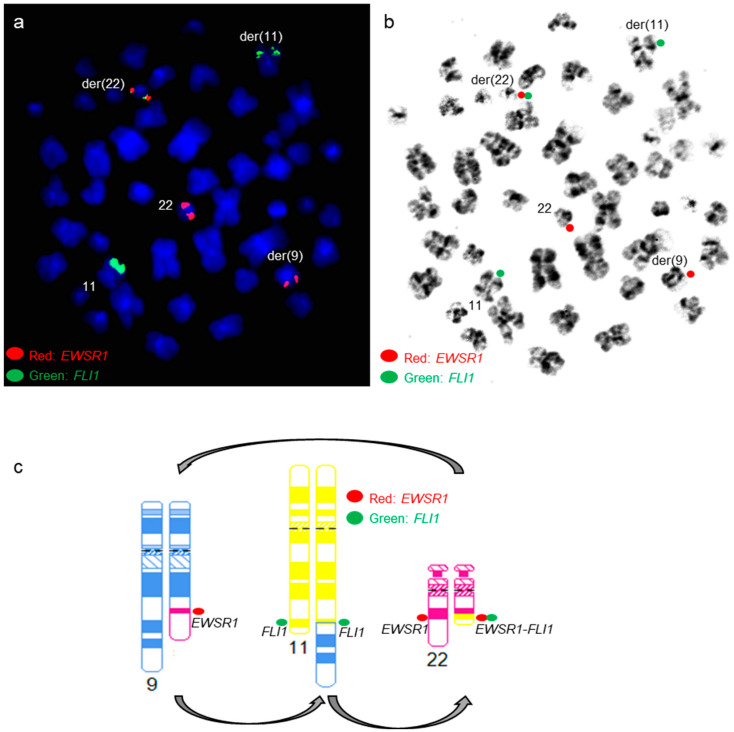
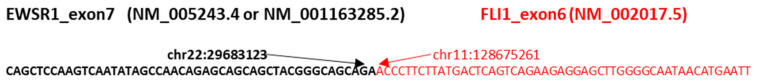
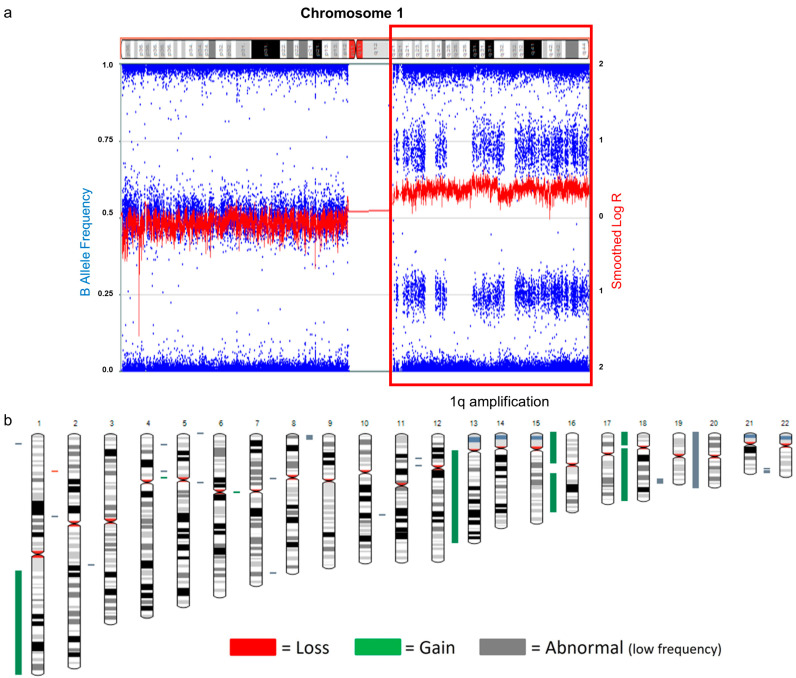
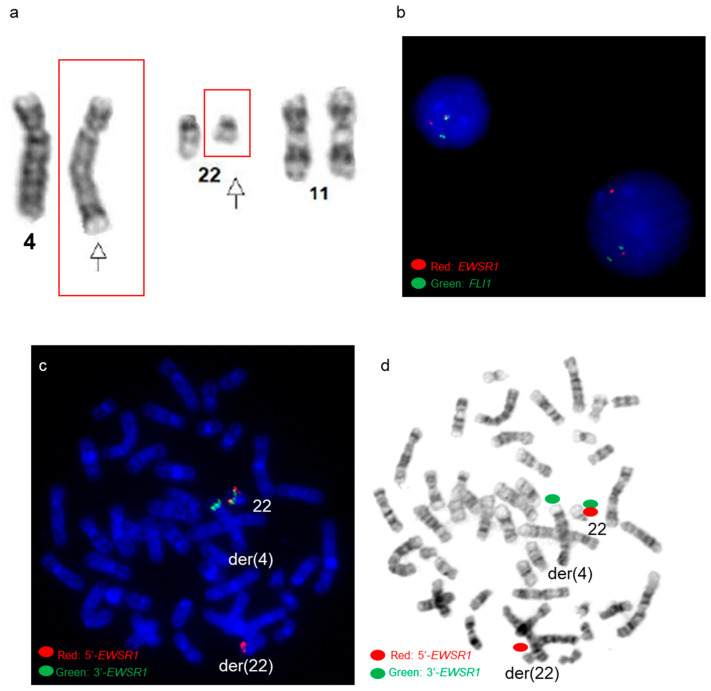
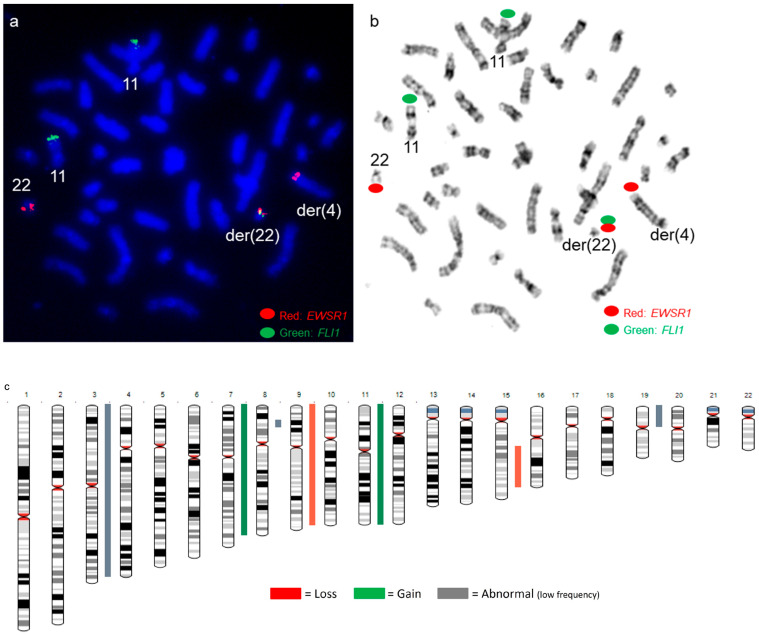
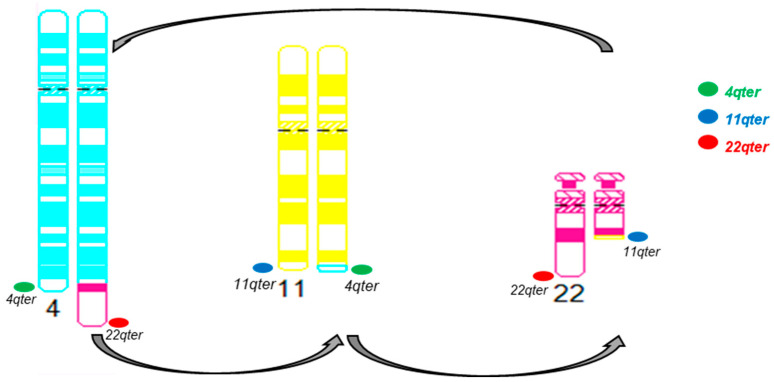
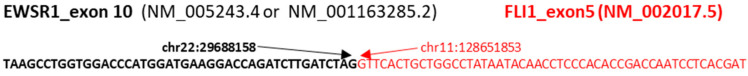
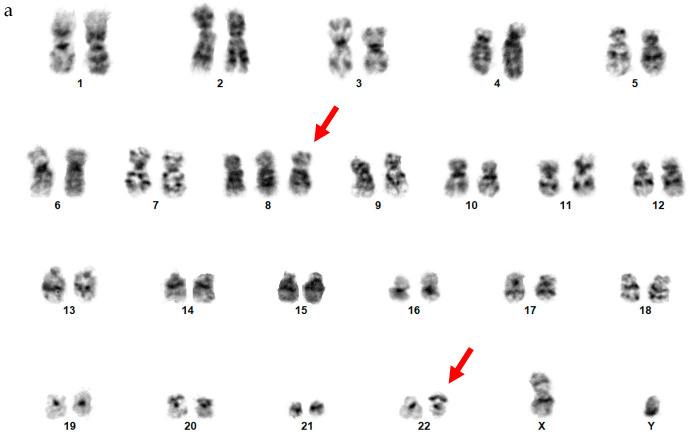
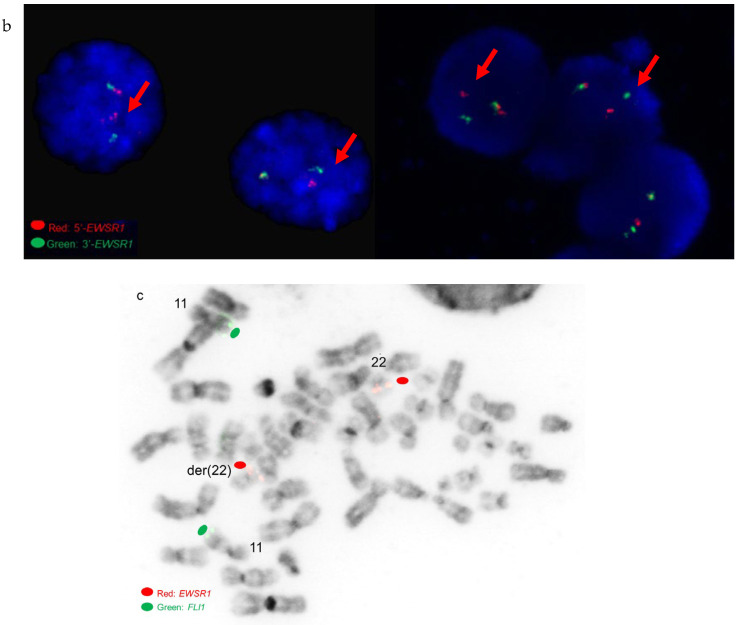
Ewing sarcomas (ES) are rare small round cell sarcomas often affecting children and characterized by gene fusions involving one member of the FET family of genes (usually EWSR1) and a member of the ETS family of transcription factors (usually FLI1 or ERG). The detection of EWSR1 rearrangements has important diagnostic value. Here, we conducted a retrospective review of 218 consecutive pediatric ES at diagnosis and found eight patients having data from chromosome analysis, FISH/microarray, and gene-fusion assay. Three of these eight ES had novel complex/cryptic EWSR1 rearrangements/fusions by chromosome analysis. One case had a t(9;11;22)(q22;q24;q12) three-way translocation involving EWSR1::FLI1 fusion and 1q jumping translocation. Two cases had cryptic EWSR1 rearrangements/fusions, including one case with a cryptic t(4;11;22)(q35;q24;q12) three-way translocation involving EWSR1::FLI1 fusion, and the other had a cryptic EWSR1::ERG rearrangement/fusion on an abnormal chromosome 22. All patients in this study had various aneuploidies with a gain of chromosome 8 (75%), the most common, followed by a gain of chromosomes 20 (50%) and 4 (37.5%), respectively. Recognition of complex and/or cryptic EWSR1 gene rearrangements/fusions and other chromosome abnormalities (such as jumping translocation and aneuploidies) using a combination of various genetic methods is important for accurate diagnosis, prognosis, and treatment outcomes of pediatric ES.

Keywords: 1q jumping translocation; EWSR1::ERG gene fusion; EWSR1::FLI1 gene fusions; Ewing sarcomas; cryptic translocation; three-way translocation.


Conflict of interest statement

The authors declare no conflict of interest.

Figures

Figure 1
Figure 1
Histology of a humerus lesion in patient 3. The histologic evaluation shows monotonous small round blue cells with fine chromatin and scant amphophilic cytoplasm.
Figure 2
Figure 2
Cytogenetic analysis of patient 3 (a) A karyogram of 48,XY, del(9)(q34), t(9;11;22) (q22;q24;q12),add(12)(q24.1),+16,+18,der(18)t(1;18)(q12;p11.3)x2,der(21)t(1;21)(q12;p11.2). Red arrows point to the t(9;11;22) three-way translocation, and other arrows point to other abnormalities (b) Post-G-banded metaphase FISH using EWSR1 break-apart probe shows EWSR1 rearrangements. Green signals correspond to the 3′ portion of the EWSR1 gene on the derivative chromosome 9, and red signals correspond to the 5′ portion of EWSR1 remaining on the derivative 22. (c) EWSR1 FISH signals in the G-banded metaphase cell.
Figure 3
Figure 3
EWSR1::FLI1 FISH analysis in patient 3 (a,b) Metaphase FISH using dual-color dual-fusion EWSR1-FLI1 probe set shows EWSR1::FLI1 fusion on the derivative chromosome 22 involved in the t(9;11;22)(q22;q24;q12) three-way translocation. Green signals are for the FLI1 gene, and red signals are for the EWSR1 gene. (b) FISH signals in the G-banded metaphase cell. (c) Diagrammatic representation of the complex three-way chromosomal rearrangement.
Figure 4
Figure 4
Visualization of the EWSR1::FLI1 fusion identified by the NanoString gene fusion assay in patient 1. The genomic translocation breakpoints were mapped to chr22:29,683, 123 (exon 7) for EWSR1 and chr11:128,675,261 (exon 6) for FLI1.
Figure 5
Figure 5
SNP microarray of patient 3. (a) Gain of 1q (arr[GRCh37] 1q12q44(142,632,577-249,218,992x1, shown in red box) by copy number plot based on LogR signal intensities (red line) and B-allele frequency plots (blue dots). (b) Whole-genome view of SNP microarray data.
Figure 6
Figure 6
Cytogenetic analysis of patient 4 (a) Partial karyogram shows chromosomes 4, 11, and 22. Arrows point to the t(4;22)(q35;q12) reciprocal translocation by chromosome analysis. (b) FISH using EWSR1 break-apart probe shows EWSR1 rearrangements in interphase cells. (c,d) FISH using EWSR1 break-apart probe shows EWSR1 rearrangements in the G-banded metaphase cell. Green signals correspond to the 3′ portion of the EWSR1 gene on the derivative chromosome 4, and red signals correspond to the 5′ portion of EWSR1 remaining on the derivative chromosome 22. (d) EWSR1 FISH signals in the G-banded metaphase cell.
Figure 7
Figure 7
EWSR1::FLI1 FISH and SNP microarray analysis in patient 4 (a,b) Metaphase FISH using dual-color dual-fusion EWSR1-FLI1 probe set shows EWSR1::FLI1 fusion on the derivative chromosome 22 involved in a cryptic t(4;11;22) three-way translocation. Green signals are for the FLI1 gene, and red signals are for the EWSR1 gene. (b) FISH signals in the G-banded metaphase cell. (c) Whole-genome view of SNP microarray data.
Figure 8
Figure 8
Diagrammatic representation of the cryptic three-way translocation by sub-telomere FISH for chromosomes 4qter, 11qter, and 22qter.
Figure 9
Figure 9
Visualization of the EWSR1::FLI1 fusion identified by the NanoString gene fusion assay. The genomic translocation breakpoints were mapped to chr22:29,688,158 (exon 10) for EWSR1 and chr11:128,651,853 (exon 5) for FLI1.
Figure 10
Figure 10
Cytogenetic analysis of patient 8 (a) A karyogram of 47,XY,+8,der(22)add(22) (p11.2)del(22)(q12). Red arrows point to trisomy 8 and the derivative chromosome 22. (b) Interphase FISH using EWSR1 break-apart probe shows EWSR1 rearrangements. Red arrows point to the cells with EWSR1 gene rearrangements. (c) FISH using an EWSR1/FLI1 probe-set shows EWSR1 and FLI1 FISH signals in an inverted 4′,6-diamidino-2-phenylindole (DAPI)-banded metaphase cell.
Figure 10
Figure 10
Cytogenetic analysis of patient 8 (a) A karyogram of 47,XY,+8,der(22)add(22) (p11.2)del(22)(q12). Red arrows point to trisomy 8 and the derivative chromosome 22. (b) Interphase FISH using EWSR1 break-apart probe shows EWSR1 rearrangements. Red arrows point to the cells with EWSR1 gene rearrangements. (c) FISH using an EWSR1/FLI1 probe-set shows EWSR1 and FLI1 FISH signals in an inverted 4′,6-diamidino-2-phenylindole (DAPI)-banded metaphase cell.

References

    1. The WHO Classification of Tumours Editorial Board . WHO Classification of Tumours Soft Tissue and Bone Tumours. 5th ed. IARC Press; Lyon, France: 2020.
    1. Sandberg A.A., Bridge J.A. The Cytogenetics of Bone and Soft Tissue Tumors. R.G.; Austin, TX, USA: Landes, France: 1994. p. 469.
    1. Turc-Carel C., Aurias A., Mugneret F., Lizard S., Sidaner I., Volk C., Thiery J.P., Olschwang S., Philip I., Berger M.P., et al. Chromosomes in Ewing’s sarcoma. I. An evaluation of 85 cases of remarkable consistency of t(11;22)(q24;q12) Cancer Genet. Cytogenet. 1988;32:229–238. doi: 10.1016/0165-4608(88)90285-3. - DOI - PubMed
    1. Delattre O., Zucman J., Melot T., Garau X.S., Zucker J.-M., Lenoir G.M., Ambros P.F., Sheer D., Turc-Carel C., Triche T.J., et al. The Ewing Family of Tumors—A Subgroup of Small-Round-Cell Tumors Defined by Specific Chimeric Transcripts. N. Engl. J. Med. 1994;331:294–299. doi: 10.1056/NEJM199408043310503. - DOI - PubMed
    1. Ohno T., Rao V.N., Reddy E.S. EWS/Fli-1 chimeric protein is a transcriptional activator. Cancer Res. 1993;53:5859–5863. - PubMed

Publication types