. 2023 Jun 9;14(6):1239.
doi: 10.3390/genes14061239.

Determination of Effect Sizes for Power Analysis for Microbiome Studies Using Large Microbiome Databases

Affiliations

Determination of Effect Sizes for Power Analysis for Microbiome Studies Using Large Microbiome Databases

Gibraan Rahman et al. Genes (Basel). .

Abstract

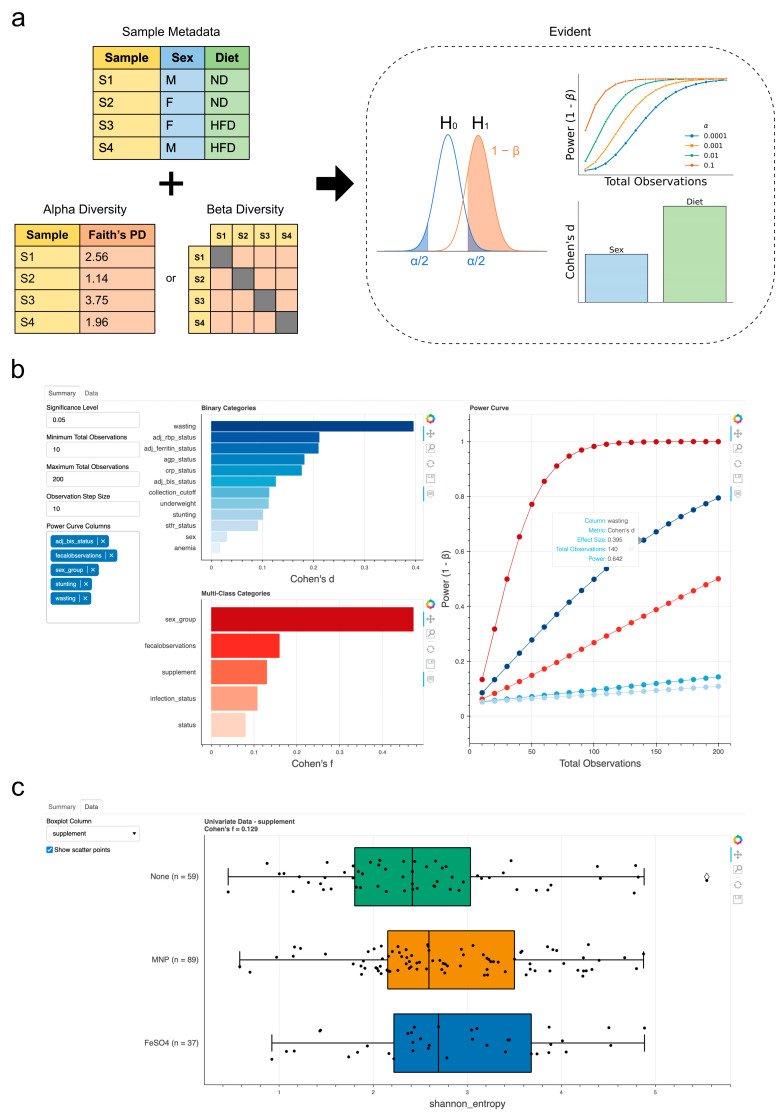
Herein, we present a tool called Evident that can be used for deriving effect sizes for a broad spectrum of metadata variables, such as mode of birth, antibiotics, socioeconomics, etc., to provide power calculations for a new study. Evident can be used to mine existing databases of large microbiome studies (such as the American Gut Project, FINRISK, and TEDDY) to analyze the effect sizes for planning future microbiome studies via power analysis. For each metavariable, the Evident software is flexible to compute effect sizes for many commonly used measures of microbiome analyses, including α diversity, β diversity, and log-ratio analysis. In this work, we describe why effect size and power analysis are necessary for computational microbiome analysis and show how Evident can help researchers perform these procedures. Additionally, we describe how Evident is easy for researchers to use and provide an example of efficient analyses using a dataset of thousands of samples and dozens of metadata categories.

Keywords: bioinformatics; effect size; microbiome; statistics.


Conflict of interest statement

The authors declare no conflict of interest.

Figures

Figure 1
Figure 1
Evident workflow and interactive visualizations. (a) Graphical overview of Evident usage. Sample metadata with categorical groups are used to determine differences among samples. Effect size calculation can be performed and used to generate power curves (in this example using classification status from [7]) at multiple statistical significance levels and sample sizes. (b,c) Screenshots of the interactive webpage for a dynamic exploration of effect sizes and power analysis. Summarized effect sizes of all columns can be used to inform interactive power analysis on multiple groups (b). The underlying grouped data can be visualized with boxplots and, optionally, the raw data as scatter plots (c). The data shown are from McClorry et al. (Qiita study ID: 11402) [9].
Figure 2
Figure 2
Analysis of American Gut Project data. (a) Top 10 binary categories by group-wise effect size. (b) Two-sample independent t-test power analysis of selected binary category effect sizes for a significance level of 0.05. (c) Top 10 multi-class categories by group-wise effect size. (d) One-way ANOVA F-test power analysis of selected multi-class category effect sizes at a significance level of 0.05. (e) Distributions of within-group pairwise UniFrac distances for highest effect size binary category (top) and multi-class category (bottom). (f) Comparison of pairwise effect sizes between reprocessed data from redbiom and published effect sizes from McDonald et al. Reprocessing results are not identical due to inherent randomness in rarefaction. (g) Boxplot of differences in effect sizes between published and reprocessed effect sizes.

References

    1. Sullivan G.M., Feinn R. Using Effect Size—Or Why the P Value Is Not Enough. J. Grad. Med. Educ. 2012;4:279–282. doi: 10.4300/JGME-D-12-00156.1. - DOI - PMC - PubMed
    1. Baguley T. Standardized or simple effect size: What should be reported? Br. J. Psychol. 2009;100:603–617. doi: 10.1348/000712608X377117. - DOI - PubMed
    1. Cohen J. Statistical Power Analysis. Curr. Dir. Psychol. Sci. 1992;1:98–101. doi: 10.1111/1467-8721.ep10768783. - DOI
    1. McDonald D., Hyde E., Debelius J.W., Morton J.T., Gonzalez A., Ackermann G., Alexander A. American Gut: An Open Platform for Citizen Science Microbiome Research. mSystems. 2018;3:e00031-18. doi: 10.1128/mSystems.00031-18. - DOI - PMC - PubMed
    1. TEDDY Study Group The Environmental Determinants of Diabetes in the Young (TEDDY) Study. Ann. N. Y. Acad. Sci. 2008;1150:1–13. doi: 10.1196/annals.1447.062. - DOI - PMC - PubMed

Publication types