

Differences in the Functional Traits of Populus pruinosa Leaves in Different Developmental Stages
- PMID: 37375887
- PMCID: PMC10304746
- DOI: 10.3390/plants12122262
Differences in the Functional Traits of Populus pruinosa Leaves in Different Developmental Stages
Abstract
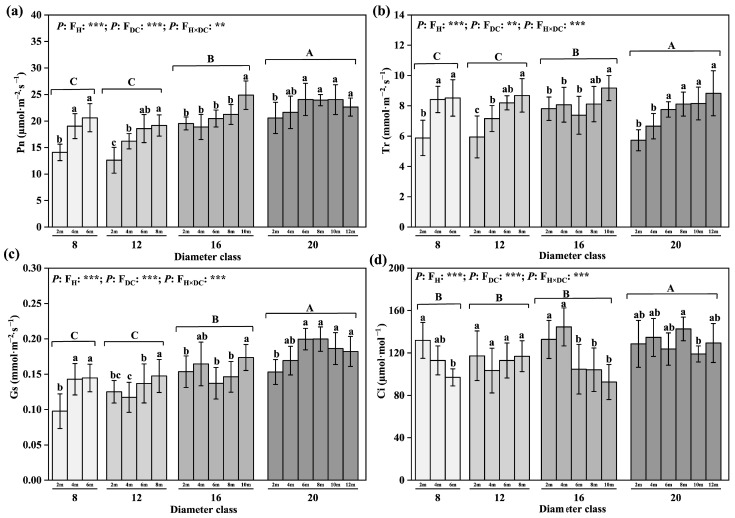
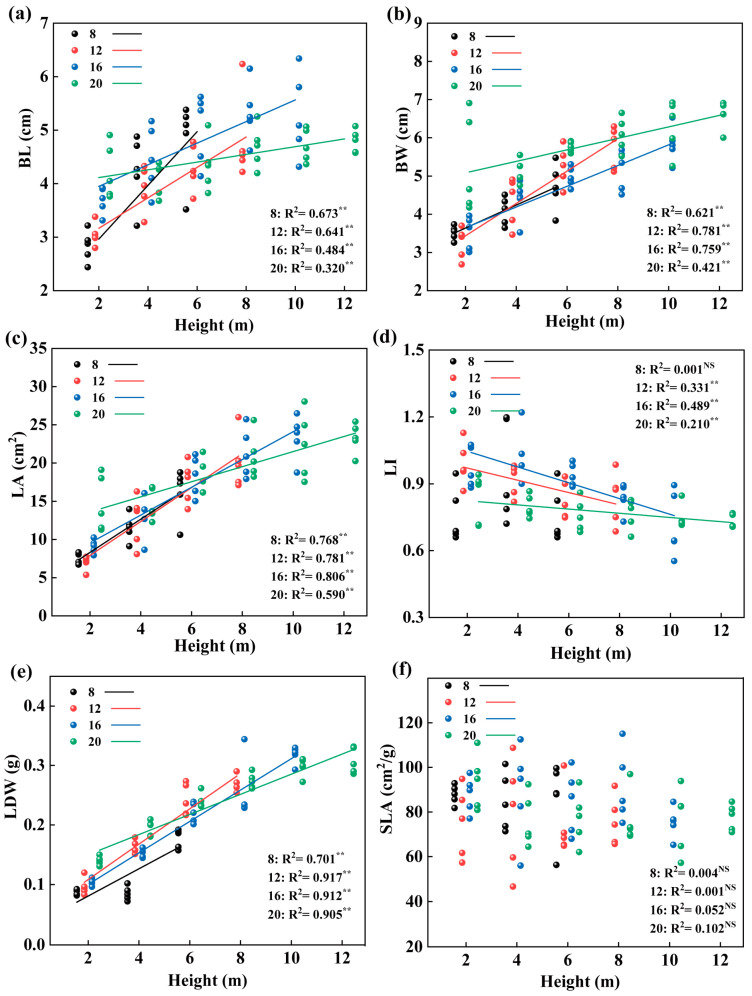
Populus pruinosa Schrenk has the biological characteristics of heteromorphic leaves and is a pioneer species for wind prevention and sand fixation. The functions of heteromorphic leaves at different developmental stages and canopy heights of P. pruinosa are unclear. To clarify how developmental stages and canopy height affect the functional characteristics of leaves, this study evaluated the morphological anatomical structures and the physiological indicators of leaves at 2, 4, 6, 8, 10, and 12 m. The relationships of functional traits to the developmental stages and canopy heights of leaves were also analyzed. The results showed that blade length (BL), blade width (BW), leaf area (LA), leaf dry weight (LDW), leaf thickness (LT), palisade tissue thickness (PT), net photosynthetic rate (Pn), stomatal conductance (Gs), proline (Pro), and malondialdehyde (MDA) content increased with progressing developmental stages. BL, BW, LA, leaf dry weight, LT, PT, Pn, Gs, Pro, and the contents of MDA, indoleacetic acid, and zeatin riboside had significant positive correlations with canopy heights of leaves and their developmental stages. The morphological structures and physiological characteristics of P. pruinosa leaves showed more evident xeric structural characteristics and higher photosynthetic capacity with increasing canopy height and progressive developmental stages. Resource utilization efficiency and the defense ability against environmental stresses were improved through mutual regulation of each functional trait.
Keywords: Populus pruinosa; canopy height; developmental stage; functional traits; leaf.
Conflict of interest statement
The authors declare that this research was conducted in the absence of any commercial or financial relationship that could be construed as a potential conflict of interest.
Figures


Similar articles
-
Morphological, structural and physiological differences in heteromorphic leaves of Euphrates poplar during development stages and at crown scales.Plant Biol (Stuttg). 2020 May;22(3):366-375. doi: 10.1111/plb.13078. Epub 2020 Jan 5. Plant Biol (Stuttg). 2020. PMID: 31793152 Free PMC article.
-
Structural and Functional Responses of the Heteromorphic Leaves of Different Tree Heights on Populus euphratica Oliv. to Different Soil Moisture Conditions.Plants (Basel). 2022 Sep 12;11(18):2376. doi: 10.3390/plants11182376. Plants (Basel). 2022. PMID: 36145777 Free PMC article.
-
Effects of light environments within Cinnamomum camphora canopy on leaf functional traits and photosynthetic characteristics.Ying Yong Sheng Tai Xue Bao. 2023 Aug;34(8):2113-2122. doi: 10.13287/j.1001-9332.202308.027. Ying Yong Sheng Tai Xue Bao. 2023. PMID: 37681375 English.
-
Variation in leaf photosynthetic capacity within plant canopies: optimization, structural, and physiological constraints and inefficiencies.Photosynth Res. 2023 Nov;158(2):131-149. doi: 10.1007/s11120-023-01043-9. Epub 2023 Aug 24. Photosynth Res. 2023. PMID: 37615905 Review.
-
Progress in studying heteromorphic leaves in Populus euphratica: leaf morphology, anatomical structure, development regulation and their ecological adaptation to arid environments.Plant Signal Behav. 2021 Apr 3;16(4):1870842. doi: 10.1080/15592324.2020.1870842. Epub 2021 Jan 11. Plant Signal Behav. 2021. PMID: 33427562 Free PMC article. Review.
Cited by
-
The Identification and Characterization of the PeGRF Gene Family in Populus euphratica Oliv. Heteromorphic Leaves Provide a Theoretical Basis for the Functional Study of PeGRF9.Int J Mol Sci. 2024 Dec 25;26(1):66. doi: 10.3390/ijms26010066. Int J Mol Sci. 2024. PMID: 39795925 Free PMC article.
References
-
- White T.L., Adams W.T., Neale D.B. Forest Genetics. CAB International; Cambridge, UK: 2007.
-
- Reich P.B., Wright I.J., Cavender-Bares J., Craine J.M., Oleksyn J., Westoby M., Walters M.B. The evolution of plant functional variation: Traits, spectra, and strategies. Int. J. Plant. Sci. 2003;164:143–164. doi: 10.1086/374368. - DOI
-
- Meng T., Ni J., Wang G. Plant functional traits and environmental and ecosystem functions. J. Plant Ecol. 2007;31:150–165.
-
- Liu X., Ma K. Advances in plant functional traits. Life Sci. 2015;45:325–339.
Grants and funding
LinkOut - more resources
Full Text Sources
