. 2023 Jun 16;12(12):2344.
doi: 10.3390/plants12122344.

Genome-Wide Association Study of Seed Morphology Traits in Senegalese Sorghum Cultivars

Affiliations

Genome-Wide Association Study of Seed Morphology Traits in Senegalese Sorghum Cultivars

Ezekiel Ahn et al. Plants (Basel). .

Abstract

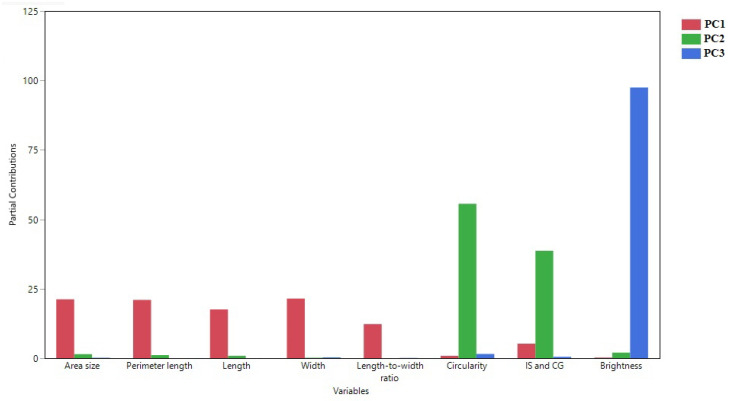
Sorghum is considered the fifth most important crop in the world. Despite the potential value of Senegalese germplasm for various traits, such as resistance to fungal diseases, there is limited information on the study of sorghum seed morphology. In this study, 162 Senegalese germplasms were evaluated for seed area size, length, width, length-to-width ratio, perimeter, circularity, the distance between the intersection of length & width (IS) and center of gravity (CG), and seed darkness and brightness by scanning and analyzing morphology-related traits with SmartGrain software at the USDA-ARS Plant Science Research Unit. Correlations between seed morphology-related traits and traits associated with anthracnose and head smut resistance were analyzed. Lastly, genome-wide association studies were performed on phenotypic data collected from over 16,000 seeds and 193,727 publicly available single nucleotide polymorphisms (SNPs). Several significant SNPs were found and mapped to the reference sorghum genome to uncover multiple candidate genes potentially associated with seed morphology. The results indicate clear correlations among seed morphology-related traits and potential associations between seed morphology and the defense response of sorghum. GWAS analysis listed candidate genes associated with seed morphologies that can be used for sorghum breeding in the future.

Keywords: GWAS; area size; circularity; morphology; seed; seed color; sorghum.


Conflict of interest statement

The authors declare that they have no known competing financial interest or personal relationship that could have influenced the work reported in this paper.

Figures

Figure 1
Figure 1
Histograms for distribution in Senegalese cultivars regarding seed morphologies. (a) Area size (mm2), (b) perimeter (mm), (c) length (mm), (d) width (mm), (e) length-to-width ratio, (f) circularity (0–1 range), (g) distance between IS and CG (mm) and (h) brightness (0–255 range). Box plots above each histogram indicated mean value (diamond), percentiles, upper and lower whisker, and outliers. Median ranges are shown in red.
Figure 2
Figure 2
A comparison of the area sizes for PI514293 vs. PI514404. (a) PI514293 has one of the smallest seeds in area size. (b) PI514404 showed one of the largest seeds in the population. The scale bar indicates 1 cm applied to both (a,b).
Figure 3
Figure 3
A comparison of the seed colors for PI514471 vs. PI514419. (a) PI514471 has one of the darkest seeds among the screened cultivars. (b) PI514471 showed one of the brightest seeds in the population. The scale bar indicates 1 cm applied to both (a,b).
Figure 4
Figure 4
Scatter plots visualizing correlations between evaluated traits based on Pearson’s r. Each dot indicates a sorghum accession and red lines indicate correlations between two traits.
Figure 5
Figure 5
The principal component analysis of eight seed morphological parameters was from the Senegalese sorghum germplasms (162 Senegalese and 3 control cultivars). PC1 vs. PC2 are shown. Red arrows indicate directions for the traits on the PCA plot.
Figure 6
Figure 6
The plot of the partial contribution of variables for eight traits. Principal component analysis from Senegalese sorghum cultivars of eight seed morphological parameters. Contributions of each trait toward PC1, PC2, and PC3 are shown.
Figure 7
Figure 7
The plots of correlations between head smut spot appearance rate (%) and seed morphology-related traits. (a) Head smut spot appearance rate (%) and circularity showed a moderate negative correlation (Pearson’s correlation = −0.47, p < 0.0001). (b) Head smut spot appearance rate (%) and distance between IS and CG showed a moderate positive correlation (Pearson’s correlation = 0.31, p < 0.0001). Each dot indicates a sorghum accession; blue lines indicate correlations between the two traits.
Figure 8
Figure 8
The population structure of the Senegalese sorghum panel. (a) k-means clustering by average silhouette method for genotype data of accessions analyzed in this study. The optimal number of k-means clusters was equal to 2, indicative of 2 major genetic groups. (b) An admixture plot displays 2 groups with most accessions falling in just one group. Two different colors indicate two different populations across the accessions.
Figure 9
Figure 9
A dendrogram generated from genotype data of the accessions analyzed in this study. There are 2 major genetic groups, indicated by the two main branches, with that majority of the accessions falling in the top branch, which could potentially contain numerous subpopulations.
Figure 10
Figure 10
The genome-wide association for Senegalese sorghum seed morphology-related traits. Manhattan plots based on univariate and multivariate GWAS display the top candidate SNPs associated with each trait (a) Manhattan plot for area size. (b) Manhattan plot for perimeter (c) Manhattan plot for width. (d) Manhattan plot of PCs based on seven seed size-related traits. (e) Manhattan plot of seed brightness. The line is a cut-off for the Bonferroni threshold ≈ 0.00000017.
Figure 11
Figure 11
LD heatmaps visualize LD of regions around statistically significant SNP loci. (a) Variant S6_12058855 was associated with seed area. (b) Variant S6_39973848 was associated with seed perimeter. The blue stars indicate locations of the SNP loci.

References

    1. Arouna N., Gabriele M., Pucci L. The Impact of Germination on Sorghum Nutraceutical Properties. Foods. 2020;9:1218. doi: 10.3390/foods9091218. - DOI - PMC - PubMed
    1. Frankowski J., Przybylska-Balcerek A., Stuper-Szablewska K. Concentration of Pro-Health Compound of Sorghum Grain-Based Foods. Foods. 2022;11:216. doi: 10.3390/foods11020216. - DOI - PMC - PubMed
    1. Adebo O.A. African Sorghum-Based Fermented Foods: Past, Current and Future Prospects. Nutrients. 2020;12:1111. doi: 10.3390/nu12041111. - DOI - PMC - PubMed
    1. Mural R.V., Sun G., Grzybowski M., Tross M.C., Jin H., Smith C., Newton L., Andorf C.M., Woodhouse M.R., Thompson A.M., et al. Association Mapping across a Multitude of Traits Collected in Diverse Environments in Maize. GigaScience. 2022;11:giac080. doi: 10.1093/gigascience/giac080. - DOI - PMC - PubMed
    1. Cuevas H.E., Prom L.K., Rosa-Valentin G. Population Structure of the NPGS Senegalese Sorghum Collection and Its Evaluation to Identify New Disease Resistant Genes. PLoS ONE. 2018;13:e0191877. doi: 10.1371/journal.pone.0191877. - DOI - PMC - PubMed

LinkOut - more resources