. 2023 Jun 14;15(6):1731.
doi: 10.3390/pharmaceutics15061731.

New Ruthenium-Cyclopentadienyl Complexes Affect Colorectal Cancer Hallmarks Showing High Therapeutic Potential

Affiliations

New Ruthenium-Cyclopentadienyl Complexes Affect Colorectal Cancer Hallmarks Showing High Therapeutic Potential

Ana Rita Brás et al. Pharmaceutics. .

Abstract

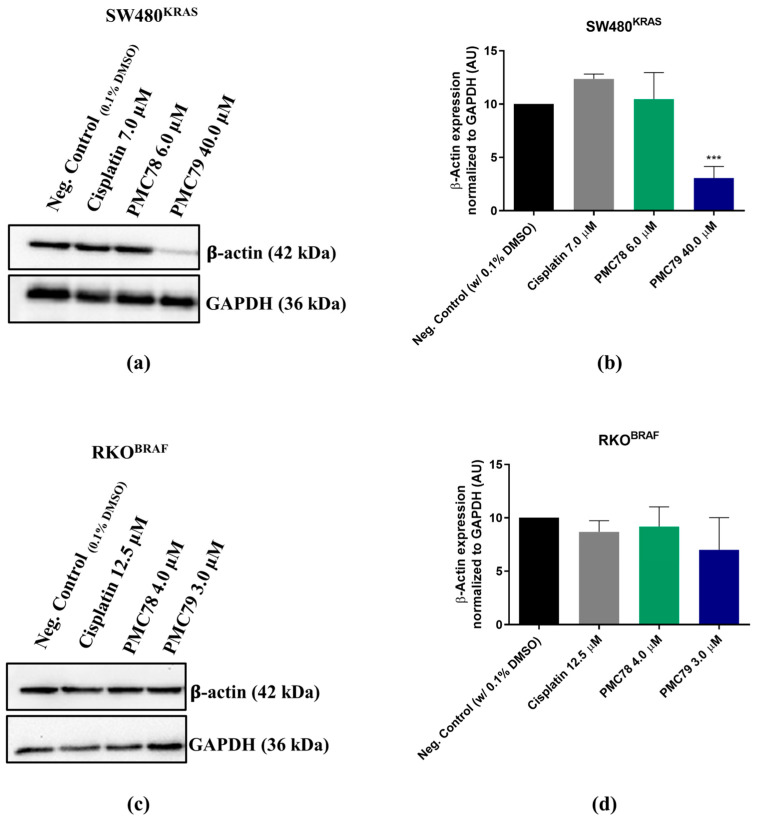
Colorectal cancer (CRC) is among the most deadly cancers worldwide. Current therapeutic strategies have low success rates and several side effects. This relevant clinical problem requires the discovery of new and more effective therapeutic alternatives. Ruthenium drugs have arisen as one of the most promising metallodrugs, due to their high selectivity to cancer cells. In this work we studied, for the first time, the anticancer properties and mechanisms of action of four lead Ru-cyclopentadienyl compounds, namely PMC79, PMC78, LCR134 and LCR220, in two CRC-derived cell lines (SW480 and RKO). Biological assays were performed on these CRC cell lines to evaluate cellular distribution, colony formation, cell cycle, proliferation, apoptosis, and motility, as well as cytoskeleton and mitochondrial alterations. Our results show that all the compounds displayed high bioactivity and selectivity, as shown by low half-maximal inhibitory concentrations (IC50) against CRC cells. We observed that all the Ru compounds have different intracellular distributions. In addition, they inhibit to a high extent the proliferation of CRC cells by decreasing clonogenic ability and inducing cell cycle arrest. PMC79, LCR134, and LCR220 also induce apoptosis, increase the levels of reactive oxygen species, lead to mitochondrial dysfunction, induce actin cytoskeleton alterations, and inhibit cellular motility. A proteomic study revealed that these compounds cause modifications in several cellular proteins associated with the phenotypic alterations observed. Overall, we demonstrate that Ru compounds, especially PMC79 and LCR220, display promising anticancer activity in CRC cells with a high potential to be used as new metallodrugs for CRC therapy.

Keywords: active targeting; colorectal cancer; passive targeting; ruthenium-cyclopentadienyl compounds.


Conflict of interest statement

The authors declare no conflict of interest.

Figures

Figure A1
Figure A1
Dose–response curve of cell viability in SW480, RKO, and NCM460 cell lines for determination of IC50 using SRB after 48 h of incubation with Ru compounds.
Figure A2
Figure A2
Dose–response curve of cell viability in NCM460 cell lines for determination of IC50 using SRB after 48 h of incubation with cisplatin.
Figure A3
Figure A3
Representative histograms of CFSE staining in SW480 (a) and RKO (b) cell lines after 48 h of incubation with the lowest concentration of all compounds.
Figure A4
Figure A4
Representative histograms of cell-cycle phases distribution after PI staining in SW480 (a) and RKO (b) cell lines after 48 h of incubation with all compounds.
Figure A5
Figure A5
Evaluation of the type of cell death induced by lower concentrations of Ru compounds in SW480 (a) and RKO (b) cells. Analysis of % of apoptotic cells (AV+PI− and AV+PI+) vs necrotic cells (AV−PI+) in SW480 (c) and RKO (d) cells. Values represent mean ± SD of at least three independent experiments. * p ≤ 0.05, ** p ≤ 0.01, and **** p ≤ 0.0001 compared to negative control (0.1% DMSO).
Figure A6
Figure A6
Evaluation of mitochondrial mass alterations induced by Ru compounds at 24 h in SW480 (a) and RKO (b) cells. Values represent mean ± SD of at least three independent experiments. **** p ≤ 0.0001 compared to negative control (0.1% DMSO). ### p ≤ 0.001 compared to negative control (H2O).
Figure A7
Figure A7
LCR134 and LCR220 compounds affect the actin cytoskeleton of SW480 cancer cells. Representative images (×600) of DAPI (4′,6diamidino-2-phenylindole), Phalloidin-AlexaFluor® 568, and their merger were obtained using fluorescence microscopy. The results were obtained from at least three independent experiments. Scale bar for all images is 20 μm.
Figure A8
Figure A8
LCR134 and LCR220 compounds affect the actin cytoskeleton of RKO cancer cells. Representative images (×600) of DAPI (4′,6diamidino-2-phenylindole), Phalloidin-AlexaFluor® 568, and their merger were obtained using fluorescence microscopy. The results were obtained from at least three independent experiments. Scale bar for all images is 20 μm.
Figure A9
Figure A9
LCR134 and LCR220 do not affect the levels of β-actin in SW480 and RKO cell lines. Representative blots of β-actin expression for SW480 (a) and RKO (c) and analysis of quantification (b,d). Data are presented as mean ± SD from at least three independent experiments.
Figure 1
Figure 1
Chemical structure of TM34.
Figure 2
Figure 2
Chemical structures of RuCp compounds PMC79, PMC78, LCR134, and LCR220.
Figure 3
Figure 3
Cellular distribution of Ru compounds in SW480 (a) and RKO (b) cell lines. Data are presented as mean ± SD of two independent experiments.
Figure 4
Figure 4
Clonogenic ability of SW480 (a) and RKO (b) cell lines treated with Ru compounds. Representative images of colony formation in RKO (c) cells after incubation with the lowest concentration of Ru compounds. Data are presented as mean ± SD from at least three independent experiments. *** p ≤ 0.001 and **** p ≤ 0.0001 compared to negative control (0.1% DMSO). ### p ≤ 0.001 and #### p ≤ 0.0001 compared to negative control (H2O).
Figure 5
Figure 5
Assessment of Ru compounds proliferation effect in SW480 (a) and RKO (b) cell lines after 24 h and 48 h of incubation with Ru compounds. Data are presented as mean ± SD from at least three independent experiments. * p ≤ 0.05, ** p ≤ 0.01, *** p ≤ 0.001, and **** p ≤ 0.0001 compared to negative control (0.1% DMSO).
Figure 6
Figure 6
Cell-cycle phases distribution analysis using flow cytometry, after 24 h and 48 h of incubation with Ru compounds, in SW480 (a) and RKO (b) cell lines. Data are presented as mean ± SD from at least three independent experiments. * p ≤ 0.05, ** p ≤ 0.01, *** p ≤ 0.001, and **** p ≤ 0.0001 compared to negative control (0.1% DMSO).
Figure 7
Figure 7
Assessment of DNA strand breaks induced by Ru compounds in SW480 (a) and RKO (c) cells using a TUNEL assay. Representative images of SW480 cells (b) (×600). DAPI (40,6-diamidino-2-phenylindole), FITC (fluorescein isothiocyanate), and their merger were obtained with fluorescence microscopy. Values represent mean ± SD of at least three independent experiments. ** p ≤ 0.01, *** p ≤ 0.001, and **** p ≤ 0.0001 compared to negative control (0.1% DMSO). ## p ≤ 0.01 and ### p ≤ 0.001 compared to negative control (H2O). Scale bar is 120 μm.
Figure 8
Figure 8
Evaluation of the type of cell death induced by higher concentrations of Ru compounds in SW480 (a) and RKO (b) cells. Analysis of % of apoptotic cells (AV+PI− and AV+PI+) vs necrotic cells (AV-PI+) in SW480 (c) and RKO (d) cells. Values represent mean ± SD of at least three independent experiments. * p ≤ 0.05, ** p ≤ 0.01, *** p ≤ 0.001, and **** p ≤ 0.0001 compared to negative control (0.1% DMSO). #### p ≤ 0.0001 compared to negative control (H2O).
Figure 9
Figure 9
Evaluation of ROS production induced by Ru compounds in SW480 cells (a). Representative histograms of PMC79 in SW480 (b). Values represent mean ± SD of at least three independent experiments. * p ≤ 0.05, ** p ≤ 0.01, and **** p ≤ 0.0001 compared to negative control (0.1% DMSO). #### p ≤ 0.0001 compared to negative control (H2O).
Figure 10
Figure 10
Evaluation of ROS production induced by Ru compounds in RKO cells (a). Representative histograms of LCR220 in RKO (b). Values represent mean ± SD of at least three independent experiments. ** p ≤ 0.01, *** p ≤ 0.001, and **** p ≤ 0.0001 compared to negative control (0.1% DMSO). ### p ≤ 0.001 and #### p ≤ 0.0001 compared to negative control (H2O).
Figure 11
Figure 11
Ru compounds increase mitochondrial mass in SW480 (a) and RKO (b) cells at 48 h. Representative histograms of LCR220 in RKO (c). Values represent mean ± SD of at least three independent experiments. ** p ≤ 0.01, *** p ≤ 0.001, and **** p ≤ 0.0001 compared to negative control (0.1% DMSO). #### p ≤ 0.0001 compared to negative control (H2O).
Figure 12
Figure 12
Ru compounds induce alterations in mitochondrial membrane potential in SW480 (a) and RKO (b) cells. Values represent mean ± SD of at least three independent experiments. * p ≤ 0.05, ** p ≤ 0.01, and *** p ≤ 0.001 compared to negative control (0.1% DMSO). ## p ≤ 0.01 compared to negative control (H2O).
Figure 13
Figure 13
Ru compounds affect the actin cytoskeleton of SW480 cells. Representative images (×600) of DAPI (4′,6diamidino-2-phenylindole), Phalloidin-AlexaFluor® 568, and their merger were obtained with confocal microscopy. The results were obtained from at least three independent experiments. Scale bar for images is 120 μm.
Figure 14
Figure 14
Ru compounds affect the actin cytoskeleton of RKO cells. Representative images (×600) of DAPI (4′,6diamidino-2-phenylindole), Phalloidin-AlexaFluor® 568, and their merger were obtained with confocal microscopy. The results were obtained from at least three independent experiments. Scale bar for images is 120 μm.
Figure 15
Figure 15
PMC79 decreases the levels of β-actin in SW480. Representative blots of β-actin expression for SW480 (a) and RKO (c), and analysis of quantification (b,d). Data are presented as mean ± SD from at least three independent experiments. *** p ≤ 0.001 compared to negative control (0.1% DMSO).
Figure 16
Figure 16
Evaluation of Ru compounds effect on cellular motility in SW480 (a) and RKO (c) cell lines after 12 h of incubation with Ru compounds. Representative images (×100) of the highest dose of PMC79 in SW480 (b) and LCR220 in RKO (d) cell lines. Data are presented as mean ± SD from at least three independent experiments. * p ≤ 0.05 and *** p ≤ 0.001 compared to negative control (0.1% DMSO). ## p ≤ 0.01 compared to negative control (H2O). Scale bar for all images is 200 μm.
Figure 17
Figure 17
Analysis of cellular proteome alterations induced by Ru compounds in SW480 CRC cell line. (a) Protein abundance alterations in SW480 cells treated with PMC79, PMC78, LCR134, and LCR220. (b) Gene ontology enrichment analysis of PMC79 and LCR134 compounds in SW480 cells.

Similar articles

Cited by

References

    1. Sung H., Ferlay J., Siegel R.L., Laversanne M., Soerjomataram I., Jemal A., Bray F. Global Cancer Statistics 2020: GLOBOCAN Estimates of Incidence and Mortality Worldwide for 36 Cancers in 185 Countries. CA Cancer J. Clin. 2021;71:209–249. doi: 10.3322/caac.21660. - DOI - PubMed
    1. Arnold M., Sierra M.S., Laversanne M., Soerjomataram I., Jemal A., Bray F. Global patterns and trends in colorectal cancer incidence and mortality. Gut. 2017;66:683–691. doi: 10.1136/gutjnl-2015-310912. - DOI - PubMed
    1. Van Cutsem E., Cervantes A., Adam R., Sobrero A., van Krieken J.H., Aderka D., Aguilar E.A., Bardelli A., Benson A., Bodoky G., et al. ESMO consensus guidelines for the management of patients with metastatic colorectal cancer. Ann. Oncol. 2016;27:1386–1422. doi: 10.1093/annonc/mdw235. - DOI - PubMed
    1. Pardini B., Kumar R., Naccarati A., Novotny J., Prasad R.B., Forsti A., Hemminki K., Vodicka P., Bermejo J.L. 5-Fluorouracil-based chemotherapy for colorectal cancer and MTHFR/MTRR genotypes. Br. J. Clin. Pharmacol. 2011;72:162–163. doi: 10.1111/j.1365-2125.2010.03892.x. - DOI - PMC - PubMed
    1. Cazzanelli G., Moreira T., Ferro S., Azevedo-Silva J., Nogueira E., Preto A. Frontiers in Anti-Cancer Drug Discovery. Bentham Books; Sharjah, UAE: 2016. Colorectal Cancer Therapeutic Approaches: From Classical Drugs to New Nanoparticles.