. 2023 May 31;15(6):1307.
doi: 10.3390/v15061307.

Tumour Necrosis Factor-α, Chemokines, and Leukocyte Infiltrate Are Biomarkers for Pathology in the Brains of Venezuelan Equine Encephalitis (VEEV)-Infected Mice

Affiliations

Tumour Necrosis Factor-α, Chemokines, and Leukocyte Infiltrate Are Biomarkers for Pathology in the Brains of Venezuelan Equine Encephalitis (VEEV)-Infected Mice

Amanda L Phelps et al. Viruses. .

Abstract

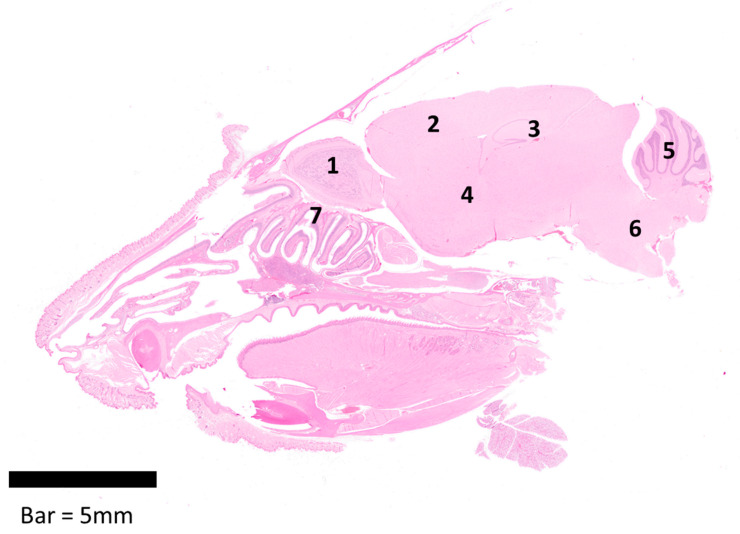
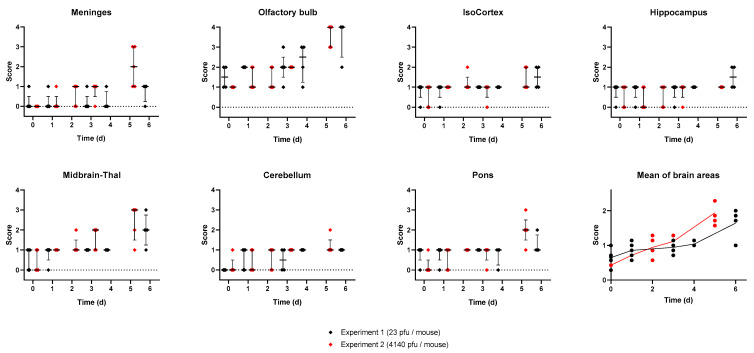
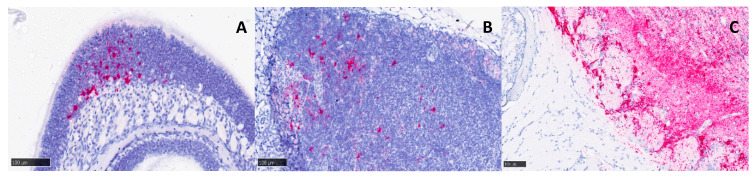
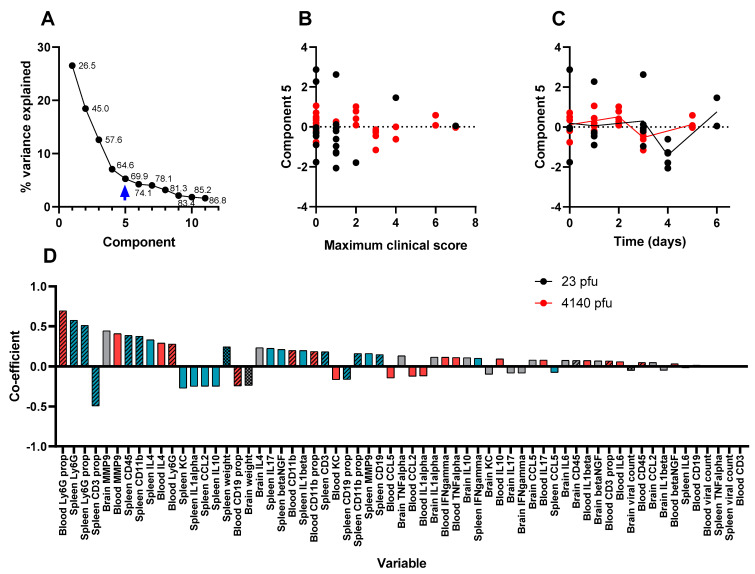
Venezuelan equine encephalitis virus (VEEV) is a disease typically confined to South and Central America, whereby human disease is characterised by a transient systemic infection and occasionally severe encephalitis, which is associated with lethality. Using an established mouse model of VEEV infection, the encephalitic aspects of the disease were analysed to identify biomarkers associated with inflammation. Sequential sampling of lethally challenged mice (infected subcutaneously) confirmed a rapid onset systemic infection with subsequent spread to the brain within 24 h of the challenge. Changes in inflammatory biomarkers (TNF-α, CCL-2, and CCL-5) and CD45+ cell counts were found to correlate strongly to pathology (R>0.9) and present previously unproven biomarkers for disease severity in the model, more so than viral titre. The greatest level of pathology was observed within the olfactory bulb and midbrain/thalamus. The virus was distributed throughout the brain/encephalon, often in areas not associated with pathology. The principal component analysis identified five principal factors across two independent experiments, with the first two describing almost half of the data: (1) confirmation of a systemic Th1-biased inflammatory response to VEEV infection, and (2) a clear correlation between specific inflammation of the brain and clinical signs of disease. Targeting strongly associated biomarkers of deleterious inflammation may ameliorate or even eliminate the encephalitic syndrome of this disease.

Keywords: VEEV; alphavirus; chemokines; cytokines; inflammation; leukocytes; mouse; pathology; venezuelan equine encephalitis virus.


Conflict of interest statement

The authors declare no conflict of interest.

Figures

Figure 1
Figure 1
Longitudinal section of the head from a female Balb/c mouse showing the areas evaluated within the brain/encephalon (1–6) and the nasal cavity (7); 1—Olfactory bulb, 2—Isocortex, 3—Hippocampus, 4—Midbrain/Thalamus, 5—Cerebellum, 6—Pons, and 7—Olfactory mucosa, including olfactory nerves.
Figure 2
Figure 2
The clinical characteristics of Balb/c mice infected with either 23 pfu (black) or 4140 pfu/mouse (red) of VEEV TrD via the subcutaneous route. Panel (A) shows individual clinical scores from each mouse, assigned by blinded operators using pre-determined criteria. Each line represents the fate of a single mouse ending at either a pre-determined cull or lethal endpoint. Panel (B) shows individual weight profiles from each mouse relative to their starting weight, expressed as a percentage. Each line represents the fate of a single mouse ending at either a pre-determined cull or lethal endpoint. Panel (C) shows the Kaplan–Meier estimates. It should be noted that the majority of mice were culled for experimental purposes and, as regards the Kaplan–Meier estimate, are considered censored from the point of cull. For this reason, the survival in this experiment does not drop below 50%. Panels D to F show the viral titres measured at specific time points after infection in the blood (D), spleen (E), and brain (F). Each data point shows a single mouse, and the line is the geometric mean for each group.
Figure 3
Figure 3
Representative images from the olfactory bulb of Balb/c mice infected with VEEV TrD subcutaneously. Uninfected controls (day 0; clinical score 0) exhibit characteristics within normal limits, or minimal to mild spongiosis in relation to the gross pathology observed at later time points. Immunohistochemistry stains Iba1 and GFAP were used to detect microglia and astrocytes, respectively, and in situ hybridisation (ISH) was used to detect viral RNA, evident by day 3–4 post-challenge (clinical score 2). A substantial increase in both microglia and astrocytes is evident by day 5–6 post-challenge (clinical score 5–7), indicative of infection/trauma. Spongiosis (arrows), neuronal cell death (morphologically compatible with apoptosis) (*), and the presence of VEEV RNA is most severe/marked by day 5–6 post-challenge.
Figure 4
Figure 4
Representative images from the mid-brain/thalamus of Balb/c mice infected with VEEV TrD subcutaneously. Uninfected controls (day 0; clinical score 0) exhibit characteristics within normal limits, or minimal spongiosis in relation to the gross pathology observed at later time points. Immunohistochemistry stains Iba1 and GFAP were used to detect microglia and astrocytes, respectively, and in situ hybridisation was used to detect VEEV RNA, evident by day 3–4 post-challenge (clinical score 1–2). A substantial increase in both microglia and astrocytes is evident by day 5–6 post-challenge (clinical score 5–7), indicative of infection/trauma. Spongiosis (arrows), neuronal cell death (*), and the presence of VEEV RNA are most severe/marked by days 5–6 post-challenge.
Figure 5
Figure 5
Blinded pathology scores assessing the health of various compartments of the brain from two experiments where Balb/c mice were infected with either 23 pfu (black) or 4140 pfu (red) of VEEV TrD via the subcutaneous route. Each point represents data from a single mouse, the line is the median of data, and the error bars are the interquartile range. The mean score across the compartments was also calculated and is shown last.
Figure 6
Figure 6
Representative images from tissues of heads of Balb/c mice infected with VEEV TrD subcutaneously and stained for viral RNA using in situ hybridisation. Despite an absence of overt histopathological changes, low levels of viral RNA were detected in the nasal cavity (A) and the mandibular lymph nodes (B) at 3+ days post-infection, with a clinical score of 2. A section across the cribriform plate (C) reveals an absence of viral RNA in the nerves from the nasal cavity to the olfactory bulb, but it was present within blood vessels of the olfactory bulb at 5 days post-infection (clinical score of 7).
Figure 7
Figure 7
The first component in a PCA of time course data from Balb/c mice infected with (23 pfu) or (4140 pfu) VEEV TrD via the subcutaneous route. Animals were culled at time points, and multiple measurements were taken. Panel (A) shows the scree plot indicating the proportion of the dataset (including the data from all parameters) that can be described by each component (an amalgam of some of each parameter) calculated by the analysis. These data are shown either as a line (the proportion explained by the component) or as a data label (the cumulative proportion). An arrow has been added to indicate which component is characterised further in this figure (i.e., component 1 in this figure). Panel (B) shows the regression-derived value for this component for each mouse, relative to the maximum clinical score prior to cull. Each data point is from a single mouse. Panel (C) shows the regression-derived value for this component, for each mouse, relative to time post-challenge at point of cull. Each data point is from a single mouse with a line added to indicate the mean for each cull point. Panel (D) shows the coefficients, in order of absolute scale, of each variable that contributes to this component. Measurements of viral titre/body weight, cytokines, and flow cytometry are individually assigned in blood (red), spleen (blue), and brain (grey). These measurements are further divided by viral titre and animal weight (checkerboard), flow cytometry (crosshatched), and cytokine (plain).
Figure 8
Figure 8
The second component in a PCA of time course data from Balb/c mice infected with (23 pfu) or (4140 pfu) VEEV TrD via the subcutaneous route. Animals were culled at time points, and multiple measurements were taken. Panel (A) shows the scree plot indicating the proportion of the dataset (including the data from all parameters) that can be described by each component (an amalgam of some of each parameter) calculated by the analysis. These data are shown either as a line (the proportion explained by the component) or as a data label (the cumulative proportion). An arrow has been added to indicate which component is characterised further in this figure (i.e., component 2 in this figure). Panel (B) shows the regression-derived value for this component for each mouse, relative to the maximum clinical score prior to cull. Each data point is from a single mouse. Panel (C) shows the regression-derived value for this component, for each mouse, relative to time post-challenge at point of cull. Each data point is from a single mouse with a line added to indicate the mean for each cull point. Panel (D) shows the coefficients, in order of absolute scale, of each variable that contributes to this component. Measurements of viral titre/body weight, cytokines, and flow cytometry are individually assigned in blood (red), spleen (blue), and brain (grey). These measurements are further divided by viral titre and animal weight (checkerboard), flow cytometry (crosshatched), and cytokine (plain).
Figure 9
Figure 9
The fifth component in a PCA of time course data from Balb/c mice infected with (23 pfu) or (4140 pfu) VEEV TrD via the subcutaneous route. Animals were culled at time points, and multiple measurements were taken. Panel (A) shows the scree plot indicating the proportion of the dataset (including the data from all parameters) that can be described by each component (an amalgam of some of each parameter) calculated by the analysis. These data are shown either as a line (the proportion explained by the component) or as a data label (the cumulative proportion). An arrow has been added to indicate which component is characterised further in this figure (i.e., component 5 in this figure). Panel (B) shows the regression-derived value for this component for each mouse, relative to the maximum clinical score prior to cull. Each data point is from a single mouse. Panel (C) shows the regression-derived value for this component, for each mouse, relative to time post-challenge at point of cull. Each data point is from a single mouse with a line added to indicate the mean for each cull point. Panel (D) shows the coefficients, in order of absolute scale, of each variable that contributes to this component. Measurements of viral titre/body weight, cytokines, and flow cytometry are individually assigned in blood (red), spleen (blue), and brain (grey). These measurements are further divided by viral titre and animal weight (checkerboard), flow cytometry (crosshatched), and cytokine (plain).
Figure 10
Figure 10
Mean blinded pathology scores assessing the health of various compartments of the brain in relation to the immune/infection markers from two experiments where Balb/c mice were infected with either 23 pfu (red) or 4140 pfu (black) of VEEV TrD via the subcutaneous route. Each data point is the mean pathology score of 5 mice (±SEM) and the geometric mean of cytokine levels (±geometric SEM). The immune markers are arrayed by strength of Pearson’s correlation.

References

    1. Daza E., Frias V., Alcola A., Lopez I., Bruzon I., Montero J.T., Alvarez G., Garcia M.A., Rodriguez R., Boschell J., et al. Venezuelan equine encephalitis—Colombia, 1995. MMWR Morb. Mortal. Wkly. Rep. 1995;44:721–724.
    1. Hanson R.P., Sulkin S.E., Beuscher E.L., Hammon W.M., McKinney R.W., Work T.H. Arbovirus infections of laboratory workers. Extent of problem emphasizes the need for more effective measures to reduce hazards. Science. 1967;158:1283–1286. doi: 10.1126/science.158.3806.1283. - DOI - PubMed
    1. Honnold S.P., Mossel E.C., Dupuy L.C., Morazzani E.M., Martin S.S., Hart M.K., Ludwig G.V., Parker M.D., Smith J.F., Reed D.S. Alphavirus Encephalitides. In: Bozue J., Cote C.K., Glass P.J., editors. Medical Aspects of Biological Warfare. Borden Institute; San Antonio, TX, USA: 2018. p. 483.
    1. Special Immunizations Program. [(accessed on 20 April 2023)]. Available online: https://www.usammda.army.mil/index.cfm/fhp/immunizations_program.
    1. Pittman P.R., Brown E.S., Chambers M.S. Medical Countermeasures. In: Bozue J., Cote C.K., Glass P.J., editors. Medical Aspects of Biological Warfare. Borden Institute; San Antonio, TX, USA: 2018. pp. 773–776.

Publication types