. 2023 Jun 6;15(6):1329.
doi: 10.3390/v15061329.

Assembly of the Tripartite and RNA Condensates of the Respiratory Syncytial Virus Factory Proteins In Vitro: Role of the Transcription Antiterminator M2-1

Affiliations

Assembly of the Tripartite and RNA Condensates of the Respiratory Syncytial Virus Factory Proteins In Vitro: Role of the Transcription Antiterminator M2-1

Araceli Visentin et al. Viruses. .

Abstract

A wide variety of viruses replicate in liquid-like viral factories. Non-segmented negative stranded RNA viruses share a nucleoprotein (N) and a phosphoprotein (P) that together emerge as the main drivers of liquid-liquid phase separation. The respiratory syncytial virus includes the transcription antiterminator M2-1, which binds RNA and maximizes RNA transcriptase processivity. We recapitulate the assembly mechanism of condensates of the three proteins and the role played by RNA. M2-1 displays a strong propensity for condensation by itself and with RNA through the formation of electrostatically driven protein-RNA coacervates based on the amphiphilic behavior of M2-1 and finely tuned by stoichiometry. M2-1 incorporates into tripartite condensates with N and P, modulating their size through an interplay with P, where M2-1 is both client and modulator. RNA is incorporated into the tripartite condensates adopting a heterogeneous distribution, reminiscent of the M2-1-RNA IBAG granules within the viral factories. Ionic strength dependence indicates that M2-1 behaves differently in the protein phase as opposed to the protein-RNA phase, in line with the subcompartmentalization observed in viral factories. This work dissects the biochemical grounds for the formation and fate of the RSV condensates in vitro and provides clues to interrogate the mechanism under the highly complex infection context.

Keywords: LLPS; M2-1; Mononegavirales; antiterminator; condensates; nucleocapsid; phosphoprotein; respiratory syncytial virus; viral factories.


Conflict of interest statement

The authors declare no conflict of interest.

Figures
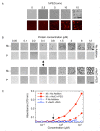
Figure 1
Figure 1
Homotypic LLPS of M2-1 compared to P. (A) Effect of crowding agent on homotypic LLPS; 5 µM M2-1 was incubated in the presence of increasing concentrations of PEG-4000. Scale bar = 10 µm. (B) P and M2-1 were tested at concentrations ranging from 0.05 to 12.5 µM in the presence or absence of 150 mM NaCl and 15% PEG-4000. Arrow indicates the saturation concentration of M2-1 in both conditions. Scale bar = 10 µm. (C) Effect of protein concentration on homotypic LLPS monitored by turbidity.
Figure 2
Figure 2
Heterotypic condensation of P and M2-1. (A) P and M2-1 were incubated at different ratios (protein concentration ranged from 2.5 to 10 µM) and visualized by brightfield and fluorescence microscopy. Scale bar = 10 µm. (B) Bright field microscopy of samples containing fixed concentration of M2-1 (10 µM) and varying concentrations of P (upper panel) and fixed concentration of P (10 µM) and varying concentration of M2-1 (lower panel). Scale bar = 10 µm. (C) Turbidity assay monitoring absorbance at 370 nm of the samples analyzed in (B). (D) Effect of crowding agent (PEG-4000) concentration on homotypic M2-1 vs. heterotypic P-M2-1 condensation monitored by turbidity. (E) Top, initial protein concentration vs. dense phase concentration of P (blue) and M2-1 (red) in a partition experiment (see Section 2) at different ratios of heterotypic P-M2-1 condensates (n = 3 ± s. e.). Bottom, schematic representation of the initial and dense phase conditions with their respective stoichiometry. Solid spheres refer to proteins in solution and stoichiometric complex formation. Translucent spheres refer to proteins within the condensate. (F) Effect of P and its deletions P∆N and P∆C on the formation of heterotypic condensates with M2-1 in a 4 M2-1:1 P ratio. Scale bar = 10 µm.
Figure 3
Figure 3
Tripartite P-NR-M2-1 condensates and incorporation of M2-1. (A) Incorporation of M2-1 over time to bipartite condensates of P-NR. Preformed P-NR condensates were incubated for 1 h followed by addition of M2-1 (arrow). N is shown in green, P in blue, and M2-1 in red. Scale bar = 10 µm. (B) Formation of tripartite heterotypic condensates triggered by NR (see Figure S3A). Preformed P-M2-1 soluble complex incubated for 10 min and then NR was added (arrow). (C) Incorporation of M2-1-FITC to tripartite condensates of unlabeled P-NR-M2-1 (see Figure S3B). Preformed P-NR-M2-1 tripartite condensates were incubated for 1 h followed by addition of M2-1-FITC (arrow). (D) Schematic representation of the incorporation of M2-1 to tripartite condensates. (E) Effect of increasing M2-1 protein concentration on P-NR-M2-1 tripartite condensates. Scale bar = 10 µm. (F) Co-localization of RSV proteins in transfected cells. A549 cells were co-transfected with plasmids encoding GFP-P, M2-1, and N. After 24 h, the proteins were detected by direct GFP fluorescence or with anti-M2-1 or anti-N antibodies by IFI. Nuclei were stained with DAPI. Scale bar = 10 µm.
Figure 4
Figure 4
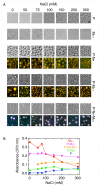
Effect of ionic strength on homotypic and heterotypic condensates. (A) Homotypic condensates of P (5 µM) and M2-1 (5 µM) and heterotypic condensates of P-NR (1.25 µM and 0.5 µM, respectively), P-M2-1 (1.25 µM and 5 µM, respectively) and P-NR-M2-1 (1.25 µM, 0.5 µM, and 1.25 µM, respectively) at increasing concentration of NaCl. Scale bar = 10 µm. (B) Turbidity assay of samples from (A) monitored by absorbance signal at 370 nm.
Figure 5
Figure 5
Modulation of heterotypic M2-1-RNA condensates by binding stoichiometry. (A) Samples with fixed concentration of Cy5-M2-1 (2.5 µM) were incubated with varying concentrations of FITC-RNARSV20 ratio. A maximum condensation effect is seen at a 1:0.5 ratio (highlighted in red) in 25 mM HEPES pH 7.5, 5% PEG and 100 mM NaCl buffer. (B) Top, electrophoretic shift mobility assay (EMSA) of stoichiometric complex M2-1-RNARSV20 formation varying the concentration of M2-1 (0 to 320 nM) with fixed concentration of RNARSV20 (200 nM). The asterisk refers to the stoichiometric complex ratio formation. Bottom, plot represents the fraction of free RNA densitometry from the EMSA as a function of M2-1:RNARSV20 ratio. Arrow indicates the solution binding stoichiometry. (C) Samples with fixed concentration of M2-1 (2.5 µM) were incubated with varying concentrations of tRNA70 in heterotypic condensates. A maximum condensation effect takes place at a 16:1 ratio (highlighted in red) in 25 mM HEPES pH 7.5, 5% PEG and minimum NaCl buffer. Scale bar = 10 µm. (D) Top, EMSA of M2-1-tRNA70 stoichiometric complexes formation varying the concentration of M2-1 (0 to 4 µM) with fixed concentration of tRNA70 (1.5 µM). The asterisk refers to the stoichiometric complex ratio formation. Bottom, plot depicts free M2-1-tRNA70 complex (full circles) and RNA (unfilled circles) densitometry from the EMSA assay. Arrow indicates the solution-binding stoichiometry.
Figure 6
Figure 6
Ionic strength dependence and reversibility of M2-1-RNA condensates. (A) Effect of NaCl on M2-1 (5 µM) homotypic and heterotypic, and M2-1-RNARSV20 (2 M2-1:1 RNARSV20 ratio) and M2-1-tRNA70 (16 M2-1:1 tRNA70 ratio) heterotypic condensates. Scale bar = 10 µm. (B) Turbidity measurement of samples from (A) monitored by absorbance at 370 nm. (C) Turbidity kinetic assay monitoring heterotypic condensation triggered by addition of 5 µM M2-1 to a solution of 0.31 µM tRNA70 (16 M2-1:1 tRNA70 ratio) and reversed by increasing NaCl to 0.5 M. (D) Coulombic surface scheme of M2-1 structure. The red areas correspond to negatively charged regions (E70-E71 and E118-E119) and the blue ones to positively charged regions. Scheme of interactions of M2-1 in homotypic condensates and interactions of M2-1 with RNA both in heterotypic condensates and in soluble stoichiometric complex. The formation of homotypic M2-1 condensates is affected by the addition of sub stoichiometric short (20 bases) or long (70 bases) RNA. These heterotypic condensates are irregular but do not correspond to amorphous aggregates. RNA excess dissolves heterotypic condensates.
Figure 7
Figure 7
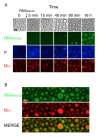
P-NR-M2-1 tripartite heterotypic condensates with RNARSV20. (A) Effect of RNARSV20 on tripartite condensates of P-NR-M2-1 over time. 0.625 µM RNARSV20 was added to preformed tripartite condensates at a 2 M2-1:1 RNARSV20 ratio in 25 mM HEPES pH 7.5, 5% PEG, and 75 mM NaCl buffer. (B) Representative fluorescence microscopy images of samples from (A) after overnight incubation. Heterogeneous distribution of RNA can be seen within the condensate. Scale bar = 10 µm.
Figure 8
Figure 8
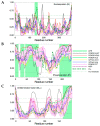
Intrinsic disorder and LLPS propensity of the RSV N (A), P (B), and M2-1 proteins (C).
Figure 9
Figure 9
Mechanistic hypothesis for viral factory condensation based on our in vitro analysis. Proteins N and P are the first ones to be synthesized and in large quantities (1) and are known to be the main drivers for condensation (2). As M2-1 levels increase at later stages of the infection cycle, it incorporates into the condensate nuclei to increase the size of the condensates (3). We propose that as polymerase is synthesized at a later stage and low amounts, it is tightly bound to P and is incorporated to condensates as clients (3). Although not known at this stage, we hypothesize that, exacerbated by the high concentrations of both enzyme and template, genomic transcription drastically increases and the increased mRNA transcripts recruit M2-1 from the protein phase to the IBAGs subcompartments (4). NS1 and NS2 genes are upstream N and not shown on this schematic representation of the viral genome. The same goes for M2-2, the product of the expression of the second ORF of the viral gene M2.

References

    1. Fields B.N. In: Fields Virology. 6th ed. Knipe D.M., Howley P.M., editors. Wolters Kluwer Health/Lippincott Williams & Wilkins; Philadelphia, PA, USA: 2013.
    1. Fooks A.R., Cliquet F., Finke S., Freuling C., Hemachudha T., Mani R.S., Müller T., Nadin-Davis S., Picard-Meyer E., Wilde H., et al. Rabies. Nat. Rev. Dis. Primer. 2017;3:17091. doi: 10.1038/nrdp.2017.91. - DOI - PubMed
    1. Wu C., Holehouse A.S., Leung D.W., Amarasinghe G.K., Dutch R.E. Liquid Phase Partitioning in Virus Replication: Observations and Opportunities. Annu. Rev. Virol. 2022;9:285–306. doi: 10.1146/annurev-virology-093020-013659. - DOI - PMC - PubMed
    1. Habchi J., Tompa P., Longhi S., Uversky V.N. Introducing Protein Intrinsic Disorder. Chem. Rev. 2014;114:6561–6588. doi: 10.1021/cr400514h. - DOI - PubMed
    1. Charman M., Weitzman M.D. Replication Compartments of DNA Viruses in the Nucleus: Location, Location, Location. Viruses. 2020;12:151. doi: 10.3390/v12020151. - DOI - PMC - PubMed

Publication types

MeSH terms

LinkOut - more resources