. 2023 Jun 15;15(6):1375.
doi: 10.3390/v15061375.

The Aqueous Leaf Extract of the Medicinal Herb Costus speciosus Suppresses Influenza A H1N1 Viral Activity under In Vitro and In Vivo Conditions

Affiliations

The Aqueous Leaf Extract of the Medicinal Herb Costus speciosus Suppresses Influenza A H1N1 Viral Activity under In Vitro and In Vivo Conditions

Amal Senevirathne et al. Viruses. .

Abstract

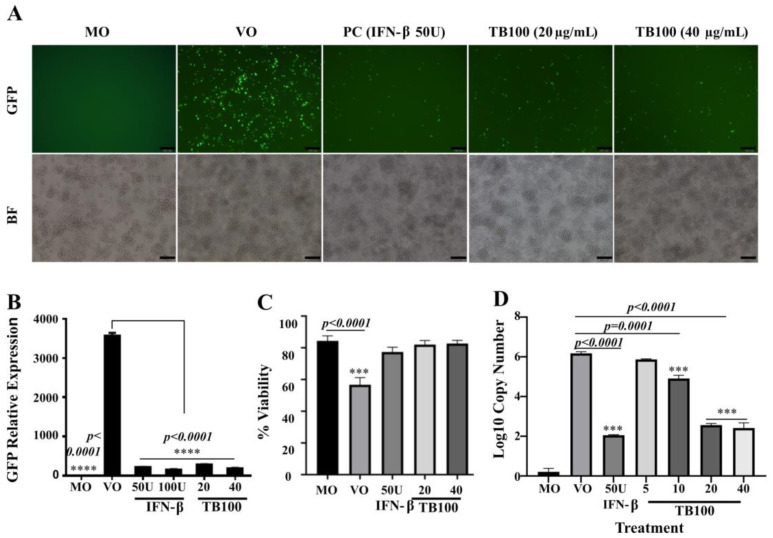
This study investigated the antiviral activity of aqueous leaf extract of Costus speciosus (TB100) against influenza A. Pretreatment of TB100 in RAW264.7 cells enhanced antiviral activity in an assay using the green fluorescence-expressing influenza A/Puerto Rico/8/1934 (H1N1) virus. The fifty percent effective concentration (EC50) and fifty percent cytotoxic concentration (CC50) were determined to be 15.19 ± 0.61 and 117.12 ± 18.31 µg/mL, respectively, for RAW264.7 cells. Based on fluorescent microscopy, green fluorescence protein (GFP) expression and viral copy number reduction confirmed that TB100 inhibited viral replication in murine RAW264.7 and human A549 and HEp2 cells. In vitro pretreatment with TB100 induced the phosphorylation of transcriptional activators TBK1, IRF3, STAT1, IKB-α, and p65 associated with interferon pathways, indicating the activation of antiviral defenses. The safety and protective efficacy of TB100 were assessed in BALB/c mice as an oral treatment and the results confirmed that it was safe and effective against influenza A/Puerto Rico/8/1934 (H1N1), A/Philippines/2/2008 (H3N2), and A/Chicken/Korea/116/2004 (H9N2). High-performance liquid chromatography of aqueous extracts led to the identification of cinnamic, caffeic, and chlorogenic acids as potential chemicals for antiviral responses. Further confirmatory studies using these acids revealed that each of them confers significant antiviral effects against influenza when used as pretreatment and enhances the antiviral response in a time-dependent manner. These findings suggest that TB100 has the potential to be developed into an antiviral agent that is effective against seasonal influenza.

Keywords: A (H3N2); A(H9N2); Costus speciosus; TB100; antiviral effect; influenza A (H1N1); leaf extract; transcriptional activator.


Conflict of interest statement

The authors declare no conflict of interest.

Figures

Figure 1
Figure 1
Time of addition, virucidal, attachment, and entry assays. (A) TB100 time of addition as pretreatment was investigated in RAW264.7 cells. Cell treatment with TB100 was conducted 12, 8, 4, and 2 h before infection with A (H1N1) PR8-GFP at MOI 0.1. After a 2 h incubation for infection, the medium was aspirated and complete medium was added. Cells were further incubated for 24 h. Viral replication was quantified using fluorescent imaging and GFP absorbance measurements (a1). (B) TB100 time of addition as posttreatment. RAW264.7 cells were treated for 2, 4, 8, and 12 h after the infection at MOI 0.1. After incubation for 24 h, viral replication was quantified by fluorescence imaging, GFP absorbance measurements (b1). (C) TB100 virucidal effect. The virucidal effect of TB100 was investigated by mixing TB100 and A (H1N1) PR8-GFP before adding them on to DMEM-pre-washed (3 times) RAW264.7 cells. Incubation was performed for 24 h and fluorescence imaging and GFP absorbance measurements were conducted (c1). (D) Attachment assay. TB100 effect on viral attachment was conducted by mixing TB100 with A (H1N1) PR8-GFP before infection. Incubation was conducted at 4 °C for 2 h. Infection medium was aspirated and incubated for 24 h. Fluorescence imaging and GFP absorbance measurements were conducted (d1). (E) Entry assay. TB100 effect on viral entry was investigated in RAW264.7 cells by treatment after 2 h of infection at 4 °C. After TB100 addition, cells were further incubated for 24 h and fluorescence imaging and GFP absorbance measurements were conducted (e1). All experiments were conducted at least three times. Stars indicate the significant difference against MO control. **** indicate significant difference against MO control. The level of significance was determined at p < 0.05. Different letters indicate significant mean difference among each condition (Tukey multiple comparison method). Mean ± SD of three independent experiments were demonstrated. MO: Media only, VO: Virus only, TB100: TB100 treatment. The scale bar represents 100 µm.
Figure 2
Figure 2
In vitro assessment of antiviral activity of TB100. (A) Fluorescent microscopy. Inhibition of influenza A (H1N1) PR8-GFP viral replication by TB100 pretreatment was investigated in RAW 264.7 cells. Dose-dependent viral suppression by TB100 was compared against the positive control IFN-β (50 U). (B) Fluorescent absorbance measurements. Quantitative measurements of viral suppression were measured in RAW264.7 cells after TB100 pretreatment by GFP absorbance. TB100 dose-dependent suppression was quantitatively investigated. **** indicate significant differences of treatments against the VO control. (C) Cell viability assay. The degree of cell protection by TB100 upon viral infection was carried out by cell viability assay using a hemocytometer (trypan blue exclusion method). Dose-dependent cell protection was investigated. A significant difference was compared against the MO control. (D) Reduction in viral copy number. Suppression of viral activity was quantified by qRT-PCR-based viral copy number determination. Significant differences were compared against the VO control. The level of significance was determined at p < 0.05. *** indicate significant difference against the MO control.MO: Media only, VO: Virus only, PC: Positive control. Means ± SD of three independent experiments were demonstrated. The scale bar represents 100 µm.
Figure 3
Figure 3
Induction of antiviral markers by TB100. (A) Induction of IFN-β and IL6 by ELISA. Induction of IFN-β and IL-6 antiviral markers was investigated in RAW264.7 cells after pretreatment with TB100. Dose-dependent activation was investigated 12 and 24 h after treatment. Quantitative assessment was conducted (a) via ELISA assay and (b) by qRT-PCR. Significant differences were compared against the media alone controlled by Tukey multiple comparison method. *, ***, **** indicate significant difference against the MO control. (B) Activation of antiviral proteins by phosphorylation. The RAW264.7 cells were treated with TB100 (40 µg/mL) and protein extraction was performed at 0, 8, 12, and 24 h after treatment. Level of phosphorylation of each protein marker was conducted using Western blot analysis (a). The expression of selected marker proteins was evaluated by qRT-PCR (b). Significant differences were compared against the zero-hour control. The level of significance was determined at p < 0.05. *, ** indicate significant difference against o h time point. MO: Media only, PC: Positive control. ELISA and qRT-PCR experiments were conducted as three independent trials. Mean ± SD is demonstrated.
Figure 4
Figure 4
In vivo dose optimization of TB100 and multiple influenza A virus challenge study. (A) In vivo, a dose optimization study was conducted in the BALB/c mice model (n = 8, N = 48). Female BALB/c mice were orally fed with TB100 at a 0.1, 0.2, 0.4, and 0.8 mg/mL concentration on 5th, 7th, 9th, and 11th day and nasal challenge with A/Puerto Rico/8/1934 (H1N1) (double LD50) was conducted on 12th day. (a) Body weight measurements were conducted daily from day zero. Mean body weight ± SD is demonstrated. (b) Histopathological examination of lung tissues was conducted at 3rd and 10th DPI and was carried out by hematoxylin and eosin staining method. Arrows indicate sites of heavy inflammation. (c) Reduction in viral copy number was determined in lung tissues at 3rd and 10th DPI. Stars indicate significant differences against VO control. Mean TCID50 ± SD is demonstrated. The level of significance was determined at p < 0.05. (B) In vivo challenge study. BALB/c mice (n = 8, N = 56) orally treated with TB100 at 0.8 mg/mL four times in two-day intervals as for dose optimization. The mice challenge was conducted with influenza A (H1N1), A (H3N2), and A (H9N2) strains using double LD50. Post-challenge body weight measurements for (a1) A (H1N1), (a2) A (H3N2), and (a3) A (H9N2) were taken daily. Mean body weight ± SD is demonstrated. Statistical comparison was performed against the naïve group (unpaired t-test) at the end of the experiment. The mortality of mice was monitored and recorded on a daily basis. Kaplan–Meier survival curves were constructed: (b1) A (H1N1), (b2) A (H3N2), and (b3) A (H9N2). The statistical comparison was performed by log-rank (Mantel–Cox) test. The level of significance was determined at p < 0.05. VO: Virus only, PC: Positive control, DPI: Day post-infection. The scale bar represents 100 µm.
Figure 5
Figure 5
Identification of antiviral compounds of TB100 and assessment of antiviral activity. (A) HPLC analysis. HPLC was carried out to identify prominent compounds present in TB100 using distilled water and methanol-extracted samples. We picked up cinnamic, caffeic, and chlorogenic acids as major compounds present in TB100 using standard-based selection procedure. The antiviral activity was investigated in a dose-dependent manner. (B) GFP fluorescence imaging. Suppression of influenza A (H1N1) PR8-GFP in RAW 264.7 cells was investigated as pretreatment with each compound. Fluorescence imaging was conducted. (C) Western blots analysis. RAW 264.7 cells were pretreated with each compound (2 mM). Protein isolation was conducted in time intervals at 0, 8, 12, and 24 h after treatment. (D) qRT-PCR assessment of antiviral gene expression. The effect of cinnamic, caffeic, and chlorogenic on antiviral genes was investigated by qRT-PCR analysis. Statistical comparisons were conducted against the media-alone control (negative control). Three independent trials were undertaken and mean ± SD is demonstrated. The level of significance was determined at p < 0.05. *, **, ***, **** indicate significant difference against the negative control. Scale bar represents 100 µm. MO: Media only, VO: virus only.
Figure 6
Figure 6
Potential mechanisms of TB100-mediated antiviral immune response induction.

References

    1. Young-Xu Y., Van Aalst R., Russo E., Lee J.K.H., Chit A. The Annual Burden of Seasonal Influenza in the Us Veterans Affairs Population. PLoS ONE. 2017;12:e0169344. doi: 10.1371/journal.pone.0169344. - DOI - PMC - PubMed
    1. Carrat F., Flahault A. Influenza Vaccine: The Challenge of Antigenic Drift. Vaccine. 2007;66:45–53. doi: 10.1016/j.vaccine.2007.07.027. - DOI - PubMed
    1. Maltezou H.C., Ioannidou E., De Schrijver K., François G., De Schryver A. Influenza Vaccination Programs for Healthcare Personnel: Organizational Issues and Beyond. Int. J. Environ. Res. Public Health. 2021;18:11122. doi: 10.3390/ijerph182111122. - DOI - PMC - PubMed
    1. Karlsson Hedestam G.B., Fouchier R.A.M., Phogat S., Burton D.R., Sodroski J., Wyatt R.T. The Challenges of Eliciting Neutralizing Antibodies to HIV-1 and to Influenza Virus. Nat. Rev. Microbiol. 2008;6:143–155. doi: 10.1038/nrmicro1819. - DOI - PubMed
    1. Amarelle L., Lecuona E., Sznajder J.I. Anti-Influenza Treatment: Drugs Currently Used and under Development. Arch. Bronconeumol. 2017;53:19–26. doi: 10.1016/j.arbres.2016.07.004. - DOI - PMC - PubMed

Publication types