. 2023 Jun 16;15(6):1382.
doi: 10.3390/v15061382.

The Lambda Variant in Argentina: Analyzing the Evolution and Spread of SARS-CoV-2 Lineage C.37

Mercedes Soledad Nabaes Jodar  1   2 Carolina Torres  2   3 Laura Mojsiejczuk  3 Dolores Acuña  1   2 Laura Elena Valinotto  1   2 Stephanie Goya  1 Monica Natale  1 Silvina Lusso  1 Sofia Alexay  1 Ariel Amadio  2   4 Matias Irazoqui  2   4 Franco Fernandez  2   5 Maria Elina Acevedo  1 Cristina Alvarez Lopez  1 Andres Angelletti  6 Paula Aulicino  2   7 Elisa Bolatti  2   8 Bettina Brusés  9 Marco Cacciahue  2   10 Ana Cavatorta  11 Agustina Cerri  2   8 Andres Cordero  6 Humberto Debat  2   5 Maria Jose Dus Santos  12   13 Maria Florencia Eberhardt  2   4 Regina Ercole  14 Carlos Espul  15 Marisa Farber  2   10 Fabián Fay  16 Ailen Fernandez  17 Florencia Ferrini  2   18 Laura Formichelli  9 Santiago Ceballos  2   19 Fernando Gallego  20 Adriana Giri  2   8 Maria Gismondi  2   10 Raul Maximiliano Acevedo  21 Ivan Gramundi  20 María Eugenia Ibañez  22 Guido Konig  2   10 Viviana Leiva  23 Melina Lorenzini Campos  9 Horacio Lucero  9 Nathalie Marquez  5 Melina Mazzeo  17 Alicia Susana Mistchenko  1   24 Luciana Montoto  25 Marianne Muñoz  10 Victoria Nadalich  6 Cristina Nardi  2   26 Belén Ortiz  23 Luis Pianciola  17 Carolina Pintos  17 Andrea Puebla  10 Carolina Rastellini  17 Alejandro Ezequiel Rojas  2   26 Javier Sfalcin  16 Ariel Suarez  27 Clara Theaux  28 Guillermo Thomas  1 Estefania Tittarelli  27 Rosana Toro  6 Vanina Villanova  29 Gretel Wenk  25 Cecilia Ziehm  17 Maria Carla Zimmermann  18 Sebastian Zunino  30 Proyecto Pais  31 Mariana Viegas  2   6
Affiliations

The Lambda Variant in Argentina: Analyzing the Evolution and Spread of SARS-CoV-2 Lineage C.37

Mercedes Soledad Nabaes Jodar et al. Viruses. .

Abstract

The second wave of COVID-19 occurred in South America in early 2021 and was mainly driven by Gamma and Lambda variants. In this study, we aimed to describe the emergence and local genomic diversity of the SARS-CoV-2 Lambda variant in Argentina, from its initial entry into the country until its detection ceased. Molecular surveillance was conducted on 9356 samples from Argentina between October 2020 and April 2022, and sequencing, phylogenetic, and phylogeographic analyses were performed. Our findings revealed that the Lambda variant was first detected in Argentina in January 2021 and steadily increased in frequency until it peaked in April 2021, with continued detection throughout the year. Phylodynamic analyses showed that at least 18 introductions of the Lambda variant into the country occurred, with nine of them having evidence of onward local transmission. The spatial--temporal reconstruction showed that Argentine clades were associated with Lambda sequences from Latin America and suggested an initial diversification in the Metropolitan Area of Buenos Aires before spreading to other regions in Argentina. Genetic analyses of genome sequences allowed us to describe the mutational patterns of the Argentine Lambda sequences and detect the emergence of rare mutations in an immunocompromised patient. Our study highlights the importance of genomic surveillance in identifying the introduction and geographical distribution of the SARS-CoV-2 Lambda variant, as well as in monitoring the emergence of mutations that could be involved in the evolutionary leaps that characterize variants of concern.

Keywords: Lambda; SARS-CoV-2; South America; evolution; phylodynamic; variants.


Conflict of interest statement

The authors declare no conflict of interest. The funders had no role in the design of the study; in the collection, analyses, or interpretation of data; in the writing of the manuscript; or in the decision to publish the results.

Figures

Figure 1
Figure 1
Schematic representation of the datasets used according to the specific objective of each analysis.
Figure 2
Figure 2
(A) Number of partial/complete genomes by Argentine regions. (B) Frequency of SARS-CoV-2 variants and number of reported cases per day by epidemiological week (n = 9356); only cases that did not present a history of travel or close contact. The colors in (B) represent the cumulative abundance of each SARS-CoV-2 variant per epidemiological week.
Figure 3
Figure 3
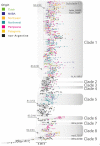
Maximum-likelihood phylogenetic tree of SARS-CoV-2 whole-genome sequences of Lambda (lineage C.37). Tips are colored by region and clades with Argentine genomes are highlighted by grey rectangles. Nonsynonymous mutations associated with one or more of the Argentine clades are shown at the bottom of the rectangles. B.1.1.1 sequences were used as the outgroup. The SH-like/UFB values for the relevant groups are indicated for some groups. UFB: ultrafast bootstrap. The scale indicates the number of substitutions per site.
Figure 4
Figure 4
(A) Lollipop plot summarizing the frequency of SARS-CoV-2 nonsynonymous mutations and deletions with >10% prevalence. The bubbles’ y-coordinates indicate mutation frequencies, which are also shown above the bubbles. The five amino acid substitutions with frequency values between 10% and 90% are shown in colors. (B) Schematic summary of the changes found in the PAIS-G1123 sequence. Text in grey indicates the constellation of mutations characteristic of the Lambda variant, and red text indicates amino acid positions with changes that are unique to the PAIS-G1123 sequence compared to the most-related Argentine genome sequences of the Lambda variant.
Figure 5
Figure 5
Coalescent Bayesian Skyline analysis. The black line is the mean estimate of the estimated effective population size. The two blue lines are the upper and lower bounds of the 95% HPD interval. The x-axis is the time in years, and the y-axis is on a log scale.
Figure 6
Figure 6
(A) The Bayesian discrete phylogeographic analysis. Maximum clade credibility tree for the Lambda variant. The branches’ colors represent the MRCA’s location (described in the legend). The time scale in years is detailed at the bottom. (B) Different stages of phylogeographic history of Clade 1 under a discrete diffusion model. The lines colors represent the posterior probability support for each transition rate between locations calculated by the BEAST program and summarized by the SPREAD3 program (described in the legend). The size of the polygons around a sampling location is proportional to the number of lineages that maintain that location.

References

    1. Thakur S., Sasi S., Pillai S.G., Nag A., Shukla D., Singhal R., Phalke S., Velu G.S.K. SARS-CoV-2 Mutations and Their Impact on Diagnostics, Therapeutics and Vaccines. Front. Med. 2022;9:815389. doi: 10.3389/fmed.2022.815389. - DOI - PMC - PubMed
    1. Oude Munnink B.B., Worp N., Nieuwenhuijse D.F., Sikkema R.S., Haagmans B., Fouchier R.A.M., Koopmans M. The next Phase of SARS-CoV-2 Surveillance: Real-Time Molecular Epidemiology. Nat. Med. 2021;27:1518–1524. doi: 10.1038/s41591-021-01472-w. - DOI - PubMed
    1. Elbe S., Buckland-Merrett G. Data, Disease and Diplomacy: GISAID’s Innovative Contribution to Global Health: Data, Disease and Diplomacy. Global Chall. 2017;1:33–46. doi: 10.1002/gch2.1018. - DOI - PMC - PubMed
    1. Chen Z., Azman A.S., Chen X., Zou J., Tian Y., Sun R., Xu X., Wu Y., Lu W., Ge S., et al. Global Landscape of SARS-CoV-2 Genomic Surveillance and Data Sharing. Nat. Genet. 2022;54:499–507. doi: 10.1038/s41588-022-01033-y. - DOI - PMC - PubMed
    1. World Health Organization Tracking SARS-CoV-2 Variants. [(accessed on 25 February 2023)];2021 Available online: https://Www.Who.Int/En/Activities/Tracking-SARS-CoV-2-Variants/

Publication types

Supplementary concepts