. 2023 Dec;12(2):2231556.
doi: 10.1080/22221751.2023.2231556.

Lipid signatures of West Nile virus infection unveil alterations of sphingolipid metabolism providing novel biomarkers

Affiliations

Lipid signatures of West Nile virus infection unveil alterations of sphingolipid metabolism providing novel biomarkers

Patricia Mingo-Casas et al. Emerg Microbes Infect. 2023 Dec.

Abstract

West Nile virus (WNV) is a neurotropic flavivirus transmitted by the bites of infected mosquitoes. Severe forms of West Nile disease (WND) can curse with meningitis, encephalitis or acute flaccid paralysis. A better understanding of the physiopathology associated with disease progression is mandatory to find biomarkers and effective therapies. In this scenario, blood derivatives (plasma and serum) constitute the more commonly used biofluids due to its ease of collection and high value for diagnostic purposes. Therefore, the potential impact of this virus in the circulating lipidome was addressed combining the analysis of samples from experimentally infected mice and naturally WND patients. Our results unveil dynamic alterations in the lipidome that define specific metabolic fingerprints of different infection stages. Concomitant with neuroinvasion in mice, the lipid landscape was dominated by a metabolic reprograming that resulted in significant elevations of circulating sphingolipids (ceramides, dihydroceramides, and dihydrosphingomyelins), phosphatidylethanolamines and triacylglycerols. Remarkably, patients suffering from WND also displayed an elevation of ceramides, dihydroceramides, lactosylceramides, and monoacylglycerols in their sera. The dysregulation of sphingolipid metabolism by WNV may provide new therapeutic opportunities and supports the potential of certain lipids as novel peripheral biomarkers of WND progression.

Keywords: West Nile virus; biomarker; lipid; patient; viral infection.


Conflict of interest statement

No potential conflict of interest was reported by the author(s).

Figures

Figure 1.
Figure 1.
Progress of WNV neuroinvasion in mice. (A) Changes in body weight induced after WNV infection. Mice were infected with WNV (104 PFU/mice i.p.), or mock infected, and the weight was recorded daily up to 10 dpi. Data represent means ± SD (n = 10 animals/group). **, P < 0.01; **** P < 0.0001 for Sidak multiple comparison test. (B) Survival of mice infected with WNV (n = 10). (C) Virus load in the CNS of mice infected with WNV. Samples from brain and cerebellum were obtained at 3, 7 and 10 dpi, and virus load was analysed by quantitative PCR. The geometric means are indicated for each group. Each symbol denotes a single animal. Samples with viral burden below the detection limit are indicated in the baseline. Each symbol denotes a single animal (n = 9 uninfected and n = 10 infected mice at 3 dpi; n = 10 uninfected and n = 10 infected mice at 7 dpi; n = 10 uninfected and n = 8 infected mice at 10 dpi). (D,E) Expression of inflammatory markers in the CNS of mice infected with WNV. The amount of mRNA of Ccl2 (D) and Cxcl10 (E) in the brain and cerebellum was quantified (relative to GAPDH) by real-time PCR. The means are indicated for each group. Each symbol denotes a single animal (n = 9 uninfected and n = 10 infected mice at 3 dpi; n = 10 uninfected and n = 10 infected mice at 7 dpi; n = 10 uninfected and n = 8 infected mice at 10 dpi).
Figure 2.
Figure 2.
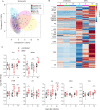
Global changes in the circulating lipidome of mice infected with WNV. (A) Multivariate analysis of the plasma lipidome of mice infected with WNV in comparison to uninfected controls. Scores plots form OPLS-DA analysis. Each symbol denotes a single sample, and 95% confidence intervals are shadowed for each group. (B) Temporal changes in the plasma lipidome of infected mice. Each line denotes the average lipid levels in each group. The lipids in the heat map were ordered within each subclass by the number of carbons in the hydrocarbon chains and the total of double bonds. The heatmap colour indicated the relative abundance of the lipids, and lipid levels in the scale corresponds to normalized, log2 transformed fold change and pareto scaled values. (C) Box-and-whiskers graphs displaying the lipid subclasses significantly altered in infected mice. The box-and-whisker plots represent the median line, with boxes extending from 25th to 75th percentile and whiskers ranging from minimum to maximum values. Each symbol denotes a single animal. *, P < 0.05; **, P < 0.01; ***, P < 0.001; **** P < 0.0001 for Sidak multiple comparison test. For all panels displayed in the figure n = 9 uninfected and n = 10 infected mice at 3 dpi; n = 10 uninfected and n = 10 infected mice at 7 dpi; n = 10 uninfected and n = 8 infected mice at 10 dpi.
Figure 3.
Figure 3.
Dynamics of metabolic changes during WNV infection in mice. Significantly altered reactions identified by network analysis are indicated at 3, 7 and 10 dpi using BioPAN. Heat maps indicate z-score for significantly altered reactions at the different dpi (n = 9 uninfected and n = 10 infected mice at 3 dpi; n = 10 uninfected and n = 10 infected mice at 7 dpi; n = 10 uninfected and n = 8 infected mice at 10 dpi).
Figure 4.
Figure 4.
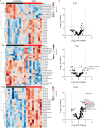
Lipid signatures associated with WNV infection in the mouse model. (A) Heat maps displaying the top 25 lipid features selected by hierarchical clustering at 3, 7 and 10 dpi. The heatmap colour indicated the relative abundance of the lipids, and lipid levels in the scales denotes normalized, log2-transformed fold change and pareto scaled values. Each column denotes a single animal (n = 9 uninfected and n = 10 infected mice at 3 dpi; n = 10 uninfected and n = 10 infected mice at 7 dpi; n = 10 uninfected and n = 8 infected mice at 10 dpi). (B) Volcano plot at 3, 7 and 10 dpi for the molecular lipid species identified in the study. Significantly altered lipid species (FDR q-value < 0.05 and log2 fold change >1) are indicated. Data correspond to n = 9 uninfected and n = 10 infected mice at 3 dpi; n = 10 uninfected and n = 10 infected mice at 7 dpi; n = 10 uninfected and n = 8 infected mice at 10 dpi.
Figure 5.
Figure 5.
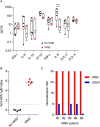
Inflammatory markers and anti-WNV antibodies in the sera of patients enrolled in the study. (A) Comparison of inflammatory markers in the serum of WND patients to patients with similar symptoms but due to other aetiology. The box-and-whisker plots represent the median line, with boxes extending from 25th to 75th percentile and whiskers ranging from minimum to maximum value. Due to the lack of sufficient sample, one WND patient was excluded from the cytokine analyses, and one control patient was excluded from the analyses of IP-10, CCL-8, CCL-3, and CCL-4 (n = 4–5). ***, P < 0.001 for Sidak multiple comparison test. (B) Analysis of anti-WNV specific IgM by IgM capture ELISA in the sera of patients enrolled in the study. Dashed line indicates the limit of detection of the assay. Lines indicate the mean of each group. Each symbol denotes a single patient (n = 5). (C) Neutralization titres against WNV and USUV of sera from WND patients enrolled in the study. Serum titre was defined as the highest dilution showing > 50% neutralization of cytopathic effect and neutralizing. Dashed line denotes the limit of detection of the assay (≤1/8). Neutralization titres against USUV were below the limit of detection for patient #2 and #5.
Figure 6.
Figure 6.
Global changes in the circulating lipidome of infected WND patients. (A) Temporal changes in the serum lipidome of WND patients in comparison to patients with similar symptoms but due to other aetiology. The lipids in the heat map were ordered within each subclass by the number of carbons in the hydrocarbon chains and the total of double bonds. The heatmap colour indicated the relative abundance of the lipids, and corresponds to normalized, log2 in subindex transformed fold change and pareto scaled values. Each column denotes a single patient (n = 5). (B) Box-and-whiskers graphs displaying the lipid subclasses significantly altered in WND patients (FDR q-value < 0.05). The box-and-whisker plots represent the median line, with boxes extending from 25th to 75th percentile and whiskers ranging from minimum to maximum values. Each symbol denotes a single patient (n = 5). *, P < 0.05 and **, P < 0.01 for FDR q-value. (C) Heat map displaying the top 25 lipid features selected by hierarchical clustering between patients with WND or not. Lipid level in the colour scale denotes normalized, log2-transformed pareto-scaled data. Each column denotes a single patient (n = 5). (D) Significantly altered reactions identified by network analysis are indicated in WND patients using BioPAN. Heat maps indicate z-score for significantly altered reactions (n = 5).

References

    1. Saiz JC, Martin-Acebes MA, Blazquez AB, et al. . Pathogenicity and virulence of West Nile virus revisited eight decades after its first isolation. Virulence. 2021 Dec;12(1):1145–1173. doi:10.1080/21505594.2021.1908740 - DOI - PMC - PubMed
    1. Petersen LR, Brault AC, Nasci RS.. West Nile virus: review of the literature. JAMA. 2013 Jul 17;310(3):308–315. doi:10.1001/jama.2013.8042 - DOI - PMC - PubMed
    1. Davis LE, DeBiasi R, Goade DE, et al. . West Nile virus neuroinvasive disease. Ann Neurol. 2006 Sep;60(3):286–300. doi:10.1002/ana.20959 - DOI - PubMed
    1. Sejvar JJ. The long-term outcomes of human West Nile virus infection. Clin Infect Dis. 2007 Jun 15;44(12):1617–1624. doi:10.1086/518281 - DOI - PubMed
    1. Ghosh A, Nishtala K.. Biofluid lipidome: a source for potential diagnostic biomarkers. Clin Transl Med. 2017 Dec;6(1):22. doi:10.1186/s40169-017-0152-7 - DOI - PMC - PubMed