. 2023 Jun 12:14:1170940.
doi: 10.3389/fgene.2023.1170940. eCollection 2023.

UBE2C expression is elevated in hepatoblastoma and correlates with inferior patient survival

Affiliations

UBE2C expression is elevated in hepatoblastoma and correlates with inferior patient survival

Ruth Nousiainen et al. Front Genet. .

Abstract

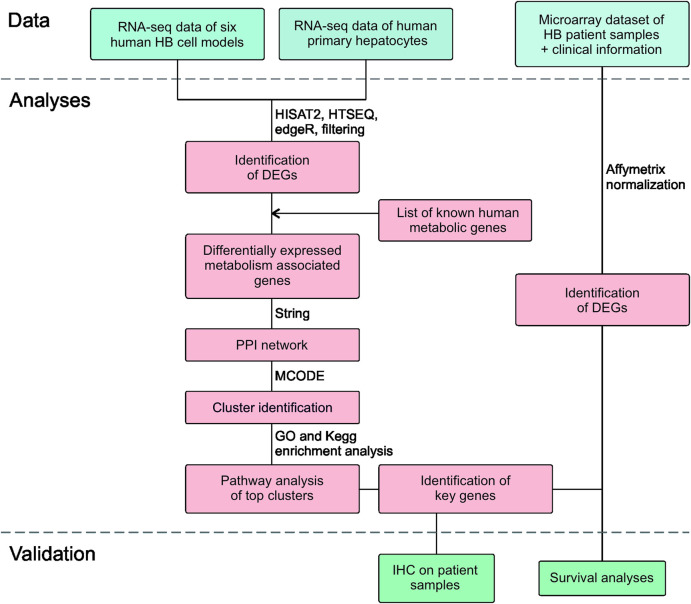
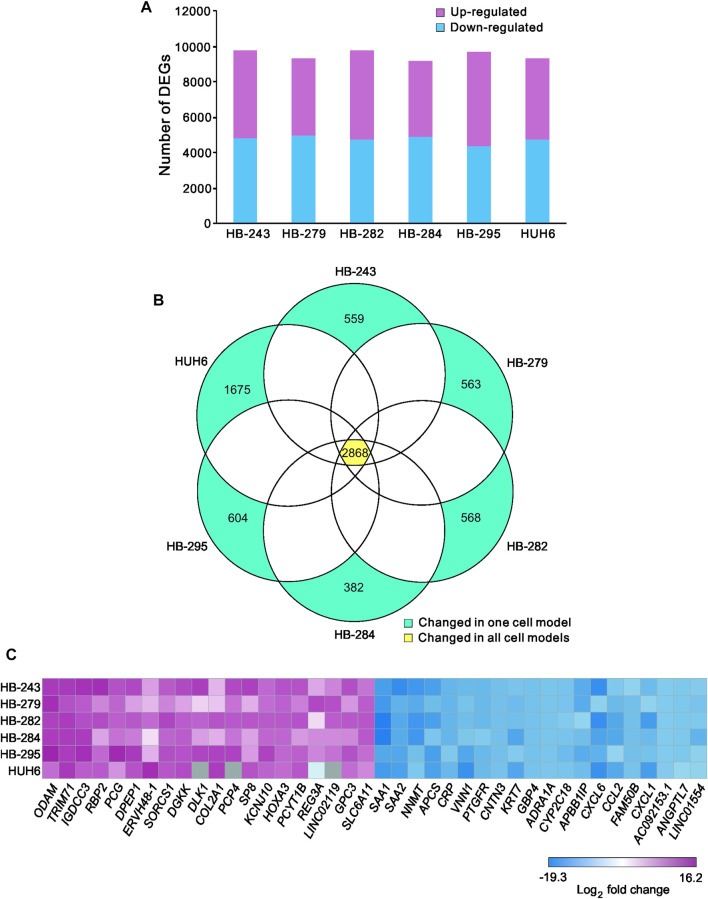
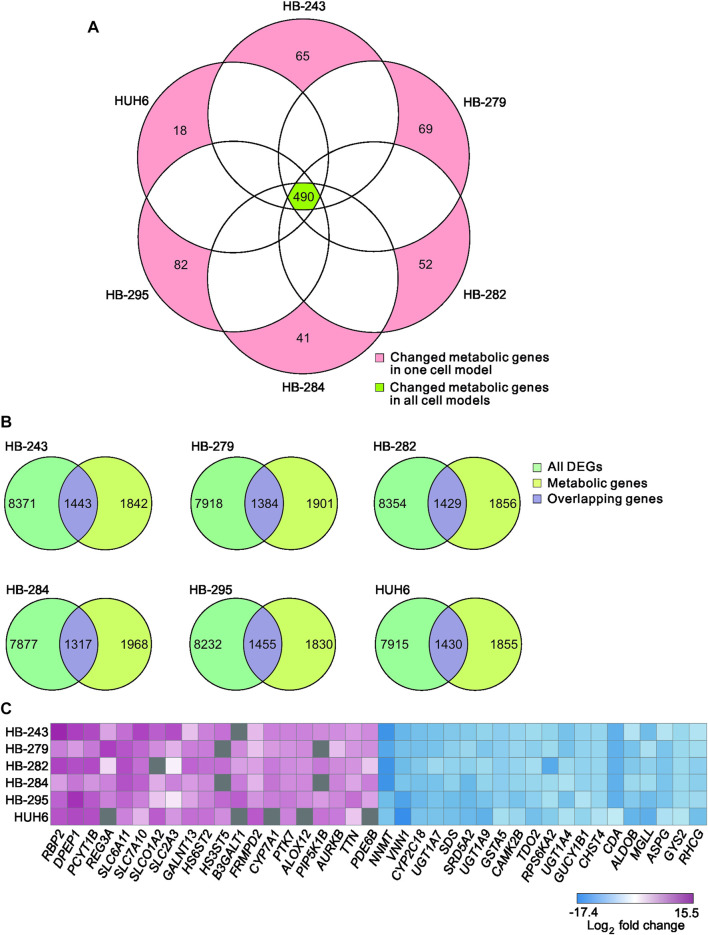
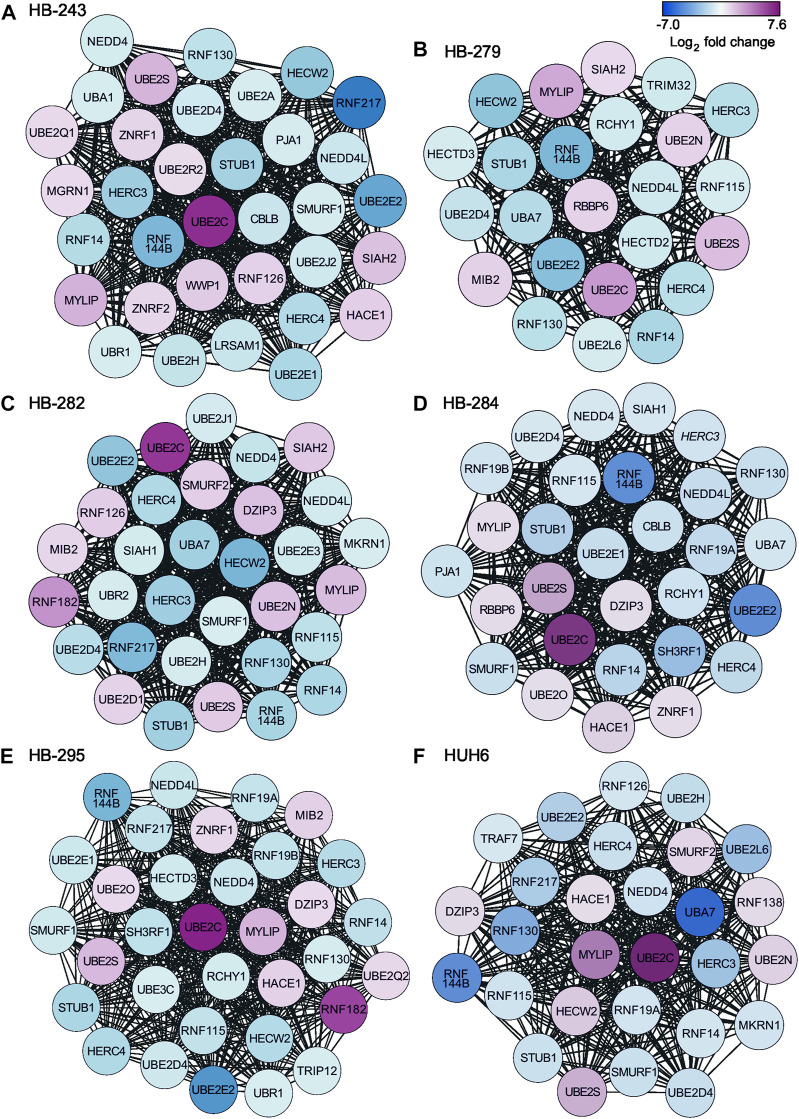
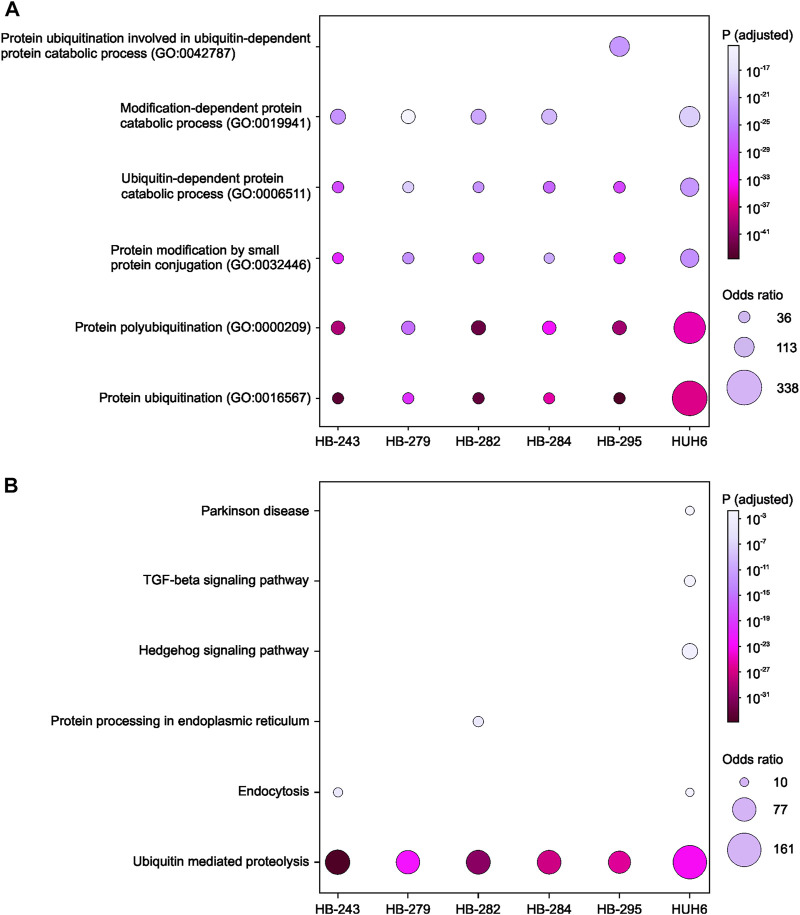
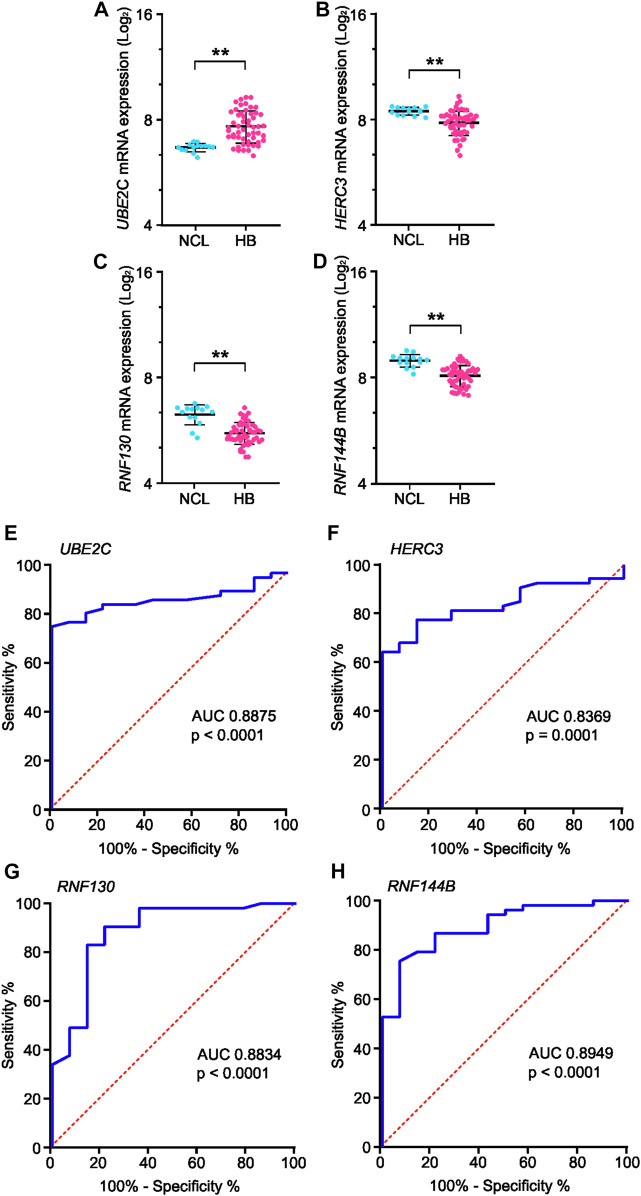
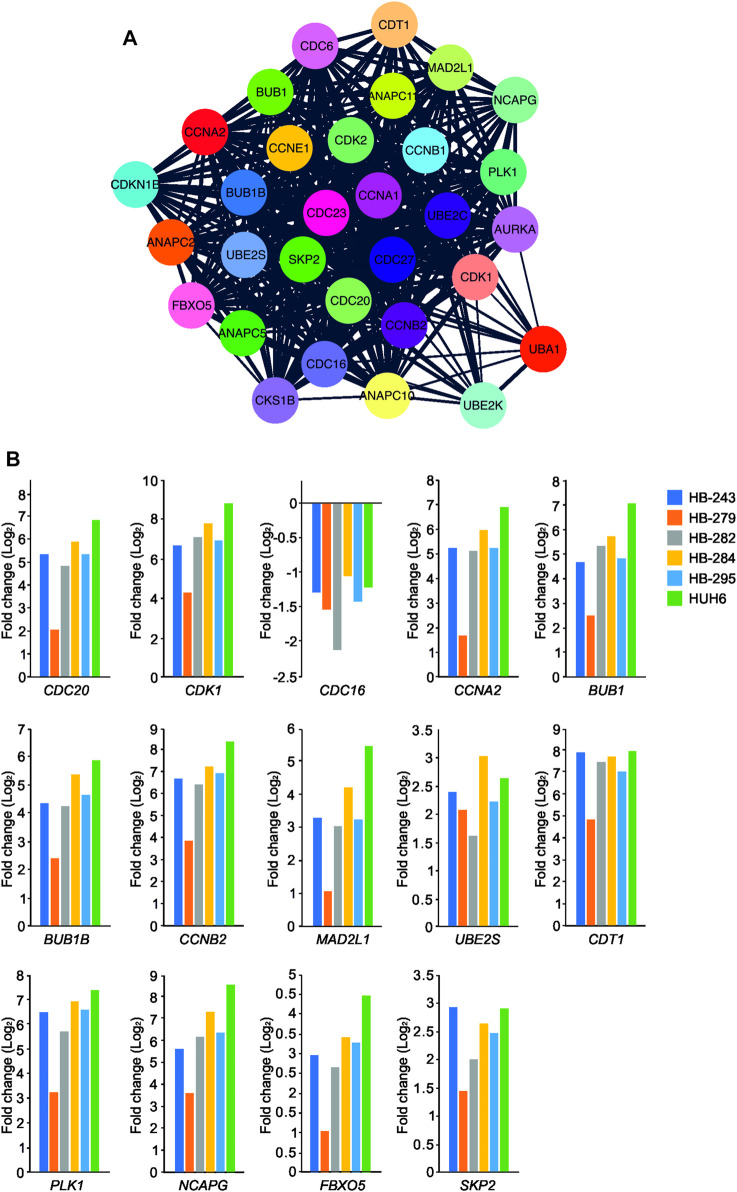
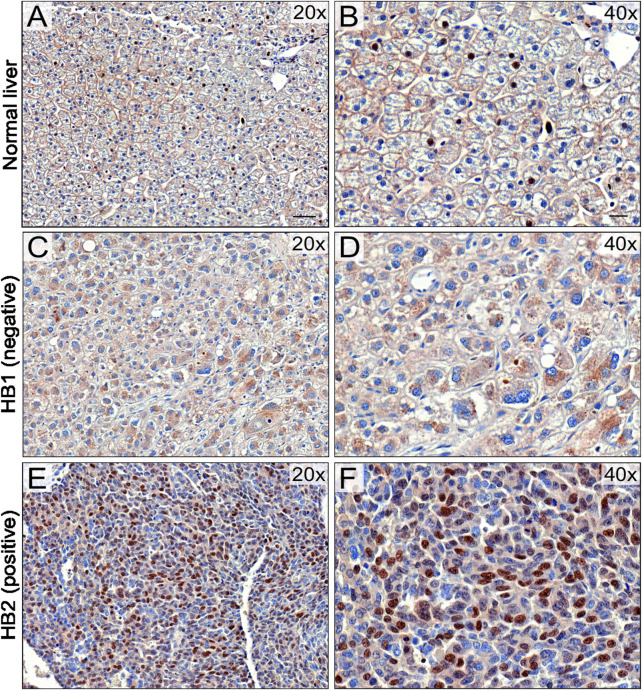
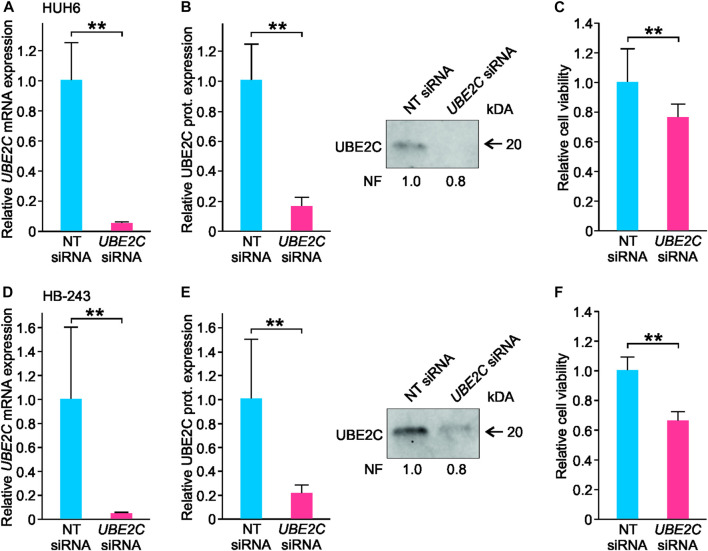
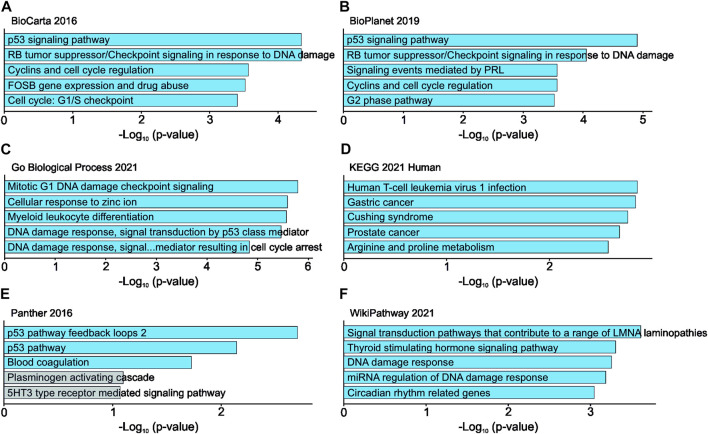
Hepatoblastoma (HB) is the most common malignant liver tumor among children. To gain insight into the pathobiology of HB, we performed RNA sequence analysis on 5 patient-derived xenograft lines (HB-243, HB-279, HB-282, HB-284, HB-295) and 1 immortalized cell line (HUH6). Using cultured hepatocytes as a control, we found 2,868 genes that were differentially expressed in all of the HB lines on mRNA level. The most upregulated genes were ODAM, TRIM71, and IGDCC3, and the most downregulated were SAA1, SAA2, and NNMT. Protein-protein interaction analysis identified ubiquitination as a key pathway dysregulated in HB. UBE2C, encoding an E2 ubiquitin ligase often overexpressed in cancer cells, was markedly upregulated in 5 of the 6 HB cell lines. Validation studies confirmed UBE2C immunostaining in 20 of 25 HB tumor specimens versus 1 of 6 normal liver samples. The silencing of UBE2C in two HB cell models resulted in decreased cell viability. RNA sequencing analysis showed alterations in cell cycle regulation after UBE2C knockdown. UBE2C expression in HB correlated with inferior patient survival. We conclude that UBE2C may hold prognostic utility in HB and that the ubiquitin pathway is a potential therapeutic target in this tumor.

Keywords: UBE2C; hepatoblastoma; liver tumor; pediatric cancer; ubiquitin.


Conflict of interest statement

Author SC is employed by Champions Oncology and was previously employed by XenTech. The remaining authors declare that the research was conducted in the absence of any commercial or financial relationships that could be construed as a potential conflict of interest.

Figures

FIGURE 1
FIGURE 1
Flowchart of the study design.
FIGURE 2
FIGURE 2
Differentially expressed genes in HB cell lines compared to primary hepatocytes Upregulated (pink) and downregulated (blue) genes in each HB cell line (A). Venn diagram showing the number of significant differentially expressed genes compared to primary hepatocytes that were shared among all six HB cell models (B). Heatmap of the 20 most downregulated and the 20 most upregulated differentially expressed genes sorted by log2FC (C). Genes in gray = change not statistically significant. Differential expression analysis was conducted using the edgeR package.
FIGURE 3
FIGURE 3
Differentially expressed metabolic genes in HB cell models Venn diagram showing the number of shared metabolic genes among the 6 HB cell lines (A). Overlap of differentially expressed genes in each cell line and the list of all metabolic genes (B). Heatmap of the 20 most up- and the 20 most downregulated metabolic genes in HB cell models (C). Genes in gray = change not statistically significant.
FIGURE 4
FIGURE 4
Highest-scoring clusters found in PPI networks of differentially expressed metabolic genes in each cell line. Clusters were ranked based on their score using MCODE plugin of Cytoscape. HB-243 (A), HB-279 (B), HB-282 (C), HB-284 (D), HB-295 (E), and HUH6 (F).
FIGURE 5
FIGURE 5
KEGG and GO analyses for enriched pathways. Genes in each cell line’s top-ranking PPI clusters were analyzed to find common enriched pathways. Statistically significant (p < 0.05) GO biological processes (A) and KEGG pathways (B) are shown for each cell line.
FIGURE 6
FIGURE 6
mRNA expression and ROC curve analysis of the four key genes in GSE131329 dataset. Expression of UBE2C (A), HERC3 (B), RNF130 (C) and RNF144B (D) in HB samples compared to noncancerous liver samples on mRNA level. ROC curve analysis of UBE2C (E), HERC3 (F), RNF130 (G) and RNF144B (H) assessing the suitability of each gene for discrimination of noncancerous liver (NCL) and HB. ** = p < 0.01. Grey dots represent gene expression of independent patients, the whiskers represent the first and third quartile, and the thick solid line is median (A–D).
FIGURE 7
FIGURE 7
UBE2C protein-protein interaction network. UBE2C associated protein-protein interactions (A). The fold change of UBE2C interacting DEGs (in relation to primary hepatocyte) emerging from our RNA sequencing analysis (B).
FIGURE 8
FIGURE 8
UBE2C protein expression in HB tissues. Immunohistochemical staining of UBE2C in 6 normal liver (NL) samples and 25 hepatoblastoma (HB) samples was done. Representative image of normal liver stained with UBE2C with ×20 (A) and ×40 (B) magnification. Representative image of HB liver staining negative for UBE2C with ×20 (C) and ×40 (D) magnification. Representative sample of HB liver staining positive for UBE2C ×20 (E) and ×40 (F) magnification. Scale bars = 50 µm (B,D) and 20 µm (C,E).
FIGURE 9
FIGURE 9
Knockdown of UBE2C and its effect on HUH6 and HB-243 cell viability. Following the siRNA transfection, UBE2C mRNA expression in HUH6 was reduced by 95% (A) and protein expression by 80% (B) compared to cells transfected with non-targeting (NT) siRNA. In HB-243, UBE2C mRNA expression was reduced by 98% (D) and protein expression by 80% (E). WST-1 assay showed a 24% decrease in HUH6 (C) and 44% in HB-243 (F) in cell viability after UBE2C silencing. Bar plots are presented as relative values of mean of three independent experiments ± RSD. **p-value <0.01, NT = non-targeting. Normalization factor (NF) describing the amount of total protein in lane in relation to other lanes is given beneath the bands (B, E).
FIGURE 10
FIGURE 10
Effects of UBE2C knockdown in HUH6 cells on RNA level. UBE2C knockdown is linked with alterations in RNA expression of genes connected to cell cycle regulation and p53 signaling pathway. Top 5 pathways and ontologies ranked by p-value (A–F).

References

    1. Aghajanzadeh T., Tebbi K., Talkhabi M. (2020). Identification of potential key genes and miRNAs involved in Hepatoblastoma pathogenesis and prognosis. J. Cell. Commun. Signal 151 (15), 131–142. 10.1007/S12079-020-00584-1 - DOI - PMC - PubMed
    1. Anders S., Pyl P. T., Huber W. (2015). HTSeq-a Python framework to work with high-throughput sequencing data. Bioinformatics 31, 166–169. 10.1093/bioinformatics/btu638 - DOI - PMC - PubMed
    1. Armengol C., Cairo S., Fabre M., Buendia M. A. (2011). Wnt signaling and hepatocarcinogenesis: The hepatoblastoma model. Int. J. Biochem. Cell. Biol. 43, 265–270. 10.1016/j.biocel.2009.07.012 - DOI - PubMed
    1. Aronson D. C., Meyers R. L. (2016). Malignant tumors of the liver in children. Semin. Pediatr. Surg. 25, 265–275. 10.1053/j.sempedsurg.2016.09.002 - DOI - PubMed
    1. Bavi P., Uddin S., Ahmed M., Jehan Z., Bu R., Abubaker J., et al. (2011). Bortezomib stabilizes mitotic cyclins and prevents cell cycle progression via inhibition of UBE2C in colorectal carcinoma. Am. J. Pathol. 178, 2109–2120. 10.1016/j.ajpath.2011.01.034 - DOI - PMC - PubMed