. 2023 Jun 14;3(6):1041-1056.
doi: 10.1158/2767-9764.CRC-23-0144. eCollection 2023 Jun.

Mitochondria Transfer from Mesenchymal Stem Cells Confers Chemoresistance to Glioblastoma Stem Cells through Metabolic Rewiring

Affiliations

Mitochondria Transfer from Mesenchymal Stem Cells Confers Chemoresistance to Glioblastoma Stem Cells through Metabolic Rewiring

Jean Nakhle et al. Cancer Res Commun. .

Abstract

Glioblastomas (GBM) are heterogeneous tumors with high metabolic plasticity. Their poor prognosis is linked to the presence of glioblastoma stem cells (GSC), which support resistance to therapy, notably to temozolomide (TMZ). Mesenchymal stem cells (MSC) recruitment to GBM contributes to GSC chemoresistance, by mechanisms still poorly understood. Here, we provide evidence that MSCs transfer mitochondria to GSCs through tunneling nanotubes, which enhances GSCs resistance to TMZ. More precisely, our metabolomics analyses reveal that MSC mitochondria induce GSCs metabolic reprograming, with a nutrient shift from glucose to glutamine, a rewiring of the tricarboxylic acid cycle from glutaminolysis to reductive carboxylation and increase in orotate turnover as well as in pyrimidine and purine synthesis. Metabolomics analysis of GBM patient tissues at relapse after TMZ treatment documents increased concentrations of AMP, CMP, GMP, and UMP nucleotides and thus corroborate our in vitro analyses. Finally, we provide a mechanism whereby mitochondrial transfer from MSCs to GSCs contributes to GBM resistance to TMZ therapy, by demonstrating that inhibition of orotate production by Brequinar (BRQ) restores TMZ sensitivity in GSCs with acquired mitochondria. Altogether, these results identify a mechanism for GBM resistance to TMZ and reveal a metabolic dependency of chemoresistant GBM following the acquisition of exogenous mitochondria, which opens therapeutic perspectives based on synthetic lethality between TMZ and BRQ.

Significance: Mitochondria acquired from MSCs enhance the chemoresistance of GBMs. The discovery that they also generate metabolic vulnerability in GSCs paves the way for novel therapeutic approaches.


Figures

FIGURE 1
FIGURE 1
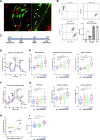
Exchange of mitochondria between MSCs with GSCs enhances GSC energy metabolism and proliferation. A and B, Mitochondria exchange during coculture of MSCs and GSCs, respectively prelabeled with red MitoTracker and green CellTracker. A, Imaging by confocal microscopy (24 hours). Scale bars: left, 20 μm; right, 5 μm. Arrows: MSC mitochondria. B, Quantification of mitochondria transfer to GSCs by flow cytometry analysis (48 hours coculture) Representative experiment and quantification with MSC from 3 donors. CI, MSC mitochondria (three concentrations with 2-fold incremental increases) were transferred to GSCs by Mitoception and their effects on GSC functions were analyzed at 48 hours. C, Time line. D–H, Dose–response effects of MSC mitochondria on GSCs OCRs (D, E) and ECARs (F, G). All values were normalized to GSC cell numbers. D, Representative plot of GSC OCR in basal conditions and after sequential addition of oligomycin, Carbonyl cyanide-p-trifluoromethoxyphenylhydrazone (FCCP), and rotenone/antimycin. Mean values and SEM are indicated (n = 4). E, Tukey boxplots showing basal respiration, respiration linked to ATP production and maximal respiration. n = 18 from four independent experiments. One-way ANOVA; *, P < 0.05; ***, P < 0.001. F, Representative plot of GSC ECAR in basal conditions and after sequential addition of glucose, oligomycin, oxamate, and 2-deoxyglucose. Mean values and SEM are indicated (n = 6). G, Tukey boxplots showing basal glycolysis, glycolytic capacity, and lactate acidification. n = 13 from three independent experiments. One-way ANOVA; *, P < 0.05; **, P < 0.01; ***, P < 0.001. H, OCR versus ECAR of GSCs with MSC mitochondria. Mean and SEM. I, Tukey boxplots showing GSCs proliferation. One-way ANOVA; ***, P < 0.001. Data from B to I were obtained with MSCs from 3 donors.
FIGURE 2
FIGURE 2
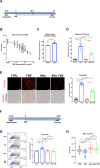
MSC mitochondria increase GSC survival in response to TMZ. A and F, Time lines for the response of GSCs to TMZ, at day 5 (B–E) and at 48 hours (G–H). B, Survival of GSCs in response to TMZ (dose–response 6–400 μmol/L). Framed TMZ concentration of 50 μmol/L used in all subsequent experiments. C, Effect of TMZ on the transfer of mitochondria from MSCs to GSCs, as analyzed by flow cytometry. D and E, Effects of MSC mitochondria on GSC survival in response to TMZ. D, GSC caspase 3/7 activity (n = 16, three independent experiments). E, Cytotox assay (Incucyte). Representative images and quantification of Cytotox labeled GSCs (n = 15, 3 independent experiments). G and H, Effects of MSC mitochondria on GSC survival in response to TMZ (48 hours). H, GSC cell death. FACS analysis of Zombie violet-stained GSCs. Representative data and quantification from seven independent experiments with mean and SEM values. H, GSC cell number (n = 84 from seven independent experiments). Tukey boxplots with Kruskal–Wallis test; **, P < 0.01; ***, P < 0.001. C–E and G, Statistical analysis by one-way ANOVA; *, P < 0.05; ***, P < 0.001.
FIGURE 3
FIGURE 3
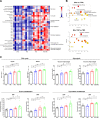
MSC mitochondria modify the metabolic response of GSCs to TMZ. MSC mitochondria were transferred by Mitoception to GSCs which were subsequently treated with TMZ (50 μmol/L) for 48 hours. A, Time line. Effects of TMZ in the presence/absence of MSC mitochondria on GSC OCRs (B and C) and ECARs (D and E). All values were normalized to GSC cell numbers. B, Representative plot of GSC OCR in basal conditions, treated with TMZ, MSC mitochondria or both, and after sequential addition of oligomycin, FCCP and rotenone/antimycin. Mean values and SEM (n = 4). C, Tukey boxplots showing basal respiration and maximal respiration (n = 25 from four independent experiments). One-way ANOVA; **, P < 0.01; ***, P < 0.001. D, Representative plot of GSC ECAR in basal conditions, treated with TMZ, MSC mitochondria or both, and after sequential addition of glucose, oligomycin, oxamate, and 2-deoxyglucose. Mean values and SEM (n = 5). E, Tukey boxplots showing GSC basal glycolysis (n = 25 from four independent experiments). One-way ANOVA; **, P < 0.01; ***, P < 0.001. F, OCR versus ECAR values of GSCs treated with TMZ, with MSC mitochondria or with both. Mean and SEM values. G–J, GSC mitochondrial mass and ROS production. GSCs labeled with MitoTracker and MitoSox were analyzed by FACS, following the acquisition of MSC mitochondria and 48 hours TMZ treatment. G, GSC total mitochondrial mass. Representative experiment and relative mitochondria mean fluorescence intensity values represented as mean ± SEM (n = 7). H, Expression of COX IV protein. Representative Western blots for COX IV and β−actin expression (MW markers in kDa). Quantifications (n = 3) represented as mean ± SEM. I, GSC ROS production as measured with Mitosox. Representative data and quantification from independent experiments (n = 9) with mean and SEM values. J, Ratios of GSC ROS production over mitochondrial mass (n = 7). G–J, One-way ANOVA; *, P < 0.05; **, P < 0.01; ***, P < 0.001.
FIGURE 4
FIGURE 4
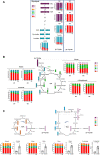
MSC mitochondria modify GSC metabolite production in response to TMZ. GSC metabolites production was analyzed by mass spectrometry on whole-cell extracts. A, Heat map of metabolites produced by GSCs following acquisition of MSC mitochondria and/or TMZ treatment. B, MSEA in GSCs after mitochondria acquisition in comparison with control GSCs, without or with TMZ treatment. C, Metabolite concentrations for metabolic pathways identified in B. Two independent experiments were performed, each in triplicate. Each point corresponds to an individual culture and extraction. Values were normalized to cell numbers. Means ± SEM and t tests with Welch correction; *, P < 0.05; **, P < 0.01.
FIGURE 5
FIGURE 5
MSC mitochondria modify metabolite fluxes in GSCs. [U-13C]-glucose and [U-13C]-glutamine isotope profiling of GSCs with and/or without MSC mitochondria and treated or not with TMZ (48 hours; n = 3). A, Glycolysis intermediates. B, Isotopologues of TCA cycle metabolites from 13C-glucose (24 and 48 hours). C, Isotopologues of TCA cycle metabolites from 13C-glutamine (48 hours). M3/M4 and M5/M3 ratios of isotopologues in GSCs with/out MSC mitochondria. Mean + SEM. Two-tailed unpaired t tests; ***, P < 0.001. Colors refer to the number of carbon originating from [U-13C]-glucose (A, B) and [U-13C]-glutamine (C).
FIGURE 6
FIGURE 6
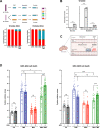
MSC mitochondria induce a higher orotate turnover in GSCs which supports resistance to TMZ. A and B, [U-13C]-glucose and [U-13C]-glutamine orotate isotope profiling in GSCs with and/or without MSC mitochondria and treated or not with TMZ (48 hours; n = 3). Mean + SEM. Statistical analysis by Student t test. ***, P < 0.001. C, Schematic of BRQ inhibition of DHODH-dependent orotate production (BioRender). D, Effect of BRQ (100 nmol/L) on the survival of GSCs (GB4 and GB5, from 2 donors) to TMZ treatment (50 μmol/L) following acquisition of MSC mitochondria (3 MSC donors for each GSC). Two-way ANOVA, *, P < 0.05; **, P < 0.01; ***, P < 0.001; n = 4, each dot represents a culture well.
FIGURE 7
FIGURE 7
Metabolomics analysis of resected GBM from patients, pre- and post-TMZ treatment shows increased nucleotides concentrations. A, Metabolomics analysis were performed on GBM resected tumors from 8 patients, before treatment and after radiotherapy and several cycles ( to 13) of TMZ treatment. B, MRI profiles and H&E-stained tissue sections of the analyzed GBM tumors, before and after TMZ treatment. Tumor areas at first and second resections are framed. Scale bar, 100 μm. C, Mass spectrometry metabolomics analysis of the resected GBM. The C12/C13 metabolite ratios normalized to tissue protein concentrations are indicated. Out of the 8 patients, 6 followed a similar trend (solid lines), while 2 followed an opposite trend (dotted lines). Statistical analysis by ratio paired Student t test (AMP, GMP, UMP) and Wilcoxon matched-pairs signed-rank test (CMP) on metabolomics data from the 6 patients.

References

    1. Stupp R, Mason WP, van den Bent MJ, Weller M, Fisher B, Taphoorn MJB, et al. . Radiotherapy plus concomitant and adjuvant temozolomide for glioblastoma. N Engl J Med 2005;352:987–96. - PubMed
    1. Schaff LR, Mellinghoff IK. Glioblastoma and other primary brain malignancies in adults: a review. JAMA 2023;329:574–87. - PMC - PubMed
    1. Horbinski C, Nabors LB, Portnow J, Baehring J, Bhatia A, Bloch O, et al. . NCCN guidelines® insights: central nervous system cancers, version 2.2022. J Natl Compr Canc Netw 2023;21:12–20. - PubMed
    1. MacLeod G, Bozek DA, Rajakulendran N, Monteiro V, Ahmadi M, Steinhart Z, et al. . Genome-wide CRISPR-cas9 screens expose genetic vulnerabilities and mechanisms of temozolomide sensitivity in glioblastoma stem cells. Cell Rep 2019;27:971–86. - PubMed
    1. Osuka S, Van Meir EG. Overcoming therapeutic resistance in glioblastoma: the way forward. J Clin Invest 2017;127:415–26. - PMC - PubMed

Publication types