. 2023 May 25;3(5):917-932.
doi: 10.1158/2767-9764.CRC-22-0265. eCollection 2023 May.

Reprogramming of Tumor-reactive Tumor-infiltrating Lymphocytes to Human-induced Pluripotent Stem Cells

Affiliations

Reprogramming of Tumor-reactive Tumor-infiltrating Lymphocytes to Human-induced Pluripotent Stem Cells

S M Rafiqul Islam et al. Cancer Res Commun. .

Abstract

Tumor-infiltrating lymphocytes (TIL) that can recognize and kill tumor cells have curative potential in subsets of patients treated with adoptive cell transfer (ACT). However, lack of TIL therapeutic efficacy in many patients may be due in large part to a paucity of tumor-reactive T cells in TIL and the exhausted and terminally differentiated status of those tumor-reactive T cells. We sought to reprogram exhausted TIL that possess T-cell receptors (TCR) specific for tumor antigens into induced pluripotent stem cells (iPSC) to rejuvenate them for more potent ACT. We first attempted to reprogram tumor neoantigen-specific TIL by αCD3 Ab prestimulation which resulted in failure of establishing tumor-reactive TIL-iPSCs, instead, T cell-derived iPSCs from bystander T cells were established. To selectively activate and enrich tumor-reactive T cells from the heterogenous TIL population, CD8+ PD-1+ 4-1BB+ TIL population were isolated after coculture with autologous tumor cells, followed by direct reprogramming into iPSCs. TCR sequencing analysis of the resulting iPSC clones revealed that reprogrammed TIL-iPSCs encoded TCRs that were identical to the pre-identified tumor-reactive TCRs found in minimally cultured TIL. Moreover, reprogrammed TIL-iPSCs contained rare tumor antigen-specific TCRs, which were not detectable by TCR sequencing of the starting cell population. Thus, reprogramming of PD-1+ 4-1BB+ TIL after coculture with autologous tumor cells selectively generates tumor antigen-specific TIL-iPSCs, and is a distinctive method to enrich and identify tumor antigen-specific TCRs of low frequency from TIL.

Significance: Reprogramming of TIL into iPSC holds great promise for the future treatment of cancer due to their rejuvenated nature and the retention of tumor-specific TCRs. One limitation is the lack of selective and efficient methods for reprogramming tumor-specific T cells from polyclonal TIL. Here we addressed this limitation and present a method to efficiently reprogram TIL into iPSC colonies carrying diverse tumor antigen reactive TCR recombination.


Figures

FIGURE 1
FIGURE 1
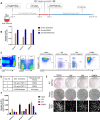
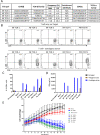
TCR stimulation is necessary for T cells to be reprogrammed to T-iPSCs. A, Schematic representation of PBMC derived T-cell reprogramming into iPSC. Whole PB T cells or the sorted populations were stimulated by αCD3/28 beads, and transduced with Sendai virus containing four Yamanaka factors and SV40 large T antigen. Approximately after 20–25 days’ culture in iPSC culture condition, the number of established iPSC colonies were counted. B, A bar graph indicates the numbers of AP-positive ES cell-like iPSC colonies derived from 1E+5 T cells with or without TCR stimulation. N = 3 for each donor. SeV containing four Yamanaka factors (OSKM) or OSKM and SV40 were used. C, Gating strategy to sort four subsets of CD8+ T cells (Naïve, CM, EM, and EMRA). PBMC were stained by antibodies against CD3, CD8, CD62L, CD45RO, CCR7, and CD45RA. CD8+ T cells were first gated on the basis of CD45RO and CD62L expression, followed by the second gate based on CD45RA and CCR7 expression. Four subsets of CD8+ T cells (Naïve, CM, EM, and EMRA) were sorted according to the gates indicated in the flow cytometry panels. D, A summary table showing which subset (Naïve, CM, EM, and EMRA) were reprogrammed to iPSCs by different stimulation methods. Sorted CD8+ T-cell subsets (Naïve, CM, EM, and EMRA) were stimulated by different methods (OKT-3 or αCD3/28 beads) before SeV infection. E, Representative AP, phase contrast, and bright field images were shown to describe the methods of iPSC colonies enumeration from different subsets (Naïve, CM, EM, and EMRA) of CD8 T cells reprogrammed into iPSC in each experiments following transduction of Sendai virus containing four Yamanaka factors and SV40 large T antigen. Each well was seeded with 1E+5 T cells. F, A bar graph indicates the numbers of AP-positive ES cell-like colonies derived from 1E+5 sorted CD8+ naïve/CM/EM/EMRA T cells activated by αCD3/28 beads. N = 3 for each donor.
FIGURE 2
FIGURE 2
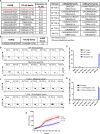
Nonspecific TCR stimulation by αCD3 Ab is not suitable for selective reprogramming of tumor-reactive T cells. A, A summary table of top 10 frequent TCRβ sequences in the starting cells, that is, expanded TIL of patient 4069, indicating the CDR3β amino acid sequence, Vβ family and frequency. The most frequent TCR was the patient's neoantigen-specific TCR (indicated in red). B, A summary table of TCRβ sequences of established TIL-iPSCs by αCD3 Ab stimulation, indicating the CDR3β amino acid sequence, Vβ family and the number of TIL-iPSC clones established. C, A summary table of six candidate TCR pairs including five newly found TCRs (NF TCR 1–5) and one PIR-TCR which were sequenced individually from master tube 6 containing 14 individual iPSC clones. The table indicates TCR pairs, CDR3β sequence, Vβ family, CDR3α sequence, and Vα family. NF, newly found TCR (unknown reactivity); PIR, preidentified reactive TCR. D and E, CD137 (4-1BB) upregulation assay of T cells transduced with candidate TCRα and TCRβ pairs identified from TIL-iPSCs (Fig. 2C). T cells were cocultured with autologous DC pulsed with wild-type (WT) peptide (16 mer or 9 mer) or mutant peptide (9 mer). D shows the representative FACS plots and E shows the percentage of 4-1BB+ cells in each condition. Representative data of three independent experiments from 3 different healthy donor T cells. Mock indicates empty vector transduced T cells used as negative control. F and G, CD137 (4-1BB) upregulation assay of T cells transduced with candidate TCRα and TCRβ pairs identified from TIL-iPSCs (Fig. 2C). T cells were cocultured with autologous, or HLA-matched allogeneic tumor cells derived from the PDXs model. F shows the representative FACS plots and G shows the percentage of 4-1BB+ cells in each condition. Representative data of three independent experiments from 3 different healthy donor T cells. Mock indicates empty vector transduced T cells used as negative control. H, A graph showing the real-time cell growth monitoring (cell count/image) of RFP-overexpressed PDX-derived tumor cell line cultured with T cells transduced with PIR-TCR analyzed by the Incucyte live imaging and analysis system (effector-to-target ratio of 2:1). Empty vector transduced T cells (Mock) and tumor cell alone (TC) were used as negative controls. The results are shown as mean ± SD (N = 4).
FIGURE 3
FIGURE 3
TIL-tumor cell coculture resulted in establishment of TIL-iPSCs from tumor-reactive T-cell clones. A, Schematic representation of TIL-tumor cell coculture to isolate tumor-reactive T cells and subsequent reprogramming into iPSCs. Autologous tumor cell line and minimally cultured TIL were cocultured for 16 hours, sorted for PD1+ 4-1BB+ CD8+ T cells, and transduced with Sendai virus containing four Yamanaka factors and SV40 large T antigen. On days 20–21 when cells formed domed shaped ES cell-like colonies, they were individually collected as clones and expanded. B, A summary table of nine different TCRs identified from 13 different master tubes containing 221 TIL-iPSC clones by using immunosequencing analysis. CDR3β amino acid sequence, Vβ family, frequency in bulk (before coculture in starting material) and in sorted PD1+ 4-1BB+ (DP) population, enrichment (DP/Bulk), the least number of iPSC clones established and the type of TCR were noted. PIR, preidentified reactive TCR; NF, newly found TCR (unknown reactivity). C, A summary table of the TCRβ sequence analysis of six preidentified tumor-reactive TCRs (PIR-TCR I–VI) indicating the CDR3β amino acid sequence, Vβ family, frequency in bulk (before coculture) and in the sorted PD1+ 4-1BB+ (DP) population after TIL-tumor cell coculture, enrichment (DP/Bulk) and presence in established iPSC clones. * means the TCR was not found in established T-iPSC clones but detected in the remaining clones in the dish after picking up iPS cell colonies (mother dish). D, A graph indicates the frequency of PIR-TCRs in starting cells (Bulk) and in sorted PD1+ 4-1BB+ (DP) cells. E, A bar graph indicates the enrichment analysis (the ratio of DP/Bulk) of those six PIR-TCRs.
FIGURE 4
FIGURE 4
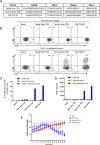
TIL stimulated with autologous tumor cell line generated antigen specific iPSC whereas αCD3/28 beads mediated stimulation did not. A, Summary of three candidate TCR pairs identified in TIL-iPSC lines established by different stimulation methods. Bead Stim TCR: The most dominant clone in the TIL-iPSCs established by αCD3/28 beads stimulation, Tumor Stim TCR: The TCR identified in the TIL-iPSC clones established by coculture with autologous tumor cells (TCR 4 in Fig. 3B), and PIR-TCR III: preidentified reactive TCR clone detected in the TIL-iPSC clones established by coculture with autologous tumor cells. The table includes TCR type, CDR3β amino acid sequences, Vβ family, CDR3α amino acid sequences, Vα family are described. B and C, CD137 (4-1BB) upregulation assay of T cells transduced with candidate TCRα and TCRβ pairs identified from TIL-iPSCs (Fig. 4A). T cells were cocultured with autologous or allogeneic tumor cell lines. B shows the representative FACS plots and C shows the percentage of 4-1BB+ cells in each condition. N = 3 for each condition. Representative data of four independent experiments. Mock: empty vector transduced PBL as a negative control, PIR-TCR III as a positive control. D, A bar graph showing the results of ELISA IFNγ production assay of T cells transduced with candidate TCRα and TCRβ pairs identified from TIL-iPSCs (Fig. 4A). T cells were cocultured with autologous or allogeneic tumor cell lines for 16 hours and culture soup were analyzed for IFNγ by ELISA. N = 3 for each condition. Representative data of four independent experiments. E, A graph showing the real-time cell growth monitoring (cell count/image) of RFP-overexpressed tumor cells from pt. 1913 cocultured with different TCRs (listed in Fig. 4A), analyzed by the Incucyte live imaging and analysis system at effector-to-target ratio of 2:1. Mock indicates empty vector transduced T cells used as a negative control. The results are shown as the mean ± SD of N = 4 each condition. A representative data of four independent experiments.
FIGURE 5
FIGURE 5
TIL-tumor cell coculture activated tumor-reactive T cells and generated tumor-reactive TIL-iPSCs from TIL of patient 3784. A, FACS panels showing the gating strategy to sort PD1+ 4-1BB+ CD8+ T cells after TIL-tumor cell coculture. Top panel shows the phenotype of TIL without coculture. Dump gate is a mixture of different T lineage markers (CD25, CD56, and TCRγδ) to exclude regulatory T cells (CD25+), natural killer cells (CD56+), and gamma-delta T cells (TCRγδ+). B, A summary table of the TCRβ sequence of eight preidentified tumor-reactive TCRs indicating their CDR3β amino acid sequence, Vβ family, frequency in bulk (before coculture) and in sorted PD1+ 4-1BB+ (DP) population, enrichment (DP/bulk) and presence in established iPSC clones. C, A bar graph showing the relative frequency of TCR clones, which were present in bulk population (starting cells) and reprogrammed to iPSCs, in four sorted populations [PD1 4-1BB (DN), PD1+ 4-1BB (PD1+ SP), PD1 4-1BB+ (4-1BB+ SP), PD1+ 4-1BB+ (DP)] after TIL-tumor cell coculture relative to bulk frequency of each TCR clone before coculture. Please see Supplementary Table S1 for the details of the TCR clones (TCR 2, 3, 6, 9, 11, 12, 15, and 17).
FIGURE 6
FIGURE 6
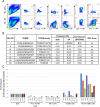
T cells with tumor-reactive TCRs of extremely low frequency were reprogrammed to TIL-iPSCs. A, Summary of five candidate TCR pairs including four newly found TCRs (NF TCR 1–4) and one PIR-TCR (IV) identified in TIL-iPSCs which were sequenced individually. The table includes CDR3 amino acid sequences of α and β chains, Vα family, Vβ family, and immunosequencing analysis of TCRβ which contains frequency in bulk (before coculture) and in sorted DP population after coculture, and enrichment (DP/Bulk). B and C, CD137 (4-1BB) upregulation assay of T cells transduced with candidate TCRα and TCRβ pairs identified from TIL-iPSCs (Fig. 6A). T cells were cocultured with autologous or allogeneic tumor cell lines. B shows the representative FACS plots and C shows the percentage of 4-1BB+ cells in each condition. Representative data of four independent experiments. Control PBL; no transgene, Mock indicates empty vector transduced T cells used as a negative control, TIL; expanded TIL containing tumor-reactive T cells. D, A bar graph showing the results of ELISA IFNγ production assay of T cells transduced with candidate TCRα and TCRβ pairs identified from TIL-iPSCs (A). T cells were cocultured with autologous or allogeneic tumor cell lines for 16 hours and culture soup were analyzed for IFNγ by ELISA (N = 3). Representative data of four independent experiments. E, A graph showing the real-time cell growth monitoring (cell count/image) of RFP-overexpressed tumor cells from pt-3784 cocultured with different TCRs (listed in A), analyzed by the Incucyte live imaging and analysis system in an effector-to-target ratio of 2:1. Mock indicates empty vector transduced T cells used as a negative control; TC only indicates tumor cells alone, and four newly found candidate TCRs (NF TCR 1–4) and a PIR-TCR IV were used for coculture and their antitumor properties were measured over 72 hours time period. The results are shown as mean ± SD of N = 4 each condition. A representative data of four independent experiments.

References

    1. Rosenberg SA, Dudley ME. Adoptive cell therapy for the treatment of patients with metastatic melanoma. Curr Opin Immunol 2009;21:233–40. - PMC - PubMed
    1. Besser MJ, Shapira-Frommer R, Itzhaki O, Treves AJ, Zippel DB, Levy D, et al. . Adoptive transfer of tumor-infiltrating lymphocytes in patients with metastatic melanoma: intent-to-treat analysis and efficacy after failure to prior immunotherapies. Clin Cancer Res 2013;19:4792–800. - PubMed
    1. Andersen R, Donia M, Ellebaek E, Borch TH, Kongsted P, Iversen TZ, et al. . Long-lasting complete responses in patients with metastatic melanoma after adoptive cell therapy with tumor-infiltrating lymphocytes and an attenuated IL2 regimen. Clin Cancer Res 2016;22:3734–45. - PubMed
    1. Sarnaik A, Khushalani NI, Chesney JA, Kluger HM, Curti BD, Lewis KD, et al. . Safety and efficacy of cryopreserved autologous tumor infiltrating lymphocyte therapy (LN-144, lifileucel) in advanced metastatic melanoma patients who progressed on multiple prior therapies including anti-PD-1. J Clin Oncol 37: 15s, 2019. (suppl; abstr 2518).
    1. Rosenberg SA, Restifo NP. Adoptive cell transfer as personalized immunotherapy for human cancer. Science 2015;348:62–8. - PMC - PubMed

Publication types

MeSH terms

Substances