. 2023 May 3;3(5):763-779.
doi: 10.1158/2767-9764.CRC-22-0396. eCollection 2023 May.

Ultra High-plex Spatial Proteogenomic Investigation of Giant Cell Glioblastoma Multiforme Immune Infiltrates Reveals Distinct Protein and RNA Expression Profiles

Affiliations

Ultra High-plex Spatial Proteogenomic Investigation of Giant Cell Glioblastoma Multiforme Immune Infiltrates Reveals Distinct Protein and RNA Expression Profiles

Shilah A Bonnett et al. Cancer Res Commun. .

Abstract

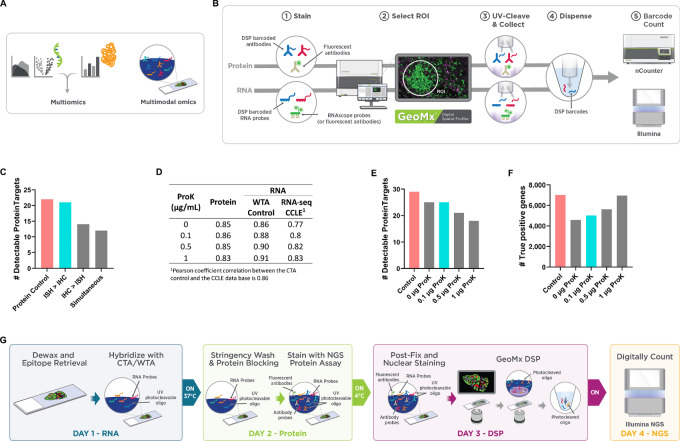
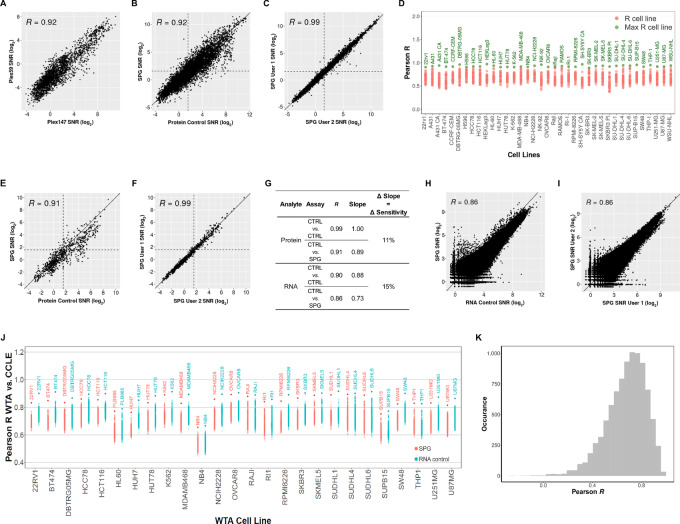
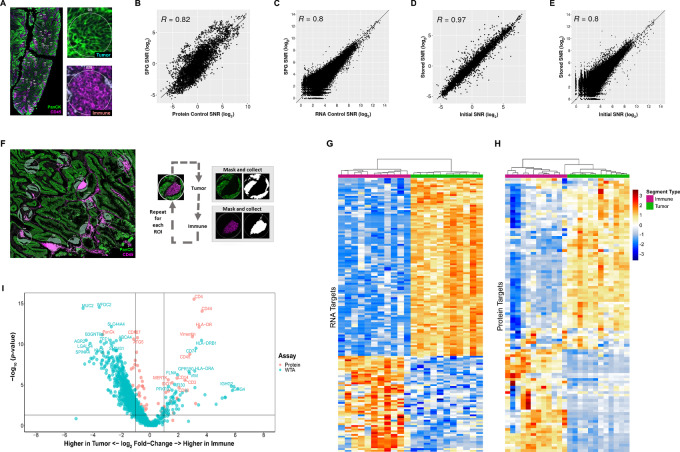
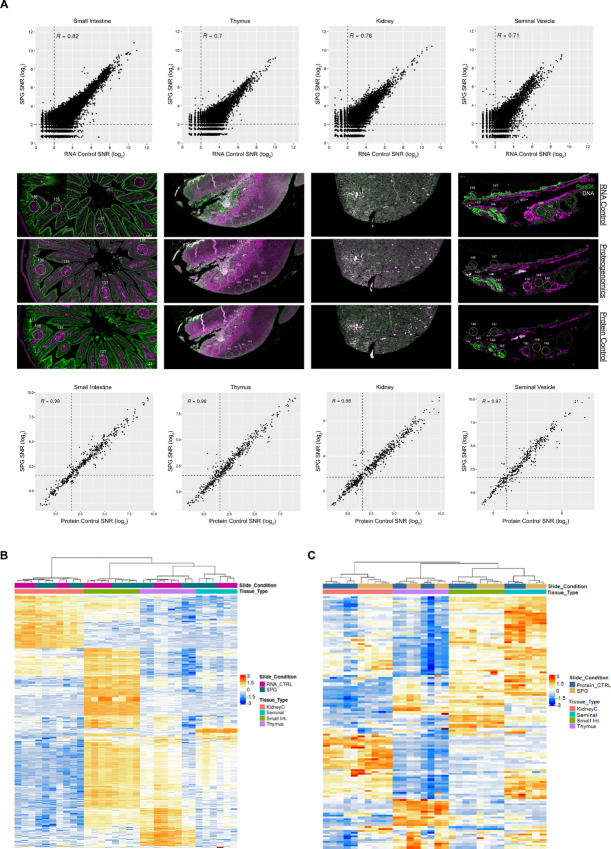
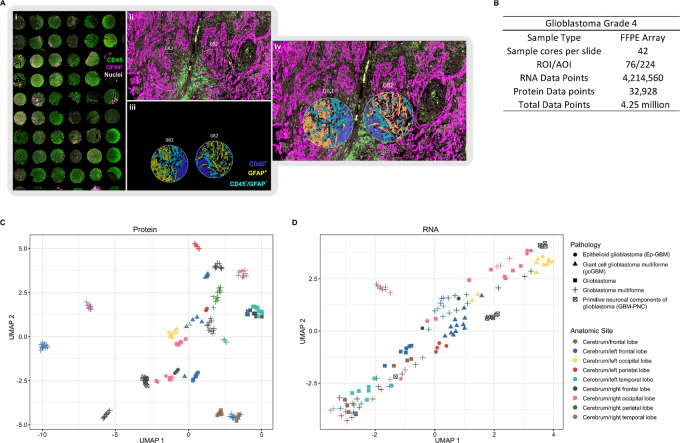
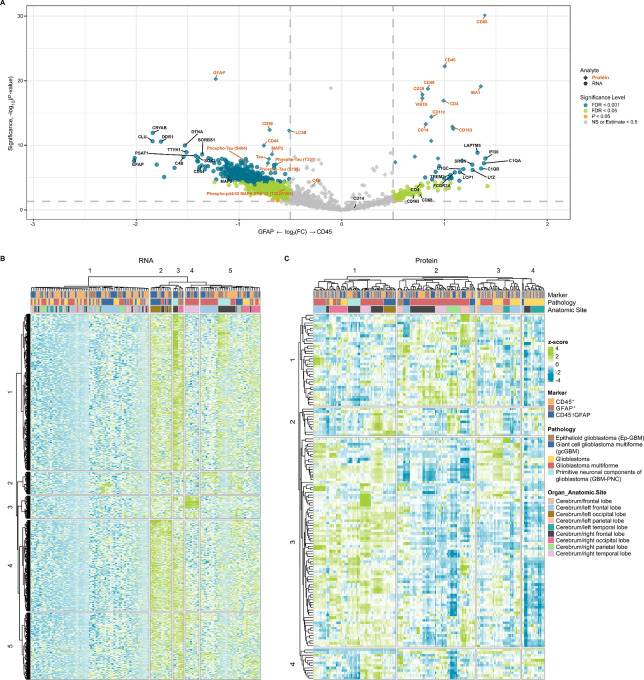
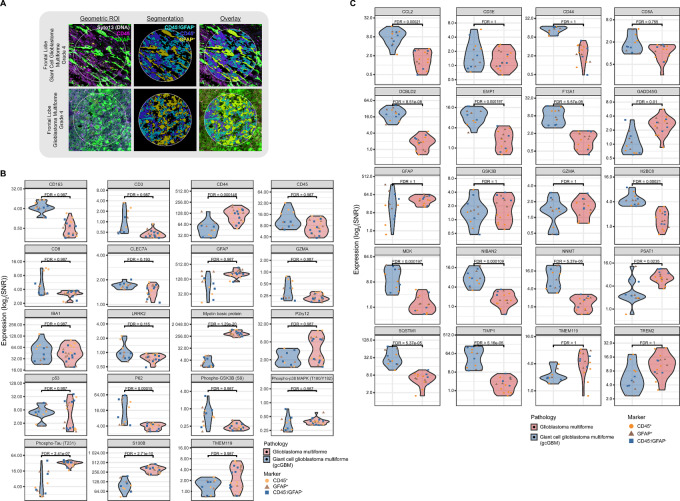
A deeper understanding of complex biological processes, including tumor development and immune response, requires ultra high-plex, spatial interrogation of multiple "omes". Here we present the development and implementation of a novel spatial proteogenomic (SPG) assay on the GeoMx Digital Spatial Profiler platform with next-generation sequencing readout that enables ultra high-plex digital quantitation of proteins (>100-plex) and RNA (whole transcriptome, >18,000-plex) from a single formalin-fixed paraffin-embedded (FFPE) sample. This study highlighted the high concordance, R > 0.85 and <15% change in sensitivity between the SPG assay and the single-analyte assays on various cell lines and tissues from human and mouse. Furthermore, we demonstrate that the SPG assay was reproducible across multiple users. When used in conjunction with advanced cellular neighborhood segmentation, distinct immune or tumor RNA and protein targets were spatially resolved within individual cell subpopulations in human colorectal cancer and non-small cell lung cancer. We used the SPG assay to interrogate 23 different glioblastoma multiforme (GBM) samples across four pathologies. The study revealed distinct clustering of both RNA and protein based on pathology and anatomic location. The in-depth investigation of giant cell glioblastoma multiforme (gcGBM) revealed distinct protein and RNA expression profiles compared with that of the more common GBM. More importantly, the use of spatial proteogenomics allowed simultaneous interrogation of critical protein posttranslational modifications alongside whole transcriptomic profiles within the same distinct cellular neighborhoods.

Significance: We describe ultra high-plex spatial proteogenomics; profiling whole transcriptome and high-plex proteomics on a single FFPE tissue section with spatial resolution. Investigation of gcGBM versus GBM revealed distinct protein and RNA expression profiles.


Figures

FIGURE 1
FIGURE 1
Technical development of the SPG assay. A, Current proteogenomic approaches are multiomic which entails the integration of individual -omic datasets and multimodal omics which involves the simultaneous, codetection of multiple “omes” in a single sample. B, Commercially available GeoMx Assays currently enable high-plex, spatially resolved protein and RNA targets on individual tissue sections with nCounter or NGS quantitative readout. C, Assessment of staining order on the number of protein targets above detection threshold (SNR ≥ 3). FFPE cell line, A431CA, was stained with GeoMx Protein assays (59-plex) for nCounter readout and mock RNA probe (Buffer R only). D, Assessment of varying ProK on the performance of the SPG assay. A 45-CPA was stained with 59-plex GeoMx NGS Protein modules (59-plex) and the GeoMx Whole Transcriptome Atlas (WTA) under proteogenomic and standard assay conditions. E, Plots represent the number of targets above the detection threshold for Pearson correlation on log2-transformed SNR data between the proteogenomic assay and the single-analyte controls along with the CCLE RNA-seq database. Circular ROIs of 200 μm diameter were selected for detailed molecular profiling with the GeoMx DSP. The signal was averaged across replicate AOIs and the SNR was calculated. Protein (SNR ≥ 3; E) and true positives (F) in detectable WTA targets. G, GeoMx SPG workflow enables multimodal omic profiling on a single slide.
FIGURE 2
FIGURE 2
Assessment of SPG data quality versus the respective RNA and Protein control data. Assay correlation with respect to the protein analyte comparing 147-plex and 59-plex protein panel (A), protein control and proteogenomic workflows (B), and user-to-user and instrument-to-instrument reproducibility (C). D, Cell line to cell line comparison of protein control with proteogenomic protein data. For protein targets with SNR ≥ 3, the Pearson R was calculated between each cell line from the Protein Control slide against all the cell lines in the SPG slide. The max R cell line between the SPG and Protein control is labeled and highlighted green. Assay correlation of 17 phospho-specific antibodies between protein control and proteogenomic workflows (E) and user-to-user and instrument-to-instrument reproducibility (F). G, Assay correlation with respect to the RNA analyte comparing summary of Pearson R, the slope of linear regression, and change in sensitivity between workflows. The change in sensitivity corresponds to the average change in regression line slope between the SPG and the single-analyte control assay. RNA control and proteogenomic workflows (H) and user-to-user and instrument-to-instrument reproducibility (I). J, Cell line to cell line comparison of WTA control and proteogenomic WTA data to the entire CCLE RNA-seq dataset. For all overlapping targets between the CCLE and WTA data, the Pearson R in the protein control and SPG WTA data were calculated against all cell lines in the CCLE RNA-seq. Cell line labels in the plot correspond to SPG or GeoMx WTA cell lines with the highest R correlation to the CCLE data. K, Target-to-target comparison of WTA control to proteogenomic WTA data. For each RNA target with SNR ≥ 4, the Pearson R was calculated between WTA control log2 SNR transformed data and the respective proteogenomic WTA log2 SNR transformed data. Histogram shows the distribution of Pearson R.
FIGURE 3
FIGURE 3
Assessment of SPG performance on human tissue. FFPE colorectal cancer sections were stained with the GeoMx NGS Human Protein modules (147-plex), WTA, and antibodies against PanCK (Tumor) and CD45 (Immune). A, Representative image of colorectal cancer sample used in the assessment of SPG data quality versus the respective RNA and Protein control data. Two ROIs showing strong enrichment of immune cells (CD45; magenta) and tumor cells (PanCK, green). Concordance between the proteogenomic assay and single analyte protein (B) and RNA controls (C). Concordance between the initial and stored proteogenomic slide for protein (D) and RNA analytes (E). F, Multiplexed protein and RNA characterization of colorectal cancer sample with representative images highlighting the segmentation of 300 μm circular ROIs into tumor- (PanCK+) and immune- (CD45+) enriched regions. Segments illuminated in white were collected, black regions were not. Protein targets with SNR ≥ 3 and WTA RNA targets with SNR ≥ 4 were used in the analysis. Unsupervised hierarchical clustering of top 250 differentially expressed RNA (G) and detect protein targets for colorectal cancer (H). I, Combined volcano plot of Protein and RNA expression in colorectal cancer. A subset of differentially expressed genes is labeled with colors matching their analyte.
FIGURE 4
FIGURE 4
Spatial proteogenomics across mouse tissue types. High-plex SPG characterization of mouse tissues with matched circular ROIs. FFPE sections were stained with GeoMx Mouse WTA (RNA control), 15-stacked GeoMx Mouse Protein Modules (137-plex; protein control), or both analytes simultaneously with the SPG workflow. A, Concordance and representative images of mouse tissue used in the assessment of the SPG versus the respective RNA (top) and protein (bottom) control. Unsupervised hierarchical clustering of top 400 expressing RNA targets with an SNR ≥ 4 (B) and detected protein targets (SNR ≥ 3; C) across all tissue types.
FIGURE 5
FIGURE 5
SPG exploration of GBM grade 4. A, A total of 42 cores across 23 distinct sample sources and multiple GBM types. ROIs were segmented into CD45+, GFAP+, or CD45/GFAP. B, Statistics from a single slide and single GeoMx SPG run. UMAP plots for protein (C) and RNA analytes (D).
FIGURE 6
FIGURE 6
DE analysis between GFAP- and CD45-enriched segments. A, Combined volcano plot resulting from the DE analysis between GFAP- and CD45-enriched segments for RNA (●) and protein (◆) analytes. Targets with significant DE are highlighted either orange (P < 0.05), green (FDR < 0.05) or blue (FDR < 0.001); whereas targets in gray show no significant difference in expression. A subset of differentially expressed targets is labeled. Unsupervised hierarchical clustering analysis of detected RNA (B) and protein (C).
FIGURE 7
FIGURE 7
SPG exploration of gcGBM and GBM. A, Representative images of ROIs segmented into CD45+, GFAP+, or CD45/GFAP. Top differentially expressed protein targets (B) and RNA targets (C) from frontal lobe gcGBM as compared with GBM, all grade 4.

References

    1. Hickey JW, Neumann EK, Radtke AJ, Camarillo JM, Beuschel RT, Albanese A, et al. Spatial mapping of protein composition and tissue organization: a primer for multiplexed antibody-based imaging. Nat Methods 2022;19:284–95. - PMC - PubMed
    1. Nusinow DP, Szpyt J, Ghandi M, Rose CM, McDonald ER, Kalocsay M, et al. Quantitative proteomics of the cancer cell line encyclopedia. Cell 2020;180:387–402. - PMC - PubMed
    1. Vogel C, Marcotte EM. Insights into the regulation of protein abundance from proteomic and transcriptomic analyses. Nat Rev Genet 2012;13:227–32. - PMC - PubMed
    1. Edfors F, Danielsson F, Hallström BM, Käll L, Lundberg E, Pontén F, et al. Gene-specific correlation of RNA and protein levels in human cells and tissues. Mol Syst Biol 2016;12:883. - PMC - PubMed
    1. Liu Y, Beyer A, Aebersold R. On the dependency of cellular protein levels on mRNA abundance. Cell 2016;165:535–50. - PubMed