. 2023 Jun 12:4:1205456.
doi: 10.3389/fresc.2023.1205456. eCollection 2023.

Emergence of functionally aberrant and subsequent reduction of neuromuscular connectivity and improved motor performance after cervical spinal cord injury in Rhesus

Affiliations

Emergence of functionally aberrant and subsequent reduction of neuromuscular connectivity and improved motor performance after cervical spinal cord injury in Rhesus

Gregory Wai et al. Front Rehabil Sci. .

Abstract

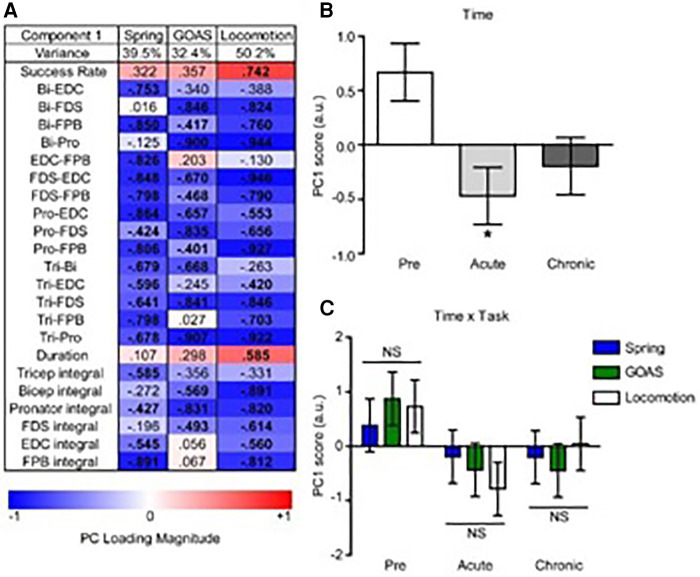
Introduction: The paralysis that occurs after a spinal cord injury, particularly during the early stages of post-lesion recovery (∼6 weeks), appears to be attributable to the inability to activate motor pools well beyond their motor threshold. In the later stages of recovery, however, the inability to perform a motor task effectively can be attributed to abnormal activation patterns among motor pools, resulting in poor coordination.

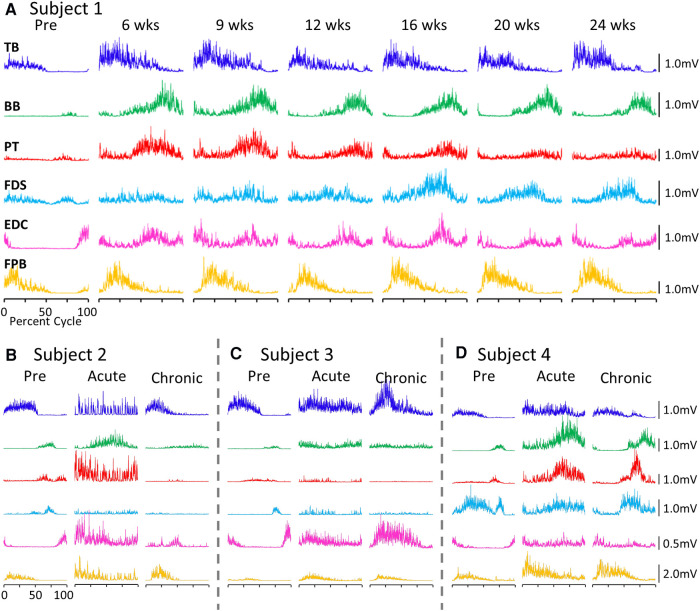
Method: We have tested this hypothesis on four adult male Rhesus monkeys (Macaca mulatta), ages 6-10 years, by recording the EMG activity levels and patterns of multiple proximal and distal muscles controlling the upper limb of the Rhesus when performing three tasks requiring different levels of skill before and up to 24 weeks after a lateral hemisection at C7. During the recovery period the animals were provided routine daily care, including access to a large exercise cage (5' × 7' × 10') and tested every 3-4 weeks for each of the three motor tasks.

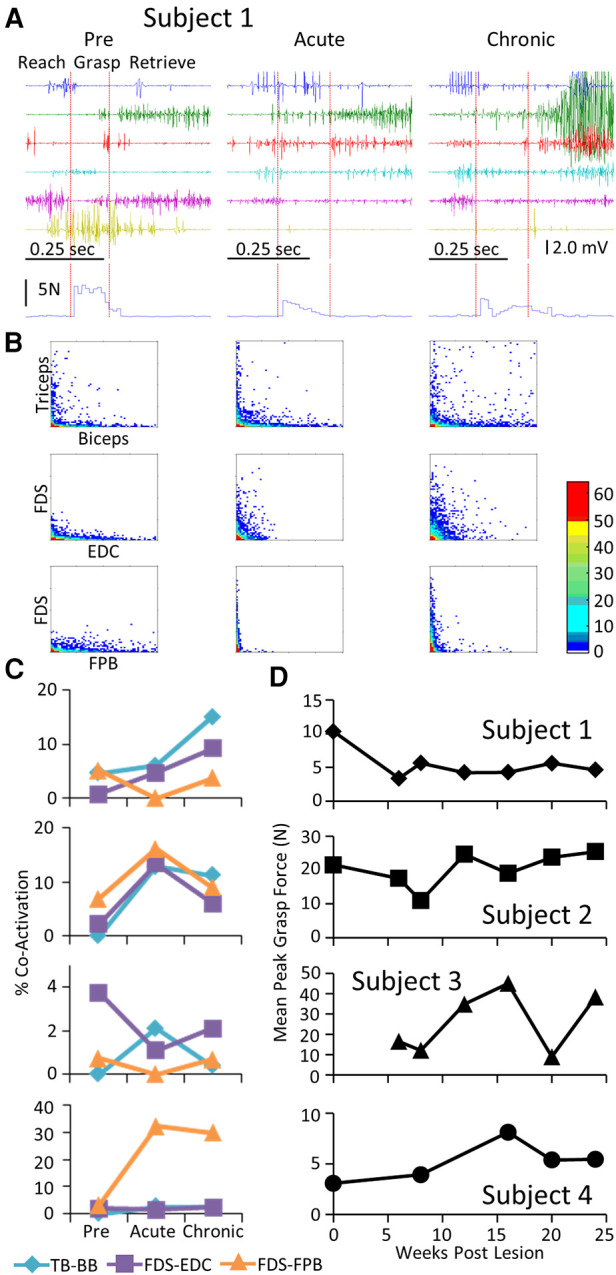
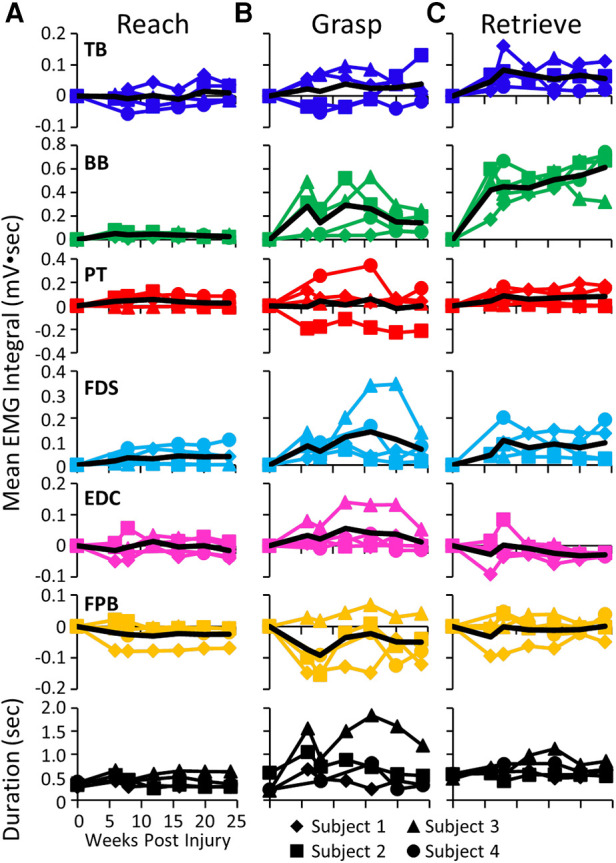
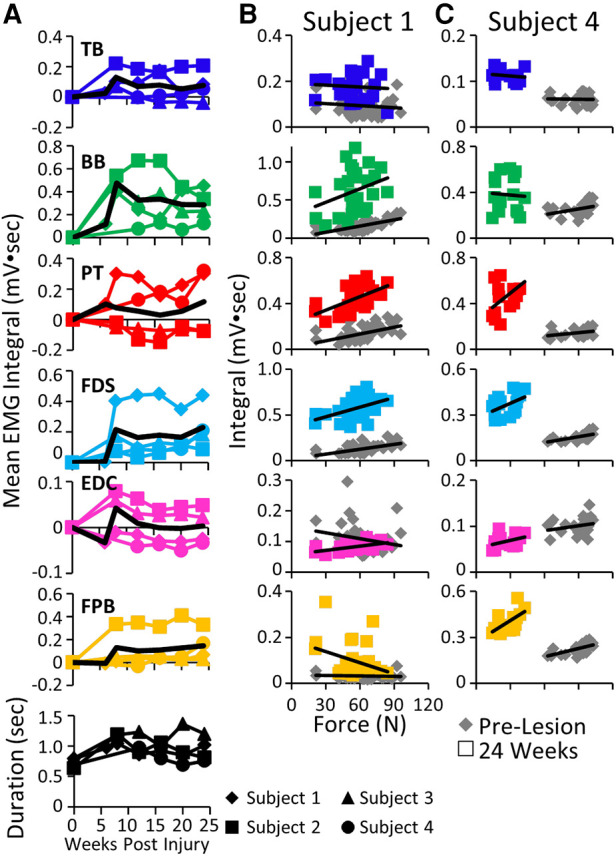
Results: At approximately 6-8 weeks the animals were able to begin to step on a treadmill, perform a spring-loaded task with the upper limb, and reaching, grasping, and eating a grape placed on a vertical stick. The predominant changes that occurred, beginning at ∼6-8 weeks of the recovery of these tasks was an elevated level of activation of most motor pools well beyond the pre-lesion level.

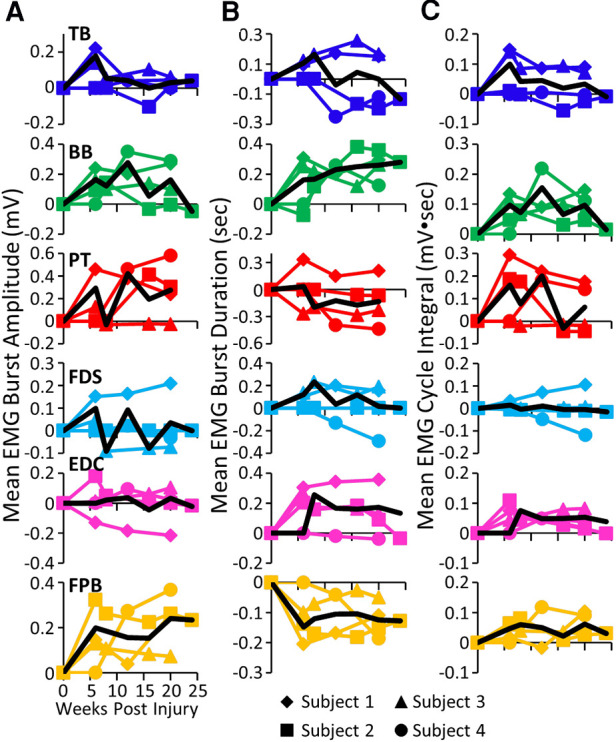
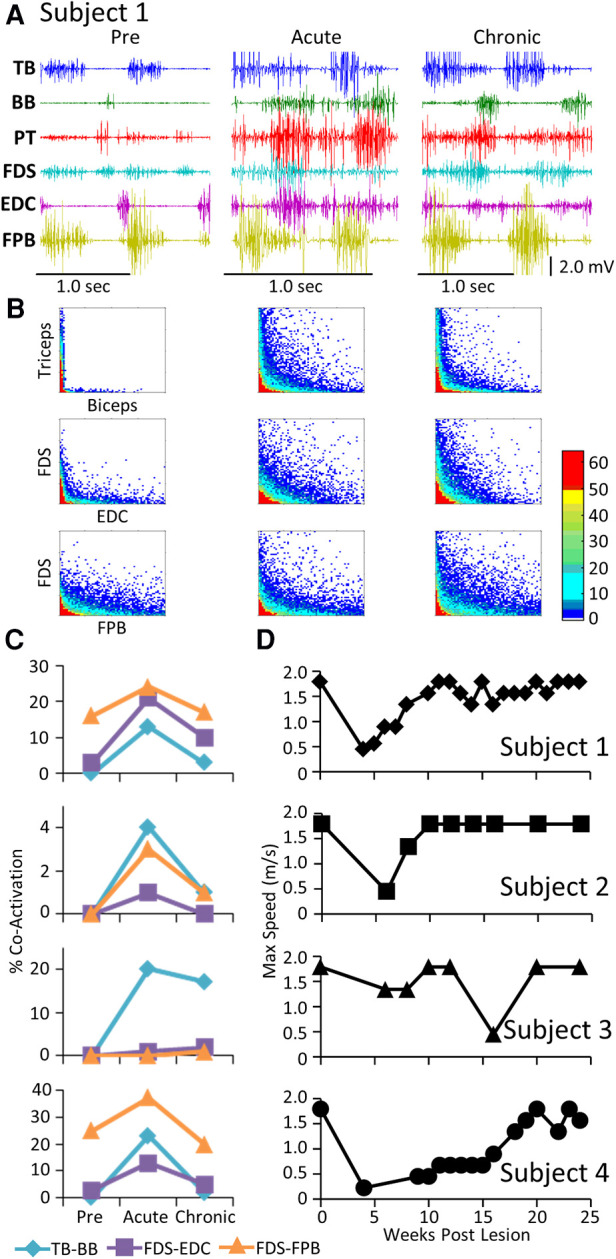
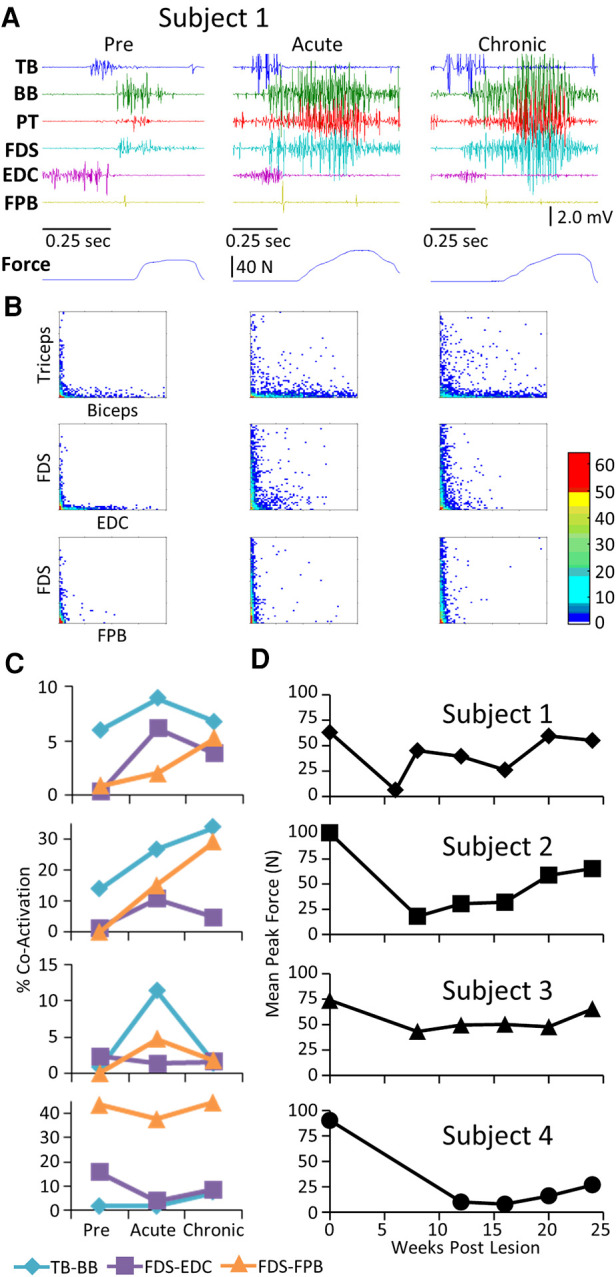
Discussion: As the chronic phase progressed there was a slight reduction in the EMG burst amplitudes of some muscles and less incidence of co-contraction of agonists and antagonists, probably contributing to an improved ability to selectively activate motor pools in a more effective temporal pattern. Relative to pre-lesion, however, the EMG patterns even at the initial stages of recovery of successfully performing the different motor tasks, the level of activity of most muscle remained higher. Perhaps the most important concept that emerges from these data is the large combinations of adaptive strategies in the relative level of recruitment and the timing of the peak levels of activation of different motor pools can progressively provide different stages to regain a motor skill.

Keywords: EMG; motor performance; muscle activity patterns; spinal cord injury; spinal plasticity.


Conflict of interest statement

The authors declare that the research was conducted in the absence of any commercial or financial relationships that could be construed as a potential conflict of interest.

Figures

Figure 1
Figure 1
EMG patterns during locomotion. (A) Activation patterns (rectified EMG for ∼10 consistent, consecutive steps) of six upper limb muscles during locomotion on a treadmill at 0.89 m/s pre-lesion and 6 to 24 weeks post-spinal cord hemisection for Subject 1. Similar data for Subjects 2−4 pre-lesion and at an acute stage (6−8 weeks post-lesion) and a chronic (final recording session at 24 weeks post-lesion) stage are shown in (B–D). The beginning of the EMG trace is synchronized with the initiation of stance and all step cycle lengths are normalized. TB, triceps brachii; BB, biceps brachii; PT, pronator teres; FDS, flexor digitorum superficialis; EDC, extensor digitorum communis; FPB, flexor pollicis brevis.
Figure 2
Figure 2
EMG characteristics during locomotion. Mean EMG burst amplitudes (A), durations (B), and integrals (C) and the overall mean (black traces) for each muscle and each subject for each time point. All post-lesion values are normalized to pre-lesion values. Muscle abbreviations, same as in Figure 1.
Figure 3
Figure 3
EMG co-activation and locomotor performance. (A) Examples of raw EMG activity (2 step cycles for each condition) during treadmill locomotion at 0.89 m/s for Subject 1 for the same muscles and at the pre-lesion and an acute and chronic time points post-lesion. (B) Joint probability distributions (see Methods and Materials) of the EMG burst amplitudes between pairs of muscles for the same step cycles shown in (A). The y scales are 2 mv for all plots. (C) Percent co-contraction for each muscle pair at the pre-lesion stage and at an acute and chronic time point post-lesion. (D) Maximum speed of locomotion at each time points for each subject.
Figure 4
Figure 4
EMG characteristics and performance during the GOAS task. Data for Subject 1 while performing retrieval of a grape placed on a stick instrumented for recording 3-D forces imposed while obtaining the grape presented in a similar format to that in Figure 2. The red vertical lines on the raw EMG graphs in (A) divide the task into reach, grasp, and retrieve phases. The resultant of the three force vectors imposed on the stick is shown below the EMG traces. (B). Distribution plot of EMG amplitudes of agonist-antagonists muscles (C) Percent co-contraction for each muscle pair at the pre-lesion stage and at an acute and chronic time point post-lesion. (D) The integral of the force x time for all successful trials for the task for each subject at each time point.
Figure 5
Figure 5
EMG activity during reaching, grasping and retrieving. Mean EMG integrals for each muscle and for each subject and the overall mean EMG integrals (black line) and durations (bottom row) during the reach (A), grasp (B), and retrieve (C) phases of the grape on a stick task. The mean EMG integrals are normalized to pre-lesion values at each time point.
Figure 6
Figure 6
EMG characteristics and performance during the handle pull task. Data for each subject while performing the handle pull task instrumented for recording 3-D forces imposed presented in a similar format to that in Figure 2. Traces of the amount of force generated over the duration of the trial are shown below the raw EMG traces. (B) Joint probability distributions of the EMG burst amplitudes between pairs of muscles for the same step cycles shown in (A). (C) Percent co-contraction for each muscle pair at the pre-lesion stage and at an acute and chronic time point post-lesion. (D) The average peak force during the task for each subject at each time point.
Figure 7
Figure 7
EMG activity and kinetics during the handle pull task. (A) Mean EMG integrals for each muscle and for each subject and the overall mean EMG integrals (black line) and durations (bottom row) during the handle pull task pre-lesion and between 6−24 weeks post-lesion. The mean EMG integrals are normalized to pre-lesion values at each time point. (B) Relationships between individual force values and the corresponding EMG integrals for each muscle for Subject 1 (B) and Subject 4 (C) pre-lesion and at 24 weeks post-lesion.
Figure 8
Figure 8
Multivariate analysis of the recovery of behavioral success and muscle co-contraction post-injury. Non-linear principal component analysis (NLPCA) was performed on time series data from muscle integrals and co-contraction distributions during the recovery of success rate for the spring, grape on a stick (GOAS) and treadmill locomotion tasks. (A) The first principal component (PC1) accounted for a substantial percentage of the variance in each dataset (39.5%, 32.4%, 50.2%, respectively), and generally represents the inverse relationships between the recovery of task success rate and muscle co-contraction and integrals. PC loadings represent the correlations for each variable onto the entire multivariate PC space (shown separately for spring, GOAS and locomotion tasks): red indicates a positive correlation, blue a negative correlation, and bolded PC loadings (>|0.4|). (B) Composite PC scores for each monkey at each time point. A significant main effect of time was found [F(2,27) = 4.396, partial η2 = 0.246, 1 − β = 0.709, p = 0.022], with the acute time point showing a significant decrease compared to pre-injury (p < 0.05), and recovering towards the chronic phase that was not significantly different from pre-injury. (C) Two-way GLM ANOVA showed no significant time by task interaction [F(4,27) = 0.443, partial η2 = 0.062, 1 − β = 0.137, p = 0.777]. Histograms are plotted as mean ± standard error. *p < 0.05. NS, not significant.

Similar articles

Cited by

References

    1. Nout YS, Ferguson AR, Strand SC, Moseanko R, Hawbecker S, Zdunowski S, et al. Methods for functional assessment after C7 spinal cord hemisection in the rhesus monkey. Neurorehabil Neural Repair. (2012) 26(6):556–69. 10.1177/1545968311421934 - DOI - PMC - PubMed
    1. Nout YS, Rosenzweig ES, Brock JH, Strand SC, Moseanko R, Hawbecker S, et al. Animal models of neurologic disorders: a nonhuman primate model of spinal cord injury. Neurotherapeutics. (2012) 9(2):380–92. 10.1007/s13311-012-0114-0 - DOI - PMC - PubMed
    1. Rosenzweig ES, Courtine G, Jindrich DL, Brock JH, Ferguson AR, Strand SC, et al. Extensive spontaneous plasticity of corticospinal projections after primate spinal cord injury. Nat Neurosci. (2010) 13(12):1505–10. 10.1038/nn.2691 - DOI - PMC - PubMed
    1. Alexeeva N, Broton JG, Suys S, Calancie B. Central cord syndrome of cervical spinal cord injury: widespread changes in muscle recruitment studied by voluntary contractions and transcranial magnetic stimulation. Exp Neurol. (1997) 148(2):399–406. 10.1006/exnr.1997.6689 - DOI - PubMed
    1. Bunday KL, Perez MA. Impaired crossed facilitation of the corticospinal pathway after cervical spinal cord injury. J Neurophysiol. (2012) 107(10):2901–11. 10.1152/jn.00850.2011 - DOI - PMC - PubMed