. 2023;75(1):103.
doi: 10.1186/s40623-023-01814-7. Epub 2023 Jun 25.

High-resolution shape models of Phobos and Deimos from stereophotoclinometry

Affiliations

High-resolution shape models of Phobos and Deimos from stereophotoclinometry

Carolyn M Ernst et al. Earth Planets Space. 2023.

Abstract

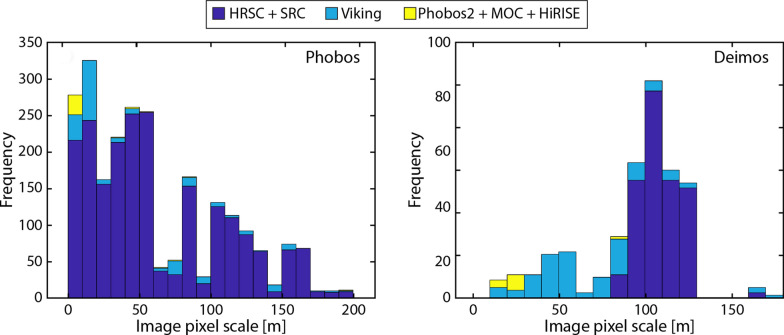
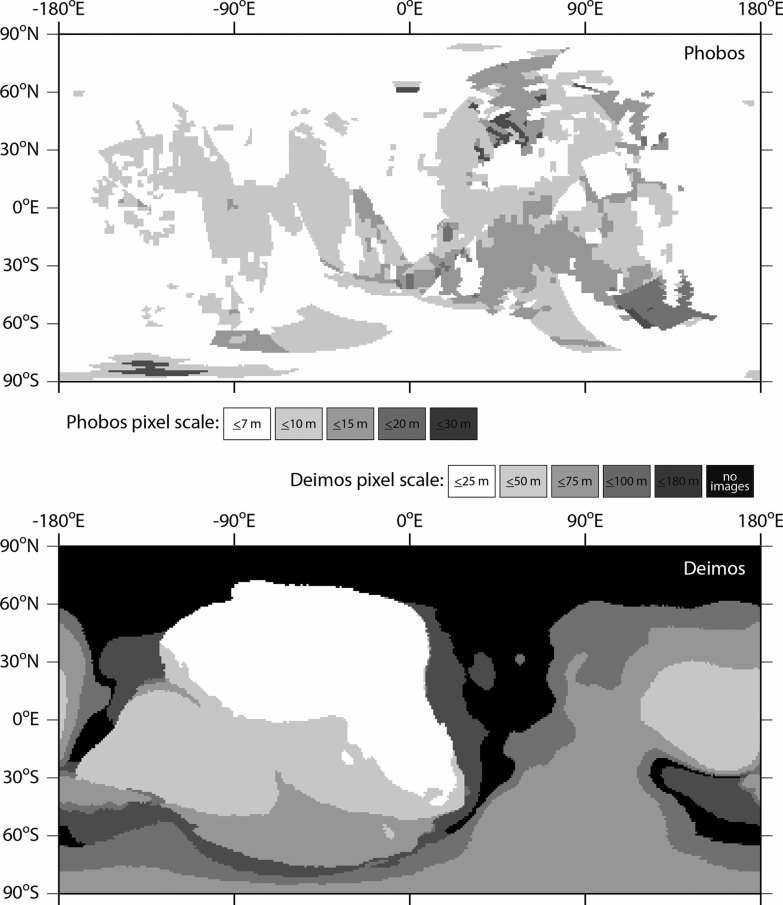
We created high-resolution shape models of Phobos and Deimos using stereophotoclinometry and united images from Viking Orbiter, Phobos 2, Mars Global Surveyor, Mars Express, and Mars Reconnaissance Orbiter into a single coregistered collection. The best-fit ellipsoid to the Phobos model has radii of (12.95 ± 0.04) km × (11.30 ± 0.04) km × (9.16 ± 0.03) km, with an average radius of (11.08 ± 0.04) km. The best-fit ellipsoid to the Deimos model has radii of (8.04 ± 0.08) km × (5.89 ± 0.06) km × (5.11 ± 0.05) km with an average radius of (6.27 ± 0.07) km. The new shape models offer substantial improvements in resolution over existing shape models, while remaining globally consistent with them. The Phobos model resolves grooves, craters, and other surface features ~ 100 m in size across the entire surface. The Deimos model is the first to resolve geological surface features. These models, associated data products, and a searchable, coregistered collection of images across six spacecraft are publicly available in the Small Body Mapping Tool, and will be archived with the NASA Planetary Data System. These products enable an array of future studies to advance the understanding of Phobos and Deimos, facilitate coregistration of other past and future datasets, and set the stage for planning and operating future missions to the moons, including the upcoming Martian Moons eXploration (MMX) mission.

Supplementary information: The online version contains supplementary material available at 10.1186/s40623-023-01814-7.

Keywords: Deimos; Martian Moons eXploration; Martian moons; Phobos; Shape; Small bodies; Stereophotoclinometry; Topography.


Conflict of interest statement

Competing interestsThe authors declare that they have no competing interests.

Figures

Fig. 1
Fig. 1
a A modeled maplet superposed on the global shape of Phobos. b Image (top row) and rendered model (bottom row) of the maplet shown in images from multiple spacecraft under different viewing geometries and illuminations
Fig. 2
Fig. 2
A subset of individual maplets (left) and shape model constructed from many overlapping maplets (right) on Phobos. Maplets of various scales can be combined into a global shape model. In some cases, individual maplets can have a finer ground sample distance than the global model
Fig. 3
Fig. 3
Histogram of the image pixel scales used to construct the Phobos (left) and Deimos (right) SPC shape models. The Phobos model incorporates 2382 images and the Deimos model incorporates 332 images
Fig. 4
Fig. 4
Coverage maps for Phobos (top) and Deimos (bottom) for the images ≤ 80º incidence angle, and ≤ 70º emission angle used to make the SPC models. Black indicates areas not covered by images used to make the Deimos model (Phobos has global image coverage). Most of Phobos is covered by images ≤ 10 m pixel scale. Much of one hemisphere of Deimos (from approximately −170ºE to 30ºE) is covered by images ≤ 50 m pixel scale. The region between ~ 50ºE and 190ºE is covered primarily by a single image (f507a01). Its limb was used to constrain the model and it was incorporated into a few maplets at higher southern latitudes (> 30º), but it could not support maplets on its own elsewhere
Fig. 5
Fig. 5
An analysis of the quality of the Phobos input image set relative to ideal SPC imaging criteria (Al Asad et al. 2021). ad Number of framing images that match the cardinal directions required by SPC at different pixel scales. e Number of framing images with pixel scales ≤ 100 m that match the albedo image requirements of SPC. f Approximate coverage of HiRISE and MOC pushbroom images
Fig. 6
Fig. 6
An analysis of the quality of the Deimos input image set relative to ideal SPC imaging criteria (Al Asad et al. 2021). ad Number of framing images that match the cardinal directions required by SPC at different pixel scales. e Number of framing images with pixel scales ≤ 200 m that match the albedo image requirements of SPC. f Approximate coverage of HiRISE and MOC pushbroom images
Fig. 7
Fig. 7
Examples of three comparisons between rendered images of the shape model with spacecraft images to assess model quality. a Illustration of the keypoint matching method using SRC image H3245_0006sr2 of Phobos. Matched keypoints on the reference image (left) and the rendered model (right) are connected by lines. b Illustration of the keypoint distance method using Viking Orbiter image f428b22 of Deimos. The collection of distances between all keypoints is shown on the reference image (left) and the rendered model (right). c Illustration of the limb/terminator method using Viking Orbiter image f123b03 of Phobos. Limb and terminator positions are outlined in green on the reference image (left) and on the rendered model (center). A difference image (right) shows mismatches in black or grey
Fig. 8
Fig. 8
The global SPC shape model of Phobos, seen along the axes and rendered without albedo. The global model has an average resolution of 18 m per facet, over 12 million facets, and was constructed from 2382 images
Fig. 9
Fig. 9
The ground sample distance of maplets making up the Phobos SPC suite. The model is globally covered by 10-, 25-, and 60-m maplets
Fig. 10
Fig. 10
Comparison of SRC images (H9551_0005_SR2 top left; H3802_0004_SR2 bottom left) with images rendered from a regional DTM with GSD 10 m (center) and images rendered from the global shape model with GSD 18 m (right). The rendered images include the relative albedo solution derived from the SPC process. Images rendered from the higher-resolution, regional DTMs appear crisper and reveal small-scale features (~ 100 m; examples indicated by arrows) that are harder to make out in images rendered from the almost 2 × lower-resolution, global shape model
Fig. 11
Fig. 11
a Zoom-in of an SRC image (H9551_0005_SR2, see also Fig. 8) to illustrate the location of a profile taken across a small, ~ 120-m-diameter crater. b A comparison of topographic profiles taken across the regional DTM (10-m GSD) and the global shape model (18-m GSD). The grey dashed line shows a linear baseline between the two endpoints. c The same topographic profiles linearly detrended using the baseline to remove the effect of broader-scale slopes and accentuate small-scale features. The height differences between models are apparent, particularly across the small crater (located approximately 0.25 km along the profile)
Fig. 12
Fig. 12
Maplet residuals (a, b), maplet formal uncertainty (c, d), and vertex sigmas (e, f) for our Phobos global SPC model. These metrics indicate a model accuracy of ± 13–20 m and a precision of ~ 4 m (5 × the mean vertex sigma). A few localized areas stand out in these metrics; these areas are associated with crater walls in areas where most images are heavily shadowed
Fig. 13
Fig. 13
Results of the keypoint matching, keypoint distance, and limb/terminator methods applied to Phobos. a Histogram of the scale factor needed to match the model to the reference image based on the keypoint matching method for 222 images. Values < 1 indicate the model is larger than the images. The keypoint matching method indicates a 66-m accuracy and a + 44-m scale uncertainty for a scale factor of 0.996 (the model is slightly larger than the images). b Histogram of the median residual difference between the model and the reference image based on the keypoint distance method for 222 images. They keypoint distance method indicates a 50-m accuracy and a + 30-m scale uncertainty. c Histogram of the difference between the model (rendered image) and the reference image based on the limb/terminator method for 173 images. The limb/terminator comparison indicates a 59-m accuracy and a + 17-m scale uncertainty (again the model is larger than the images)
Fig. 14
Fig. 14
Difference between the Ernst et al. (this study) Phobos global shape model and those of Gaskell (top) and Willner et al. (bottom). All three models are in generally good agreement with one another. The new model is nearly the same as the previous models in some areas (white in the color scale), larger in some areas (green in the color scale), and smaller in some areas (brown in the color scale). The new model on average is slightly smaller (30–40 m, corresponding to ~ 0.3–0.4% of the mean body radius; ~ 1% smaller in volume) than the two previous models
Fig. 15
Fig. 15
Comparison of Phobos Viking Orbiter VIS images (top to bottom: f357a64, f315a12, f315a11, f246a08) with images rendered from the global shape models of Ernst et al. (this study), Gaskell (2011), and Willner et al. (2014). The Ernst et al (this study) model rendered images incorporate the SPC-derived relative albedo solution. Image pixel scale is indicated in the left column. The bulk shape of Phobos is similar for all three shape models. Small-scale details can be resolved in the Ernst et al (this study) model that are not resolvable in the previous models. Such features are particularly noticeable in the bottom row
Fig. 16
Fig. 16
Comparison of Phobos Mars Express SRC images (top to bottom: H2601_0006_SR2, H4447_0005SR2, HD683_0004SR2, H4847_0005SR2) with images rendered from the global shape models of Ernst et al. (this study), Gaskell (2011), and Willner et al. (2014). The Ernst et al (this study) model rendered images incorporate the SPC-derived relative albedo solution. Image pixel scale is indicated in the left column. The bulk shape of Phobos is similar for all three shape models. Small-scale details can be resolved in the Ernst et al (this study) model that are not resolvable in the previous models. Such features are particularly noticeable in the bottom two rows
Fig. 17
Fig. 17
Comparison between MOLA tracks and Phobos global shape models. MOLA tracks were translated and rotated as a unit to best match each global shape model. The difference between the two models is shown along the MOLA track superposed onto the shape model at left (views centered on 0ºN, 20ºE). A histogram of the differences (MOLA-shape) is shown at right. The RMS difference gives an indication of the uncertainty in model hemispherical accuracy
Fig. 18
Fig. 18
(Top) The global SPC shape model of Deimos, seen along the axes and rendered without albedo. The global model has an average resolution of 20 m per facet, a total of over 3 million facets, and was constructed from 332 images. Areas shaded yellow are constrained only by limbs. (bottom) The global SPC shape model of Deimos including the limb points used to constrain the model. The limb points have been radially offset slightly above the body to aid visibility
Fig. 19
Fig. 19
The ground sample distance of maplets making up the Deimos SPC suite. The sub-Mars hemisphere covered by 25- and 40-m maplets. One map at 60-m GSD was created to extend coverage near the south pole
Fig. 20
Fig. 20
Maplet residuals (a, b), maplet formal uncertainty (c, d), and vertex sigmas (e, f) for our Deimos global SPC model. These metrics indicate a model accuracy of ± 8–22 m. The vertex sigma for Deimos is likely not a good indicator of precision, due to limited satisfaction of the SPC imaging criteria. High vertex sigma values are concentrated at the edges of maplet coverage, where the maps do not agree well with the poorly constrained shape
Fig. 21
Fig. 21
Results of the keypoint matching, keypoint distance, and limb/terminator methods applied to Deimos. a Histogram of the scale factor needed to match the model to the reference image based on the keypoint matching method for 125 images. Values < 1 indicate the model is larger than the images. The keypoint matching method indicates a 188-m accuracy and a + 31-m scale uncertainty for a scale factor of 0.995 (the model is slightly larger than the images). b Histogram of the median residual difference between the model and the reference image based on the keypoint distance method for 125 images. They keypoint distance method indicates a 131-m accuracy and a + 10-m scale uncertainty. c Histogram of the difference between the model (rendered image) and the reference image based on the limb/terminator method for 219 images. The limb/terminator comparison indicates a 65-m accuracy uncertainty and a + 9-m scale uncertainty (again the model is larger than the images)
Fig. 22
Fig. 22
Difference between the Ernst et al. (this study) and Thomas Deimos global shape models. The two models are in generally good agreement with one another. The new model is nearly the same as the previous models in some areas (white in the color scale), larger in some areas (green in the color scale), and smaller in some areas (brown in the color scale). The new model on average is slightly larger (~ 30 m, corresponding to ~ 0.5% of the mean body radius; ~ 2% larger in volume) than the Thomas model. Much of the volume increase is concentrated in the area between ~ 15–30ºS and ~ 140–190ºE where additional limb vectors have built out the shape
Fig. 23
Fig. 23
Comparison of Deimos Viking Orbiter VIS and Mars Express SRC images (top to bottom: f355b53, f428b60, H8263_0004SR2, H9253_0005SR2) with images rendered from the global shape models of Ernst et al. (this study) and Thomas (1993). The Ernst et al (this study) model rendered images incorporate the SPC-derived relative albedo solution. Image pixel scale is indicated in the left column. Although the general shapes of both models are similar, surface features can be resolved in the Ernst et al (this study) model. Note the effect of the astigmatism toward the top of the body in the SRC images
Fig. 24
Fig. 24
Gravitational magnitude across the surfaces of the new Phobos (top) and Deimos (bottom) SPC models. The calculations account for the presence of Mars at a distance equal to the mean semi-major axis of each moon’s orbit
Fig. 25
Fig. 25
Distribution of surface slopes on the new Phobos (top) and Deimos (bottom) SPC models. The calculations account for the presence of Mars at a distance equal to the mean semi-major axis of each moon’s orbit. High slopes on Phobos are located primarily within the walls of craters. High slopes on Deimos are primarily located in the saddle (90ºS view), which accounts for the tail of histogram at slopes > 20º. The higher-resolution topography reveals more locations with steep slopes relative to previous studies

References

    1. Arakawa M, Saiki T, Wada K, et al. An artificial impact on the asteroid (162173) Ryugu formed a crater in the gravity-dominated regime. Science. 2020;368:67–71. doi: 10.1126/science.aaz1701. - DOI - PubMed
    1. Archinal BA, A’Hearn MF, Bowell E, et al. Report of the IAU working group on cartographic coordinates and rotational elements: 2009. Celest Mech Dyn Astron. 2011;109:101–135. doi: 10.1007/s10569-010-9320-4. - DOI
    1. Archinal BA, Acton C, A’Hearn MF, et al. Report of the IAU working group on cartographic coordinates and rotational elements: 2015. Celest Mech Dyn Astron. 2018;130:22. doi: 10.1007/s10569-017-9805-5. - DOI
    1. Archinal BA, Acton C, Conrad A, et al. Erratum: correction to: report of the IAU working group on cartographic coordinates and rotational elements: 2015. Celest Mech Dyn Astron. 2019;131:61. doi: 10.1007/s10569-019-9925-1. - DOI
    1. Al Asad MM, Philpott LC, Johnson CL, et al. Validation of Stereophotoclinometric shape models of asteroid (101955) Bennu during the OSIRIS-REx Mission. Planet Sci J. 2021;2:82. doi: 10.3847/PSJ/abe4dc. - DOI

LinkOut - more resources