. 2023 May 28;26(6):106963.
doi: 10.1016/j.isci.2023.106963. eCollection 2023 Jun 16.

Attenuated Mycobacterium tuberculosis vaccine protection in a low-dose murine challenge model

Affiliations

Attenuated Mycobacterium tuberculosis vaccine protection in a low-dose murine challenge model

Samuel J Vidal et al. iScience. .

Abstract

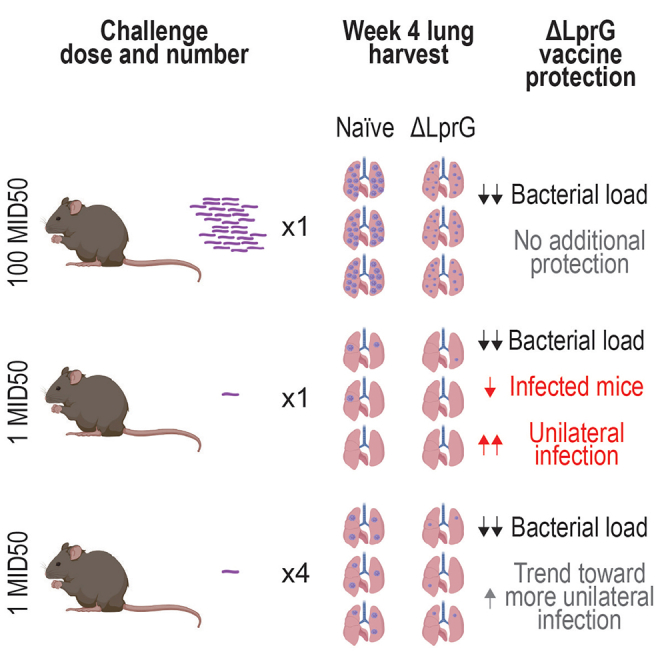
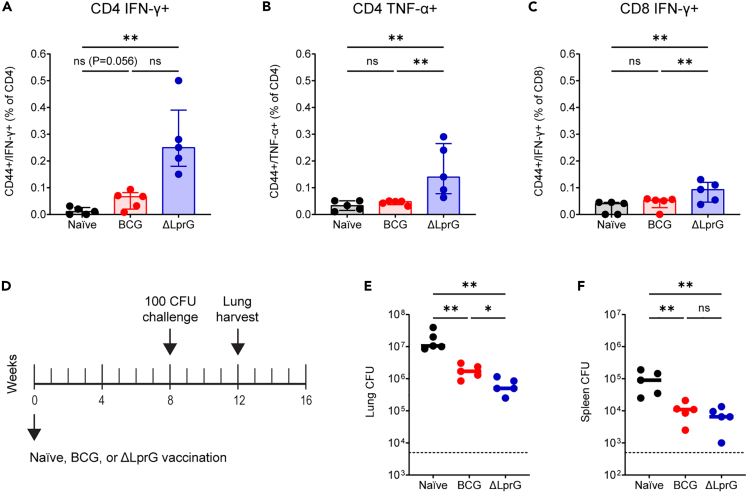
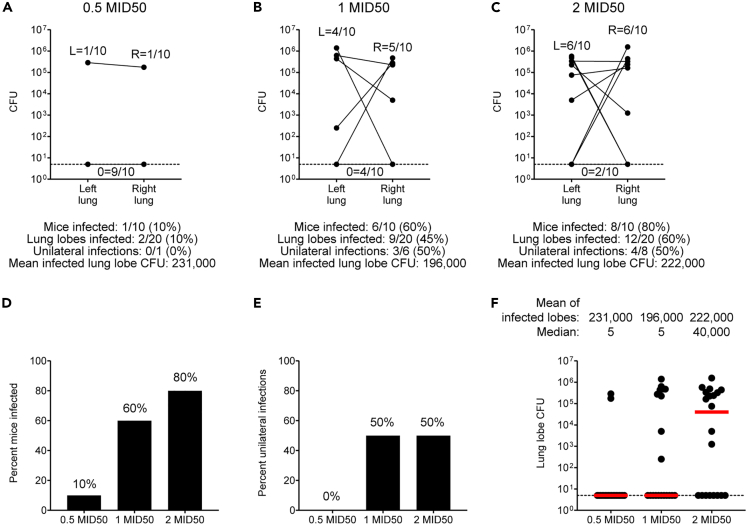
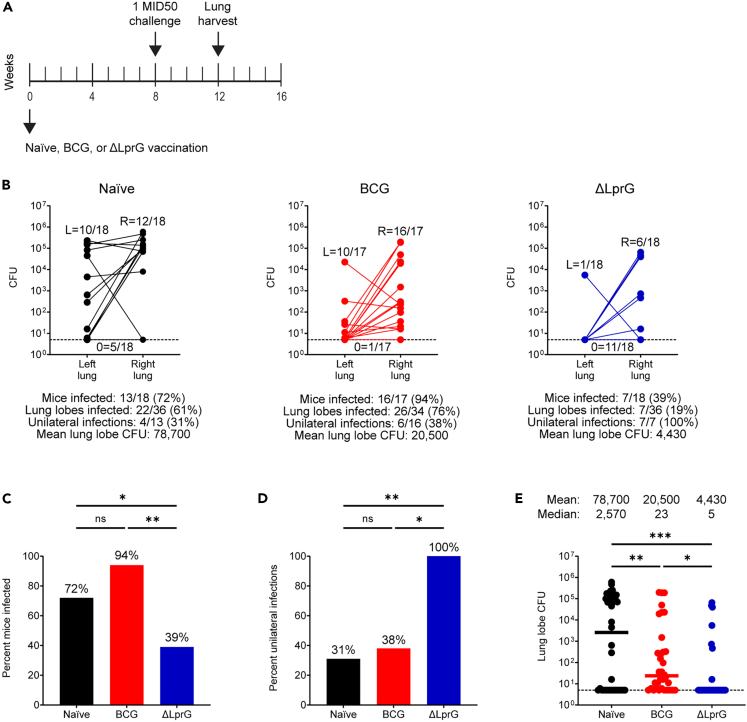
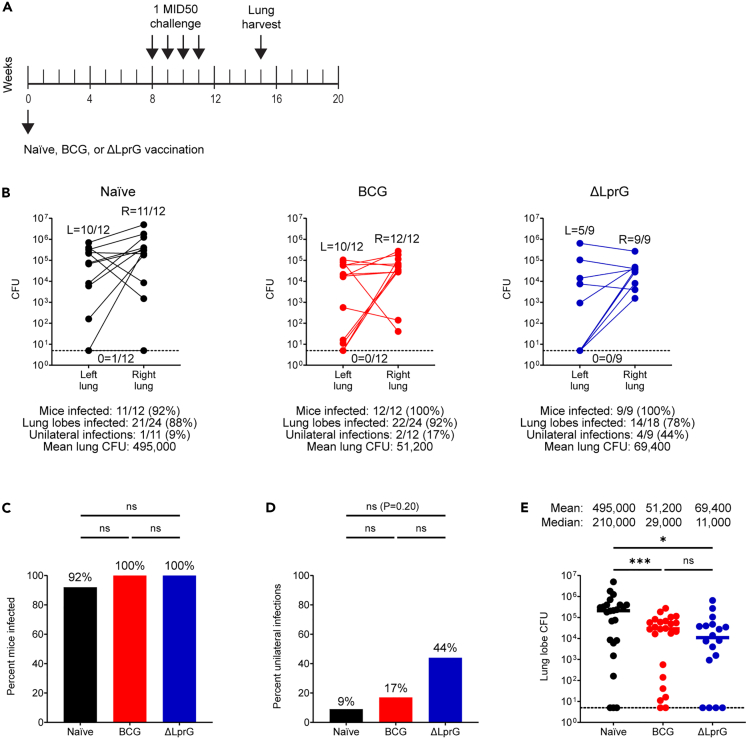
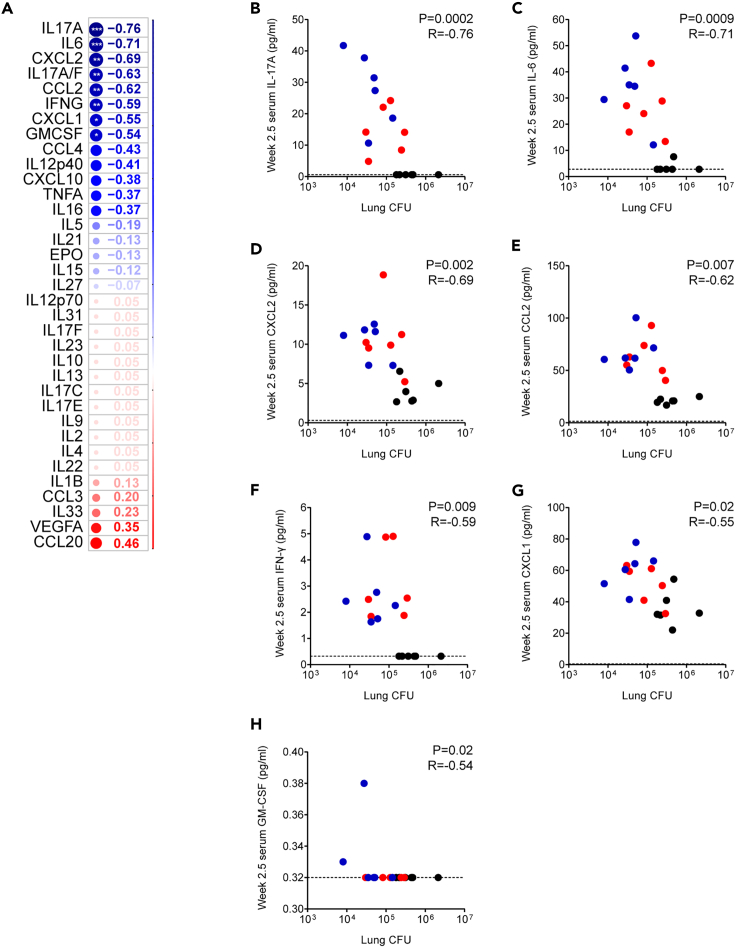
Bacillus Calmette-Guérin (BCG) remains the only approved tuberculosis (TB) vaccine despite limited efficacy. Preclinical studies of next-generation TB vaccines typically use a murine aerosol model with a supraphysiologic challenge dose. Here, we show that the protective efficacy of a live attenuated Mycobacterium tuberculosis (Mtb) vaccine ΔLprG markedly exceeds that of BCG in a low-dose murine aerosol challenge model. BCG reduced bacterial loads but did not prevent establishment or dissemination of infection in this model. In contrast, ΔLprG prevented detectable infection in 61% of mice and resulted in anatomic containment of 100% breakthrough infections to a single lung. Protection was partially abrogated in a repeated low-dose challenge model, which showed serum IL-17A, IL-6, CXCL2, CCL2, IFN-γ, and CXCL1 as correlates of protection. These data demonstrate that ΔLprG provides increased protection compared to BCG, including reduced detectable infection and anatomic containment, in a low-dose murine challenge model.

Keywords: Immunology; Medical microbiology.


Conflict of interest statement

A.J.M. and D.H.B. are co-inventors on a provisional vaccine patent PCT/US2020/059152 (Mycobacterial compositions and biomarkers for use in treatment and monitoring of therapeutic responsiveness).

Figures

None
Graphical abstract
Figure 1
Figure 1
ΔLprG is more immunogenic and protective than BCG following 100 CFU H37Rv challenge in C3HeB/FeJ mice (A–C) Groups of C3HeB/FeJ mice were immunized with BCG (n = 5) or ΔLprG (n = 5) at week 0 followed by PBMC ICS following stimulation with purified protein derivative (PPD) at week 2 to quantify subsets including CD4 IFN-γ+ T cells (A), CD4 TNF-α+ T cells (B), and CD8 IFN-γ+ T cells (C). (D) Challenge study design (D). (E) Groups of C3HeB/FeJ mice were immunized with BCG (n = 5) or ΔLprG (n = 5) at week 0 followed by 100 CFU H37Rv aerosol challenge at week 8 and lung and spleen harvesting at week 12 for bacterial load quantification. Lung CFU from the challenge study (E). (E) Bottom dotted line represents assay LOD of 5,000 CFU. Spleen CFU from the challenge study (F). Bottom dotted line represents assay LOD of 500 CFU. For (A)–(C), data are represented as median +/− interquartile range. For (E) and (F), bars represent group medians. For all panels, p values represent pairwise Mann Whitney U tests. For all panels, ∗ represents p < 0.05 and ∗∗ represents p < 0.01.
Figure 2
Figure 2
Characterization of 1 MID50 H37Rv challenge in C3HeB/FeJ mice (A–C) Single-cell suspension H37Rv challenge stock log2-scale in vivo dose-finding study (A–C). C3HeB/FeJ mice (n = 10 per group) were challenged at week 0 with the indicated challenge stock doses followed by right and left lung lobe harvesting at week 4 for bacterial load quantification. Bottom dotted line represents assay LOD of 5 CFU. (D–F) Histograms and dot plots summarizing infection rates and bacterial loads shown in A–C (D–F). For (F), dotted bottom line represents assay LOD of 5 CFU and bars represent group medians.
Figure 3
Figure 3
Vaccine protection with BCG and ΔLprG after 1 MID50 H37Rv challenge in C3HeB/FeJ mice (A) Study design (A). (B) Three cohorts of C3HeB/FeJ mice (n = 18 mice per cohort, n = 54 mice total) were divided equally into naive, BCG, and ΔLprG groups. Vaccines were administered at week 0 followed by 1 MID50 H37Rv aerosol challenge at week 8 and right and left lung lobe harvesting at week 12 for bacterial load quantification (B). Bottom dotted line represents an LOD of 5 CFU. Histograms and dot plots summarizing data are shown in B (C–E). p values for infection rates between groups represent an exact logistic regression model (C and D). p values for bacterial loads between groups represent a mixed effects negative binomial model (E). For (E), dotted bottom line represents an LOD of 5 CFU and bars represent group medians. For all panels, ∗ represents p < 0.05, ∗∗ represents p < 0.01, and ∗∗∗ represents p < 0.001.
Figure 4
Figure 4
Vaccine protection with BCG and ΔLprG after repeated 1 MID50 H37Rv challenge in C3HeB/FeJ mice (A) Study design (A). (B) Two cohorts of C3HeB/FeJ mice (n = 18 mice per cohort, n = 36 mice total) were divided equally into naive, BCG, and ΔLprG groups. Vaccines were administered at week 0 followed by four weekly 1 MID50 H37Rv aerosol challenges between weeks 8–11 and right and left lung lobe harvesting at week 15 for lung lobe bacterial load quantification (B). Bottom dotted line represents an LOD of 5 CFU. Histograms and dot plots summarizing data are shown in B (C–E). p values for infection rates between groups represent an exact logistic regression model (C and D). p values for bacterial loads between groups represent a mixed effects negative binomial model (E). For (E), bottom dotted line represents an LOD of 5 CFU and bars represent group medians. For all panels, ∗ represents p < 0.05 and ∗∗∗ represents p < 0.001.
Figure 5
Figure 5
Pre-challenge serum cytokine levels correlated with bacterial loads among naive and BCG- and ΔLprG-vaccinated C3HeB/FeJ mice after four weekly 1 MID50 H37Rv challenges (A–H) A cohort of C3HeB/FeJ mice (n = 18) was divided into naive (n = 6), BCG (n = 6), and ΔLprG (n = 6) groups. Vaccines were administered at week 0 and serum cytokines were measured at week 2.5. The cohort then underwent four weekly 1 MID50 H37Rv aerosol challenges between weeks 8–11 and right and left lung lobes harvested at week 15 for lung lobe bacterial load quantification. Two-tailed Spearman correlation coefficients comparing the serum expression levels of 35 cytokines measured at week 2.5 with whole-mouse bacterial loads measured at week 15 (A). ∗ represents p < 0.05, ∗∗ represents p < 0.01, and ∗∗∗ represents p < 0.001. Individual two-tailed Spearman correlation plots for IL-17 (B), IL-6 (C), CXCL2 (D), CCL2 (E), IFN-γ (F), CXCL1 (G), and GM-CSF (H).

References

    1. Global Tuberculosis Report. World Health Organization; 2021. p. 2021.
    1. Fine P.E. Variation in protection by BCG: implications of and for heterologous immunity. Lancet. 1995;346:1339–1345. doi: 10.1016/s0140-6736(95)92348-9. - DOI - PubMed
    1. Andersen P., Scriba T.J. Moving tuberculosis vaccines from theory to practice. Nat. Rev. Immunol. 2019;19:550–562. doi: 10.1038/s41577-019-0174-z. - DOI - PubMed
    1. The End TB Strategy. World Health Organization; 2015. August 16, 2015.
    1. Martinot A.J., Blass E., Yu J., Aid M., Mahrokhian S.H., Cohen S.B., Plumlee C.R., Larocca R.A., Siddiqi N., Wakabayashi S., et al. Protective efficacy of an attenuated Mtb ΔLprG vaccine in mice. PLoS Pathog. 2020;16:e1009096. doi: 10.1371/journal.ppat.1009096. - DOI - PMC - PubMed

LinkOut - more resources