

doi: 10.1093/procel/pwac028.
DCK confers sensitivity of DCTD-positive cancer cells to oxidized methylcytidines
Affiliations
- PMID: 37378658
- PMCID: PMC10305735
- DOI: 10.1093/procel/pwac028
Item in Clipboard
DCK confers sensitivity of DCTD-positive cancer cells to oxidized methylcytidines
Protein Cell.
.
No abstract available
Figures
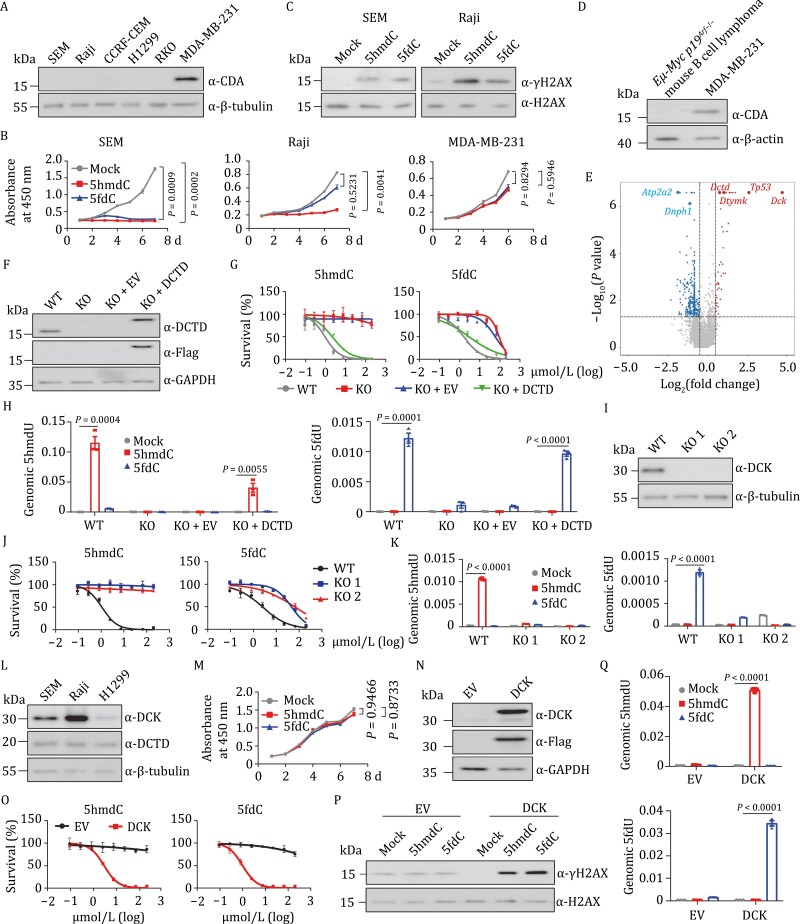
5hmdC and 5fdC inhibit proliferation of cancer cells expressing DCK and DCTD that promote the deamination of the two deoxynucleosides. (A) Western analysis of CDA in selected human cancer cell lines. (B) Growth curves of SEM (left), Raji (middle), and MDA-MB-231 cells (right) treated with PBS (mock, grey), 10 μmol/L 5hmdC (red), or 5fdC (blue) over a period of 7 days. Each dot represents the mean value of three replicates. Statistical differences were assessed between mock and 5hmdC- (or 5fdC-) treated groups by a two-way repeated ANOVA analysis. (C) Western blot analysis of γH2AX in SEM (left) and Raji (right) cells after a 2-day treatment with 10 μmol/L 5hmdC or 5fdC. (D) Western analysis of CDA in Eµ-Myc p19Arf−/− and MDA-MB-231 cells. (E) Volcano plot displaying the results of MAGeCK analysis of the CRISPR screen. Red dots represent enriched genes and blue dots represent dropout genes in the surviving cells after two rounds of 5hmdC selection. 5hmdC was used at concentration of 200 µmol/L that killed 95% of cells. Significance is determined at P-value < 0.05, log2 (fold change) > 0.5. Sensitizing genes Dck, Tp53, Dtymk, and Dtcd and resistance genes Atp2a2 and Dnph1 are indicated. (F) Western blot showing the DCTD protein level in SEM cell line of wild type (WT), DCTD knockout (KO), KO infected with empty lentiviral vector (KO+EV) or with vector containing DCTD (KO+DCTD). (G) IC50 curves of 5hmdC (left) and 5fdC (right) in wild type (grey), DCTD KO (red), KO+EV (blue), and KO+DCTD (green) SEM cells. X-axis is the logarithmic transformed concentration of nucleosides. Y-axis denotes the proportion of live cells on day 4 at each nucleoside concentration. Each dot represents the average value of three technical replicates. (H) LC-MS/MS analysis of 5hmdU (left) and 5fdU (right) in the nucleoside pool hydrolyzed from genomic DNA of WT, KO, KO+EV, and KO+DCTD cell lines treated with 10 μmol/L 5hmdC (red) or 5fdC (blue). Levels of 5hmdU and 5fdU were normalized to the total amount of genomic dC in the indicated group (n = 3). (I) Western analysis of DCK in wild type (WT) and two DCK knockout (KO 1 and KO 2) cell lines of SEM. (J) IC50 curves of 5hmdC (left) and 5fdC (right) in WT and DCK KO SEM cell lines. (K) Abundance of 5hmdU (left) and 5fdU (right) measured by LC-MS/MS in genome of WT and two independent DCK KO SEM cell lines treated in triplicate with PBS (mock), 10 μmol/L 5hmdC or 5fdC. Total amount of genomic dC was used for normalization. (L) Western analysis of DCK and DCTD proteins in SEM, Raji, and H1299 cancer cells. (M) Growth curves of H1299 cells treated with PBS (mock, grey), 10 μmol/L 5hmdC (red) or 5fdC (blue) over a period of 7 days. (N) Western analysis confirming exogenous DCK expression in H1299 cells. EV, H1299 cells infected with empty lentiviral vector. DCK, H1299 infected with Flag-DCK lentiviruses. (O) IC50 curves of 5hmdC (left) and 5fdC (right) in DCK expressing cells. (P) Western analysis of γH2AX in DCK expressing cell lines after a 2-day treatment with PBS (mock), 10 μmol/L 5hmdC or 5fdC. (Q) LC-MS/MS analysis of the relative abundance of 5hmdU (top) and 5fdU (bottom) in the genome of DCK-expressing H1299 cells treated with 10 μmol/L 5hmdC (red) or 5fdC (blue). Cells transduced with empty lentiviral vector without DCK gene (EV) were used for comparison. The amount of genomic dC was used for normalization. Three replicates were used to calculate the mean value. For all panels: Significance is defined as P < 0.05. Error bar represents mean ± s.e.m. Mock, cell line treated with PBS.
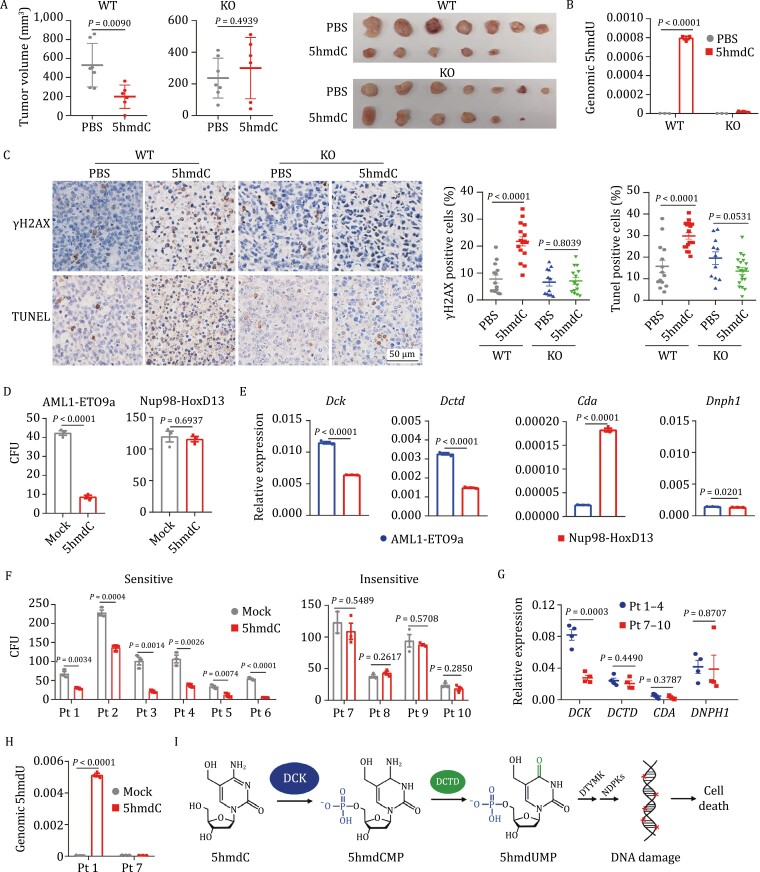
5hmdC inhibits the growth of subcutaneous tumors and colony formation of leukemia cells expressing DCK and DCTD. (A) Tumor volumes of wild-type (WT) and DCTD knockout (KO) Raji cells transplanted in BALB/c nude mice treated with PBS (n = 7) or 5hmdC (n = 6) at 50 mg/kg per day for 11 days. Dissected tumor specimens from each group are shown to the right. (B) Quantification of 5hmdU content by LC-MS/MS (normalized to genomic level of dC) in the genome of WT and DCTD KO xenograft tumors grown in mice treated with 5hmdC or PBS control. Three biological replicates were used to calculate the mean value. (C) Representative immunohistochemistry (IHC) images of γH2AX and TUNEL staining in WT and DCTD KO tumors from recipient mice treated with 5hmdC for 11 days. Quantification analysis of IHC staining is shown to the right. Y-axis denotes the percentage of cells stained positive for γH2AX or TUNEL. (D) Colony formation assay of bone marrow cells derived from mouse leukemia models harboring the fusion oncoproteins AML1-ETO9a or Nup98-HoxD13. Cells expressing the indicated fusion genes were cultured in the presence of 10 μmol/L 5hmdC in triplicate over a period of 1 week. Y-axis denotes the counts of colony in each treatment group. (E) mRNA levels of Dck, Dctd, Cda, and Dnph1 measured by RT-qPCR in the bone marrow cells derived from mouse leukemia models harboring the indicated fusion oncoproteins. Actb was used as the internal control. (F) Colony formation assay of bone marrow cells derived from ten different leukemia patients. Bone marrow cells were cultured in triplicate in the presence of 20 μmol/L 5hmdC over a period of 2 weeks and the numbers of colonies were scored. Y axis denotes the colony counts in each treatment group. (G) mRNA levels of DCK, DCTD, CDA, and DNPH1 measured by RT-qPCR in the untreated bone marrow cells derived from patient samples which were sensitive (Pt 1–4, blue) and insensitive (Pt 7–10, red) to 5hmdC. Each dot represents a patient sample. GAPDH was used as the internal control. (H) LC-MS/MS analysis of 5hmdU in the genome extracted from 5hmdC- treated bone marrow cells of patients 1 and 7. Levels of 5hmdU were normalized to the total amount of genomic dC in indicated groups. (I) A working model for 5hmdC metabolism. For all panels: Significance is defined as P < 0.05. Error bar represents mean ± s.e.m. Mock, cells treated with PBS. Pt, patient.
References
-
- Appelbaum FR, Rowe JM, Radich J, et al. . Acute myeloid leukemia. N Engl J Med 1999;341:1051–1062. - PubMed
-
- Jamieson GP, Finch LR, Snook M, et al. . Degradation of 1-beta-D- arabinofuranosylcytosine 5’-triphosphate in human leukemic myeloblasts and lymphoblasts. Cancer Res 1987;47:3130–3135. - PubMed
Publication types
MeSH terms
Substances
LinkOut - more resources
Full Text Sources
Medical
