. 2023 Nov 1;29(21):4449-4463.
doi: 10.1158/1078-0432.CCR-22-3667.

Dissecting the Mechanisms Underlying the Cytokine Release Syndrome (CRS) Mediated by T-Cell Bispecific Antibodies

Affiliations

Dissecting the Mechanisms Underlying the Cytokine Release Syndrome (CRS) Mediated by T-Cell Bispecific Antibodies

Gabrielle Leclercq-Cohen et al. Clin Cancer Res. .

Abstract

Purpose: Target-dependent TCB activity can result in the strong and systemic release of cytokines that may develop into cytokine release syndrome (CRS), highlighting the need to understand and prevent this complex clinical syndrome.

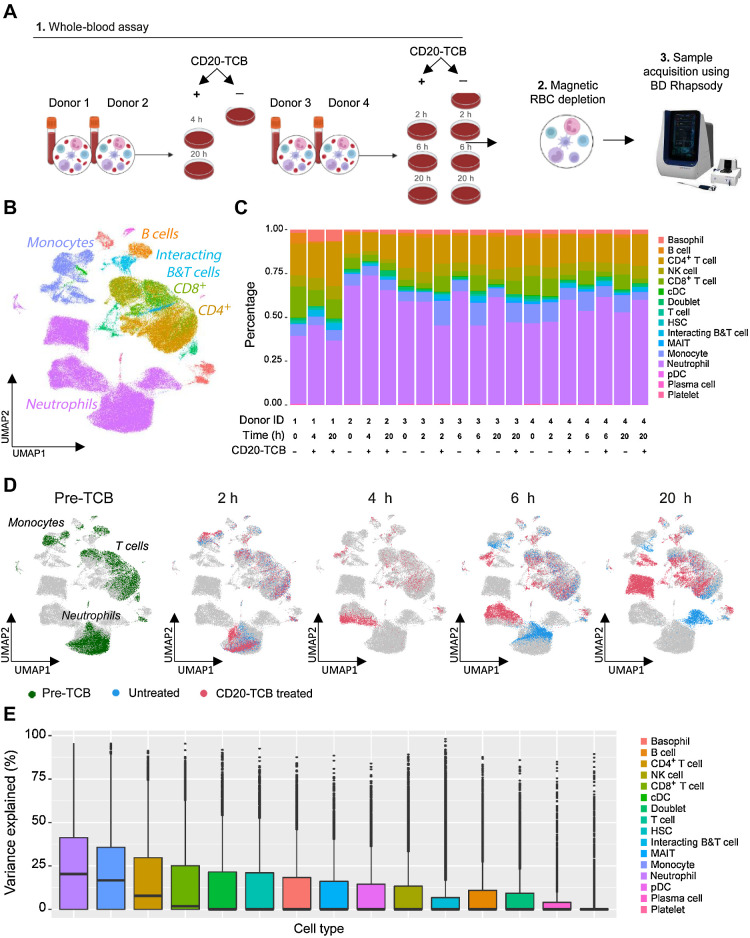
Experimental design: We explored the cellular and molecular players involved in TCB-mediated cytokine release by single-cell RNA-sequencing of whole blood treated with CD20-TCB together with bulk RNA-sequencing of endothelial cells exposed to TCB-induced cytokine release. We used the in vitro whole blood assay and an in vivo DLBCL model in immunocompetent humanized mice to assess the effects of dexamethasone, anti-TNFα, anti-IL6R, anti-IL1R, and inflammasome inhibition, on TCB-mediated cytokine release and antitumor activity.

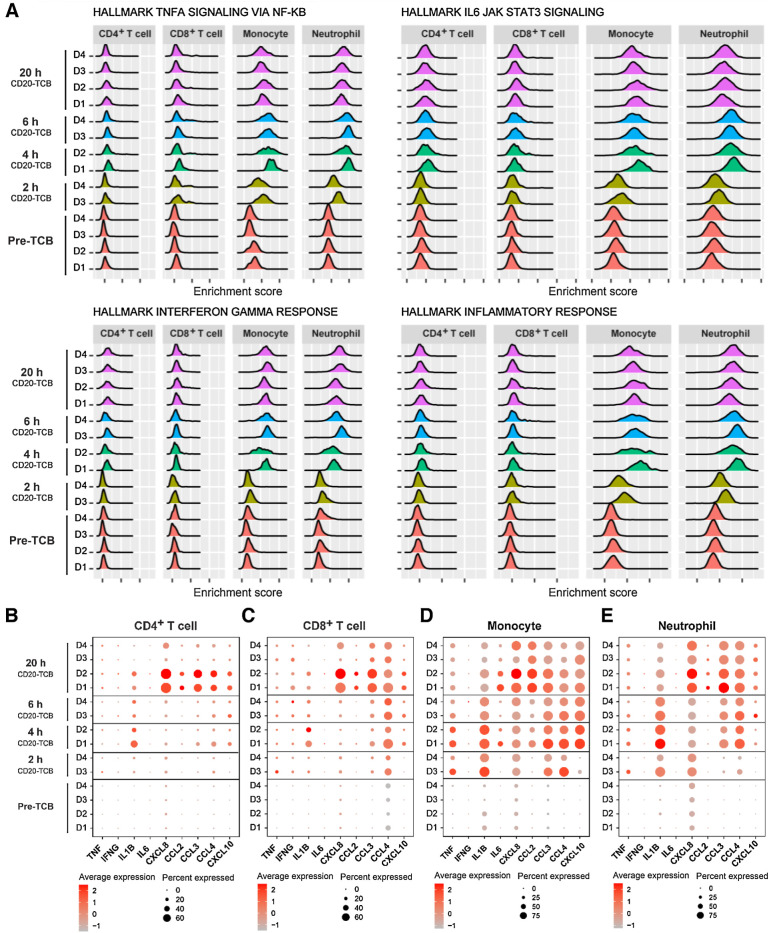
Results: Activated T cells release TNFα, IFNγ, IL2, IL8, and MIP-1β, which rapidly activate monocytes, neutrophils, DCs, and NKs along with surrounding T cells to amplify the cascade further, leading to TNFα, IL8, IL6, IL1β, MCP-1, MIP-1α, MIP-1β, and IP-10 release. Endothelial cells contribute to IL6 and IL1β release and at the same time release several chemokines (MCP-1, IP-10, MIP-1α, and MIP-1β). Dexamethasone and TNFα blockade efficiently reduced CD20-TCB-mediated cytokine release whereas IL6R blockade, inflammasome inhibition, and IL1R blockade induced a less pronounced effect. Dexamethasone, IL6R blockade, IL1R blockade, and the inflammasome inhibitor did not interfere with CD20-TCB activity, in contrast to TNFα blockade, which partially inhibited antitumor activity.

Conclusions: Our work sheds new light on the cellular and molecular players involved in cytokine release driven by TCBs and provides a rationale for the prevention of CRS in patients treated with TCBs. See related commentary by Luri-Rey et al., p. 4320.


Figures

Figure 1. Kinetics of cytokine release in WBA reflect those observed in DLBCL patients after the first treatment with CD20-TCB. Whole blood from donors 3 and 4 used in the scRNA-seq experiment was incubated in the presence and the absence of 0.2 μg/mL CD20-TCB for 2, 6, and 20 hours. A, The proportion of CD19+ B cells among live total leukocytes and (B) the expression of CD69 and CD25 on CD4+ and CD8+ T cells was measured by flow cytometry for 2 donors before and after treatment with CD20-TCB for 2, 6, and 20 hours. Means of n = 2 donors + SD. C, The levels of cytokines were measured by Luminex in serum from whole blood assay untreated or treated with 0.2 μg/mL at 2, 6, and 20 hours. Means of n = 2 donors + SD. D, Plasma samples from biomarker-evaluable DLBCL patients treated with 2.5 mg of glofitamab were evaluated for IFNγ (n = 17), TNFα (n = 30), or IL6 (n = 43). Median with interquartile range. 6 hours EOI, 6 hours after end of infusion; 20 hours EOI, 20 hours after end of infusion.
Figure 1.
Kinetics of cytokine release in WBA reflect those observed in DLBCL patients after the first treatment with CD20-TCB. Whole blood from donors 3 and 4 used in the scRNA-seq experiment was incubated in the presence and the absence of 0.2 μg/mL CD20-TCB for 2, 6, and 20 hours. A, The proportion of CD19+ B cells among live total leukocytes and (B) the expression of CD69 and CD25 on CD4+ and CD8+ T cells was measured by flow cytometry for 2 donors before and after treatment with CD20-TCB for 2, 6, and 20 hours. Means of n = 2 donors + SD. C, The levels of cytokines were measured by Luminex in serum from whole blood assay untreated or treated with 0.2 μg/mL at 2, 6, and 20 hours. Means of n = 2 donors + SD. D, Plasma samples from biomarker-evaluable DLBCL patients treated with 2.5 mg of glofitamab were evaluated for IFNγ (n = 17), TNFα (n = 30), or IL6 (n = 43). Median with interquartile range. 6 hours EOI, 6 hours after end of infusion; 20 hours EOI, 20 hours after end of infusion.
Figure 2. ScRNA-sequencing of whole blood treated with CD20-TCB reveals an early phenotypic change in T cells, monocytes, and neutrophils. A, scRNA-seq of whole blood was performed using the BD Rhapsody platform at baseline (donors 1, 2, 3, and 4) and 2 hours (donors 3 and 4), 4 hours (donors 1 and 2), 6 hours (donors 3 and 4), and 20 hours (donors 1, 2, 3, and 4) after treatment with 0.2 μg/mL CD20-TCB. B, UMAP plot of immune cells colored by cell types reveals a large proportion of neutrophils. C, Stacked barplot with cell type proportions for each sample analyzed for scRNA-seq. D, UMAP plots of immune cells colored by treatment. The UMAP plots show single cells from all time points in gray, cells from baseline samples in green, cells from treated samples at 2-, 4-, 6-, and 20-hour time points in pink, and cells from untreated samples at 2-, 4-, 6-, and 20-hour time points in blue. Each dot represents one cell. E, Box plot representing the percentage of variance in gene expression attributed to treatment-induced changes between time points across different cell types.
Figure 2.
ScRNA-sequencing of whole blood treated with CD20-TCB reveals an early phenotypic change in T cells, monocytes, and neutrophils. A, scRNA-seq of whole blood was performed using the BD Rhapsody platform at baseline (donors 1, 2, 3, and 4) and 2 hours (donors 3 and 4), 4 hours (donors 1 and 2), 6 hours (donors 3 and 4), and 20 hours (donors 1, 2, 3, and 4) after treatment with 0.2 μg/mL CD20-TCB. B, UMAP plot of immune cells colored by cell types reveals a large proportion of neutrophils. C, Stacked barplot with cell type proportions for each sample analyzed for scRNA-seq. D, UMAP plots of immune cells colored by treatment. The UMAP plots show single cells from all time points in gray, cells from baseline samples in green, cells from treated samples at 2-, 4-, 6-, and 20-hour time points in pink, and cells from untreated samples at 2-, 4-, 6-, and 20-hour time points in blue. Each dot represents one cell. E, Box plot representing the percentage of variance in gene expression attributed to treatment-induced changes between time points across different cell types.
Figure 3. The hallmark pathway analysis and cytokine expression reveal that myeloid cells are indirectly amplifying proinflammatory cytokine release after the initial activation of CD4+ and CD8+ T cells by CD20-TCB. scRNA-seq of whole blood treated with 0.2 μg/mL CD20-TCB was performed using the BD Rhapsody platform at baseline, 2, 4, 6, and 20 hours. A, Ridge plots representing the enrichment kinetics of the TNFα signaling via NF-κB, IL6 JAK STAT3, IFNγ response and inflammatory response hallmark pathways in CD4+, CD8+, monocytes, and neutrophils following treatment with CD20-TCB. B–E, Dot plots showing the kinetics of gene-expression distribution in (B) CD4+ T cells, (C) CD8+ T cells, (D) monocytes, and (E) neutrophils. The expression of TNFα (TNF), IFNγ (IFNG), IL1β (IL1B), IL6 (IL6), IL8 (CXCL8), MCP-1 (CCL2), MIP-1α (CCL3), MIP-1β (CCL4), and IP-10 (CXCL10) is depicted on the graph. The size of the dot represents the percentage of positive cells, and the color scale, the average gene expression.
Figure 3.
The hallmark pathway analysis and cytokine expression reveal that myeloid cells are indirectly amplifying proinflammatory cytokine release after the initial activation of CD4+ and CD8+ T cells by CD20-TCB. scRNA-seq of whole blood treated with 0.2 μg/mL CD20-TCB was performed using the BD Rhapsody platform at baseline, 2, 4, 6, and 20 hours. A, Ridge plots representing the enrichment kinetics of the TNFα signaling via NF-κB, IL6 JAK STAT3, IFNγ response and inflammatory response hallmark pathways in CD4+, CD8+, monocytes, and neutrophils following treatment with CD20-TCB. B–E, Dot plots showing the kinetics of gene-expression distribution in (B) CD4+ T cells, (C) CD8+ T cells, (D) monocytes, and (E) neutrophils. The expression of TNFα (TNF), IFNγ (IFNG), IL1β (IL1B), IL6 (IL6), IL8 (CXCL8), MCP-1 (CCL2), MIP-1α (CCL3), MIP-1β (CCL4), and IP-10 (CXCL10) is depicted on the graph. The size of the dot represents the percentage of positive cells, and the color scale, the average gene expression.
Figure 4. Activation of endothelial cells following exposure to cytokine-rich supernatants from T-cell–dependent cytotoxicity assay with CEA-TCB. A, Assay set-up. Cytokine-enriched supernatants from 48 hours coculture of PBMCs and MKN45 tumor cells with 4 nmol/L CEA-TCB or untargeted-TCB (DP47-TCB, negative control) were incubated on HUVEC cells for 5 hours. B, The percentage of MKN45 tumor cell lysis was assessed by LDH release measurements (48 hours). C, The expression of ICAM and VCAM on HUVECs was measured by flow cytometry 5 hours after incubation with cytokine-enriched supernatants. B and C, Means of technical triplicates + SD. D, Volcano plot depicting expressed genes in HUVECs following exposure to CEA-TCB–induced cytokine release, each dot represents one gene. The x-axis shows the logarithmic fold change, and the y-axis shows the negative log of the unadjusted P value for each gene by comparing samples exposed to CEA-TCB–induced cytokine release to those exposed to untargeted-TCB (negative control) supernatants.
Figure 4.
Activation of endothelial cells following exposure to cytokine-rich supernatants from T-cell–dependent cytotoxicity assay with CEA-TCB. A, Assay set-up. Cytokine-enriched supernatants from 48 hours coculture of PBMCs and MKN45 tumor cells with 4 nmol/L CEA-TCB or untargeted-TCB (DP47-TCB, negative control) were incubated on HUVEC cells for 5 hours. B, The percentage of MKN45 tumor cell lysis was assessed by LDH release measurements (48 hours). C, The expression of ICAM and VCAM on HUVECs was measured by flow cytometry 5 hours after incubation with cytokine-enriched supernatants. B and C, Means of technical triplicates + SD. D, Volcano plot depicting expressed genes in HUVECs following exposure to CEA-TCB–induced cytokine release, each dot represents one gene. The x-axis shows the logarithmic fold change, and the y-axis shows the negative log of the unadjusted P value for each gene by comparing samples exposed to CEA-TCB–induced cytokine release to those exposed to untargeted-TCB (negative control) supernatants.
Figure 5. Effect of TNFα blockade, IL6R blockade, NLRP3 inhibitor, and dexamethasone on CD20-TCB–mediated cytokine release and activity in the human whole blood assay system. WBA with escalating doses of CD20-TCB and TNFα blockade with adalimumab (1 μg/mL), IL6R blockade with tocilizumab (1 μg/mL), NLRP3i (10 μmol/L), and dexamethasone (100 nmol/L). Cytokine levels were measured by Luminex in serum of WBA at 24 hours. A, Cytokine release in the serum. Cytokine dose–response curves show data for 1 representative donor. Bar plots show AUC of cytokine dose–response curves for 3 donors with *, P < 0.05 by two-way ANOVA. B, The killing of CD19+ B cells and (C) the expression of CD25 on CD4+ and CD8+ T cells were measured by immune phenotyping of whole blood by flow cytometry after stimulation with 1 nmol/L CD20-TCB (24 hours). B and C, Means of n = 3 donors ± SEM.
Figure 5.
Effect of TNFα blockade, IL6R blockade, NLRP3 inhibitor, and dexamethasone on CD20-TCB–mediated cytokine release and activity in the human whole blood assay system. WBA with escalating doses of CD20-TCB and TNFα blockade with adalimumab (1 μg/mL), IL6R blockade with tocilizumab (1 μg/mL), NLRP3i (10 μmol/L), and dexamethasone (100 nmol/L). Cytokine levels were measured by Luminex in serum of WBA at 24 hours. A, Cytokine release in the serum. Cytokine dose–response curves show data for 1 representative donor. Bar plots show AUC of cytokine dose–response curves for 3 donors with *, P < 0.05 by two-way ANOVA. B, The killing of CD19+ B cells and (C) the expression of CD25 on CD4+ and CD8+ T cells were measured by immune phenotyping of whole blood by flow cytometry after stimulation with 1 nmol/L CD20-TCB (24 hours). B and C, Means of n = 3 donors ± SEM.
Figure 6. Effect of TNFα blockade, IL6R blockade, IL1R blockade, NLRP3i, and dexamethasone on CD20-TCB–mediated cytokine release and efficacy in a model of diffused large B-cell lymphoma in humanized mice. OCI-Ly18 (DLBCL)-bearing humanized NSG mice were pretreated with 30 mg/kg Gazyva (Gpt) and treated weekly with escalating doses of CD20-TCB (0.5, 1, 2 mg/kg). Adalimumab (25 mg/kg, TNFα blockade) and tocilizumab (10 mg/kg, IL6R blockade) were given 1 day and 1 hour before the first CD20-TCB infusion. Dexamethasone (1 mg/kg) was given 1 hour prior to each therapy. Anakinra (10 mg/kg, IL1R blockade) and the NLRP3 inhibitor (20 mg/kg) were administered 1 hour before, 4 hours and 24 hours after the first CD20-TCB infusion as well as 1 hour before and 4 hours after the second CD20-TCB treatment. A, Bar plot representing the individual levels of cytokines in the peripheral blood 3 hours after the first CD20-TCB infusion, means of n = 2–5 mice/group ± SEM. Ordinary one-way ANOVA, Tukey multiple comparison test with *, P < 0.05; **, P < 0.01; ***, P < 0.001 and ns > 0.99. The levels of cytokines were measured in serum by Luminex. B, Grouped tumor growth curves, means + SEM. Two-way ANOVA on day 25 with **, P < 0.01 and ns > 0.99. C, Intratumoral CD8+ T-cell count, 24 hours after third CD20-TCB infusion. Tumors were digested, and the counts of CD8+ T-cells were measured by flow cytometry. Bar plots representing the maximum and minimum values for n = 4 mice.
Figure 6.
Effect of TNFα blockade, IL6R blockade, IL1R blockade, NLRP3i, and dexamethasone on CD20-TCB–mediated cytokine release and efficacy in a model of diffused large B-cell lymphoma in humanized mice. OCI-Ly18 (DLBCL)-bearing humanized NSG mice were pretreated with 30 mg/kg Gazyva (Gpt) and treated weekly with escalating doses of CD20-TCB (0.5, 1, 2 mg/kg). Adalimumab (25 mg/kg, TNFα blockade) and tocilizumab (10 mg/kg, IL6R blockade) were given 1 day and 1 hour before the first CD20-TCB infusion. Dexamethasone (1 mg/kg) was given 1 hour prior to each therapy. Anakinra (10 mg/kg, IL1R blockade) and the NLRP3 inhibitor (20 mg/kg) were administered 1 hour before, 4 hours and 24 hours after the first CD20-TCB infusion as well as 1 hour before and 4 hours after the second CD20-TCB treatment. A, Bar plot representing the individual levels of cytokines in the peripheral blood 3 hours after the first CD20-TCB infusion, means of n = 2–5 mice/group ± SEM. Ordinary one-way ANOVA, Tukey multiple comparison test with *, P < 0.05; **, P < 0.01; ***, P < 0.001 and ns > 0.99. The levels of cytokines were measured in serum by Luminex. B, Grouped tumor growth curves, means + SEM. Two-way ANOVA on day 25 with **, P < 0.01 and ns > 0.99. C, Intratumoral CD8+ T-cell count, 24 hours after third CD20-TCB infusion. Tumors were digested, and the counts of CD8+ T-cells were measured by flow cytometry. Bar plots representing the maximum and minimum values for n = 4 mice.

Comment in

  • Druggable Targets in Cytokine Release Syndromes.
    Luri-Rey C, Eguren-Santamaria I, Matos I, Berraondo P, Melero I. Luri-Rey C, et al. Clin Cancer Res. 2023 Nov 1;29(21):4320-4322. doi: 10.1158/1078-0432.CCR-23-1975. Clin Cancer Res. 2023. PMID: 37656058

References

    1. Bacac M, Klein C, Umana P. CEA TCB: a novel head-to-tail 2:1 T cell bispecific antibody for treatment of CEA-positive solid tumors. Oncoimmunology 2016;5:e1203498. - PMC - PubMed
    1. Bacac M, Fauti T, Sam J, Colombetti S, Weinzierl T, Ouaret D, et al. . A novel carcinoembryonic antigen T-cell bispecific antibody (CEA TCB) for the treatment of solid tumors. Clin Cancer Res 2016;22:3286–97. - PubMed
    1. Bacac M, Colombetti S, Herter S, Sam J, Perro M, Chen S, et al. . CD20-TCB with obinutuzumab pretreatment as next-generation treatment of hematologic malignancies. Clin Cancer Res 2018;24:4785–97. - PubMed
    1. Ishiguro T, Sano Y, Komatsu SI, Kamata-Sakurai M, Kaneko A, Kinoshita Y, et al. . An anti-glypican 3/CD3 bispecific T cell-redirecting antibody for treatment of solid tumors. Sci Transl Med 2017;9:eaal4291. - PubMed
    1. Klein C, Augsberger C, Xu W, Heitmüller C, Hanisch L, Sam J, et al. . Targeting intracellular WT1 in AML utilizing a T cell bispecific antibody construct: augmenting efficacy through combination with lenalidomide. Blood 2019;134(Supplement_1):4450.