. 2023 Aug;620(7974):660-668.
doi: 10.1038/s41586-023-06356-2. Epub 2023 Jun 28.

Fanzor is a eukaryotic programmable RNA-guided endonuclease

Affiliations

Fanzor is a eukaryotic programmable RNA-guided endonuclease

Makoto Saito et al. Nature. 2023 Aug.

Abstract

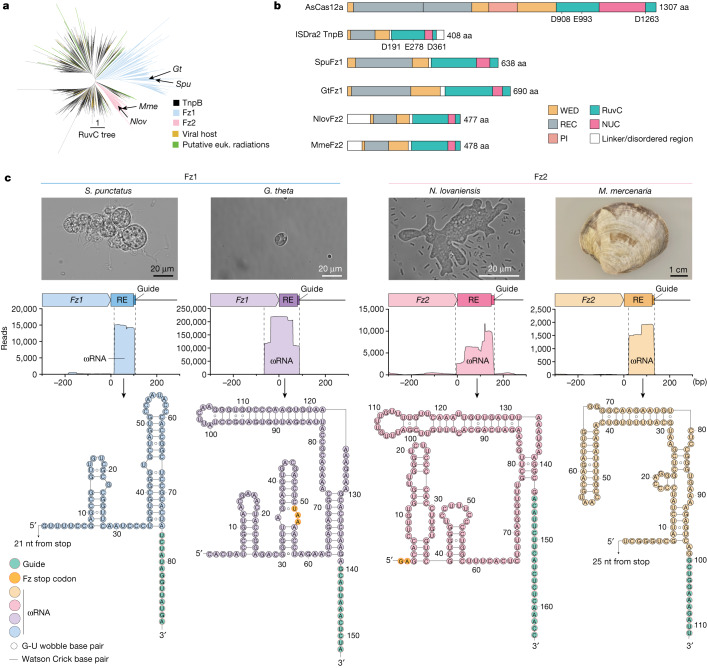
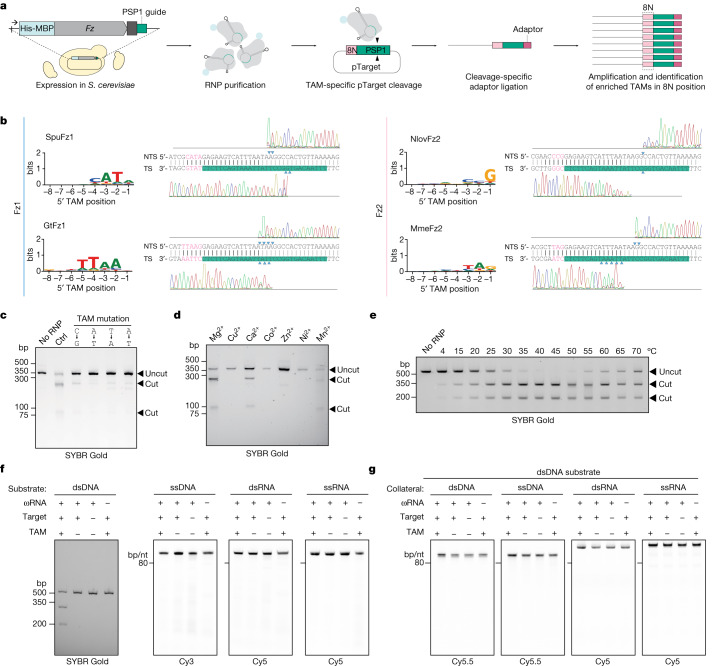
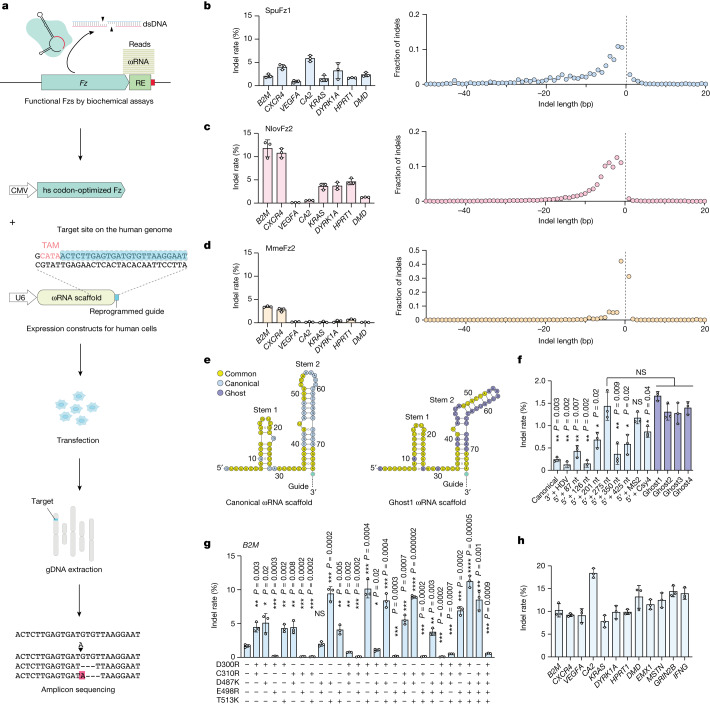
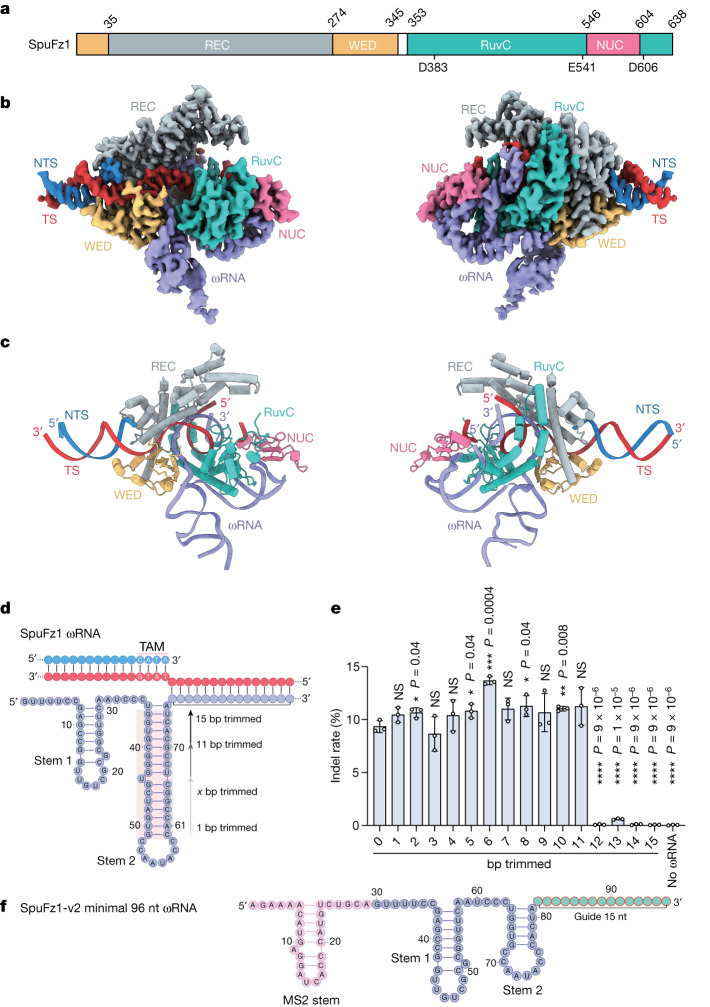
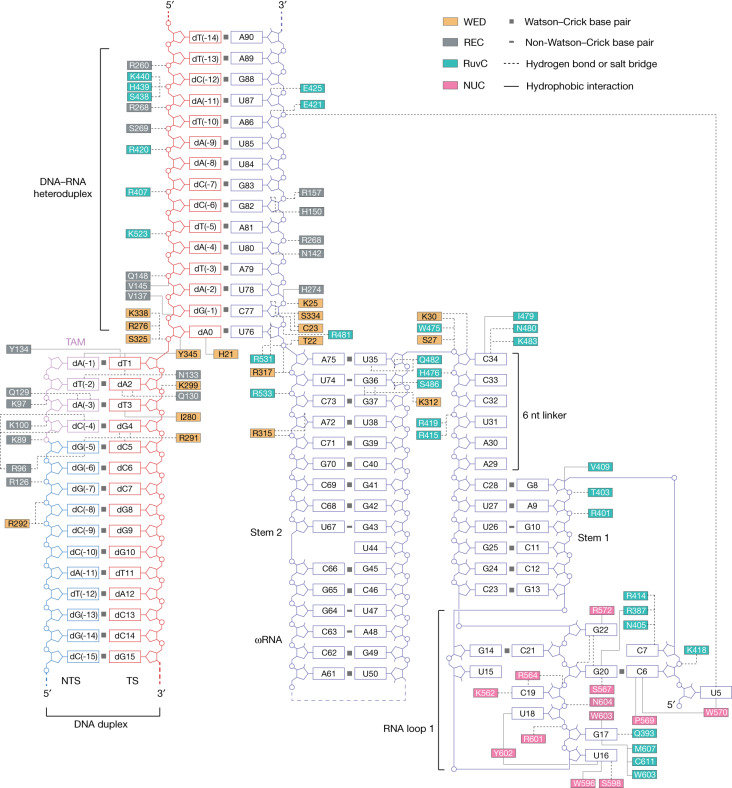
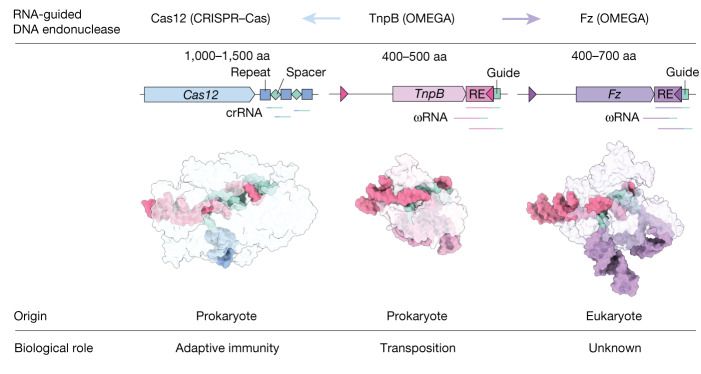
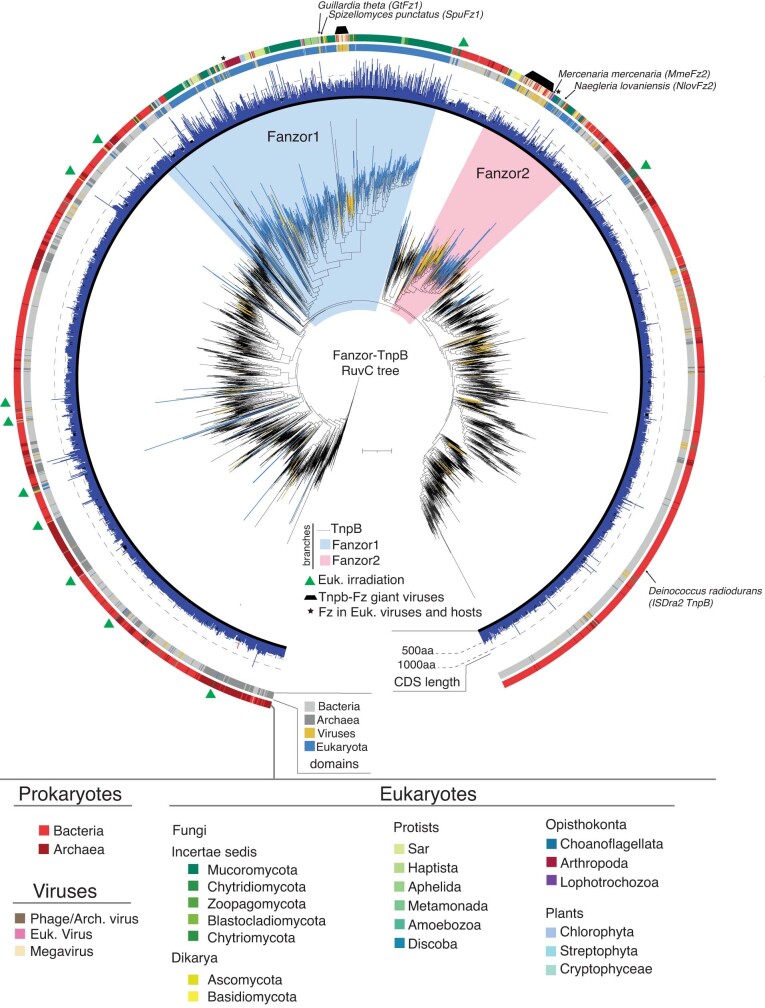
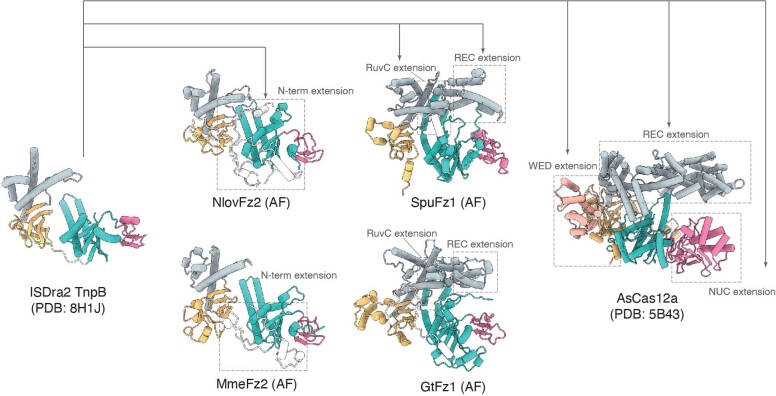
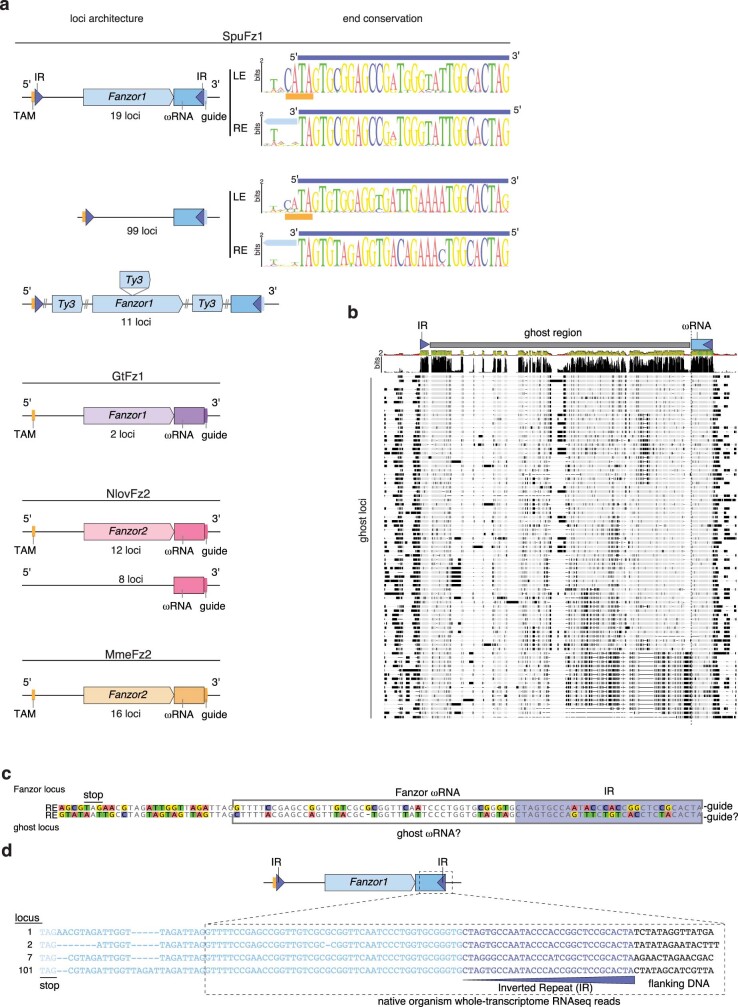
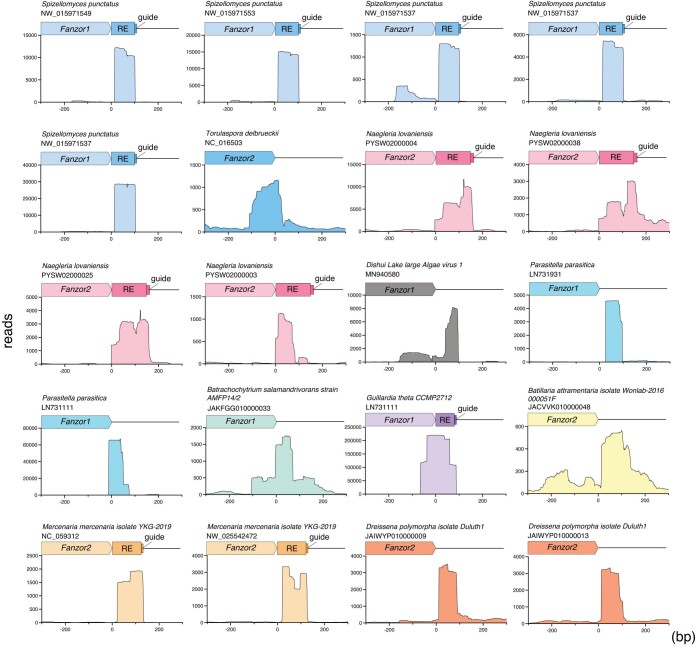
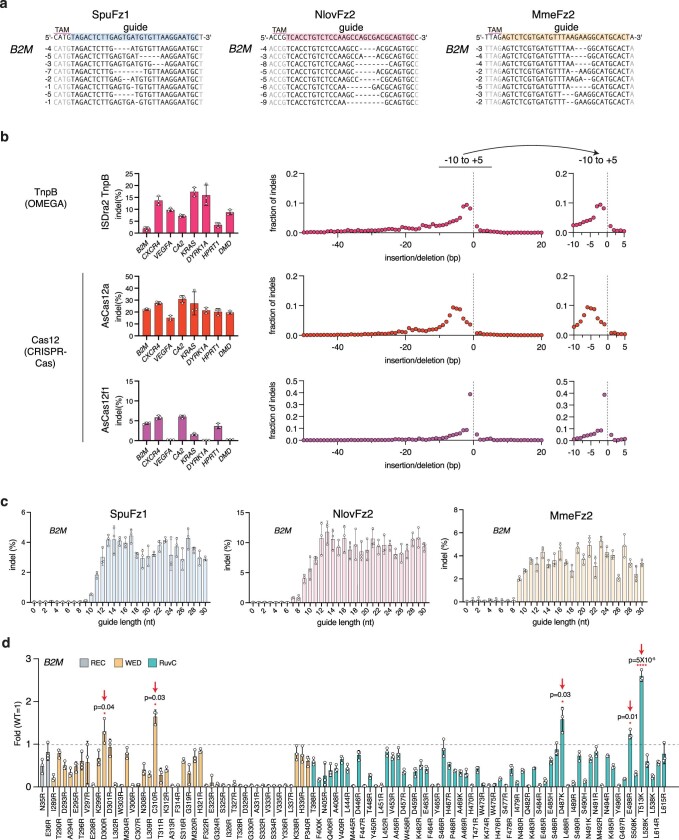
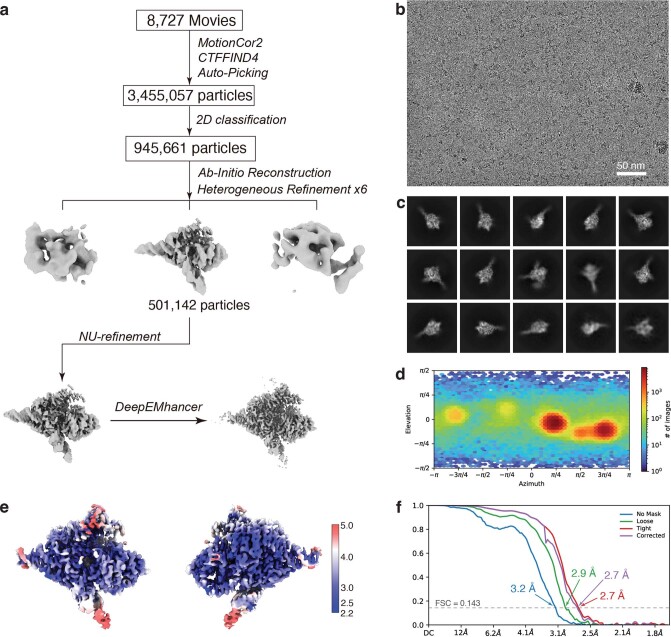
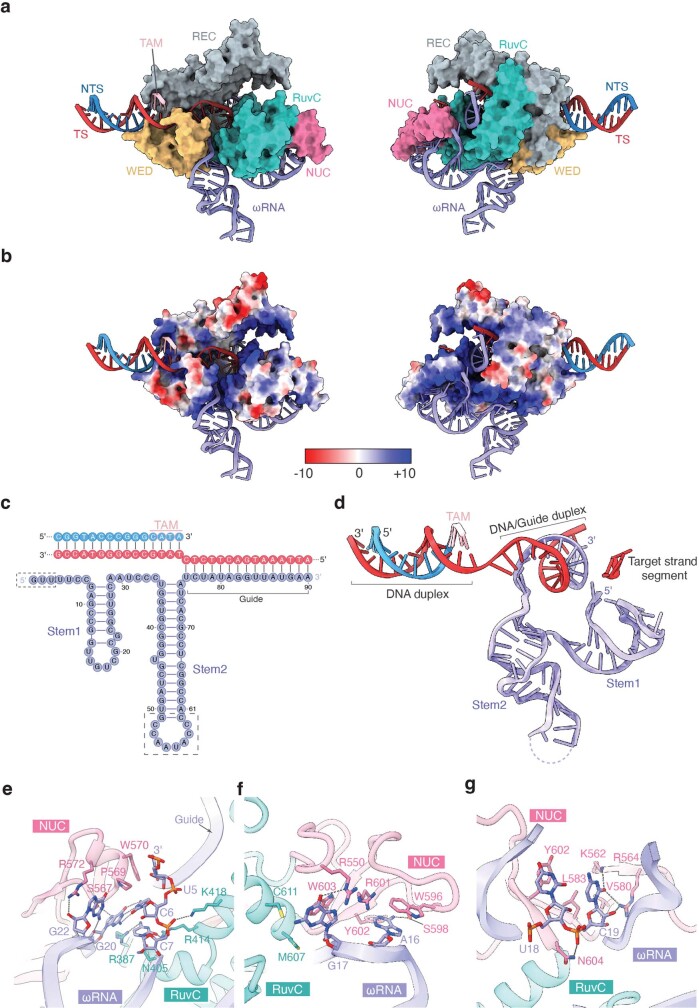
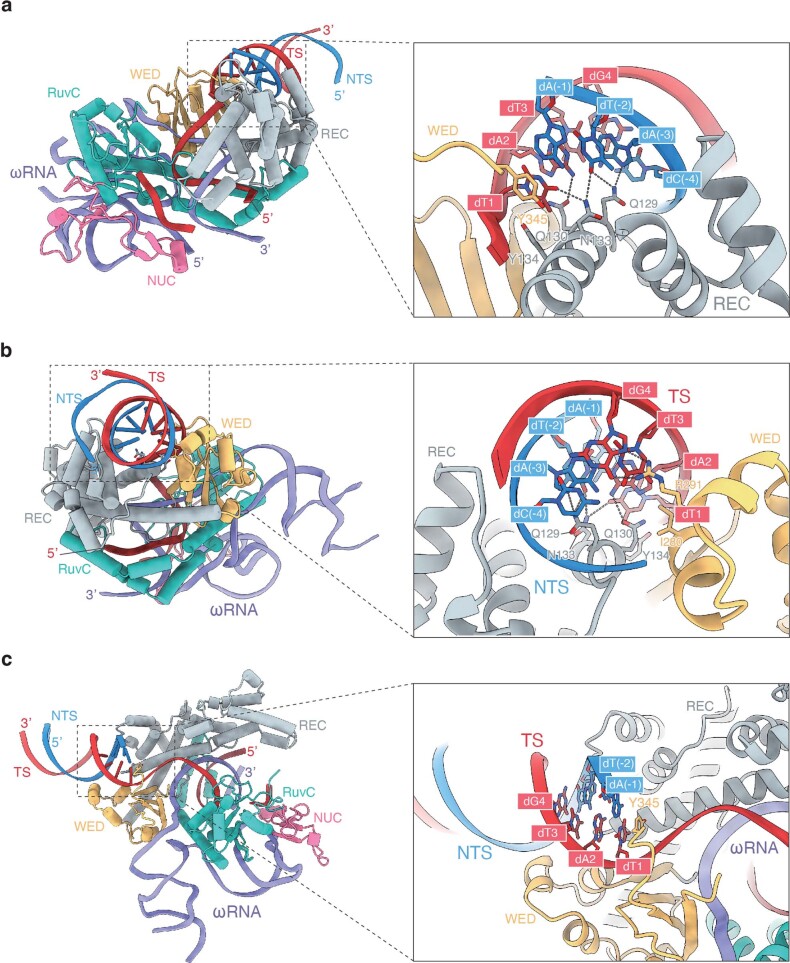
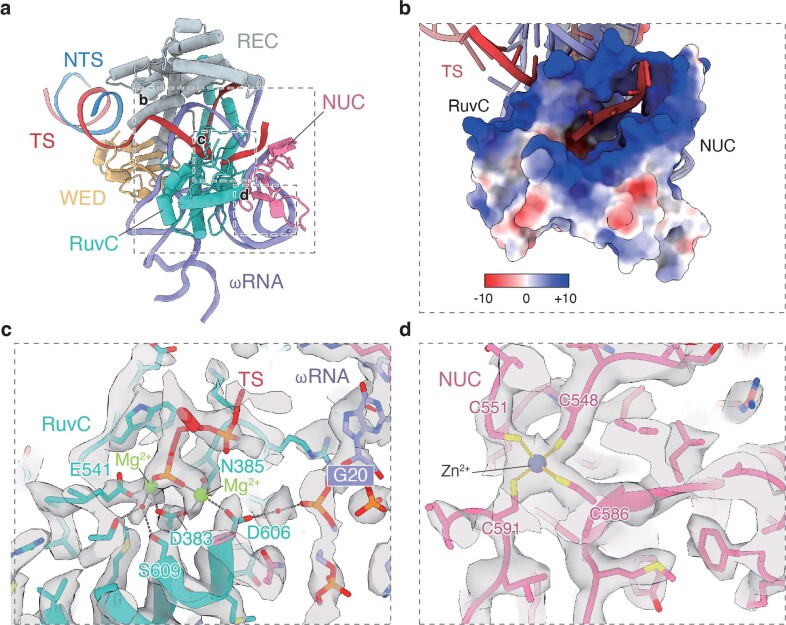
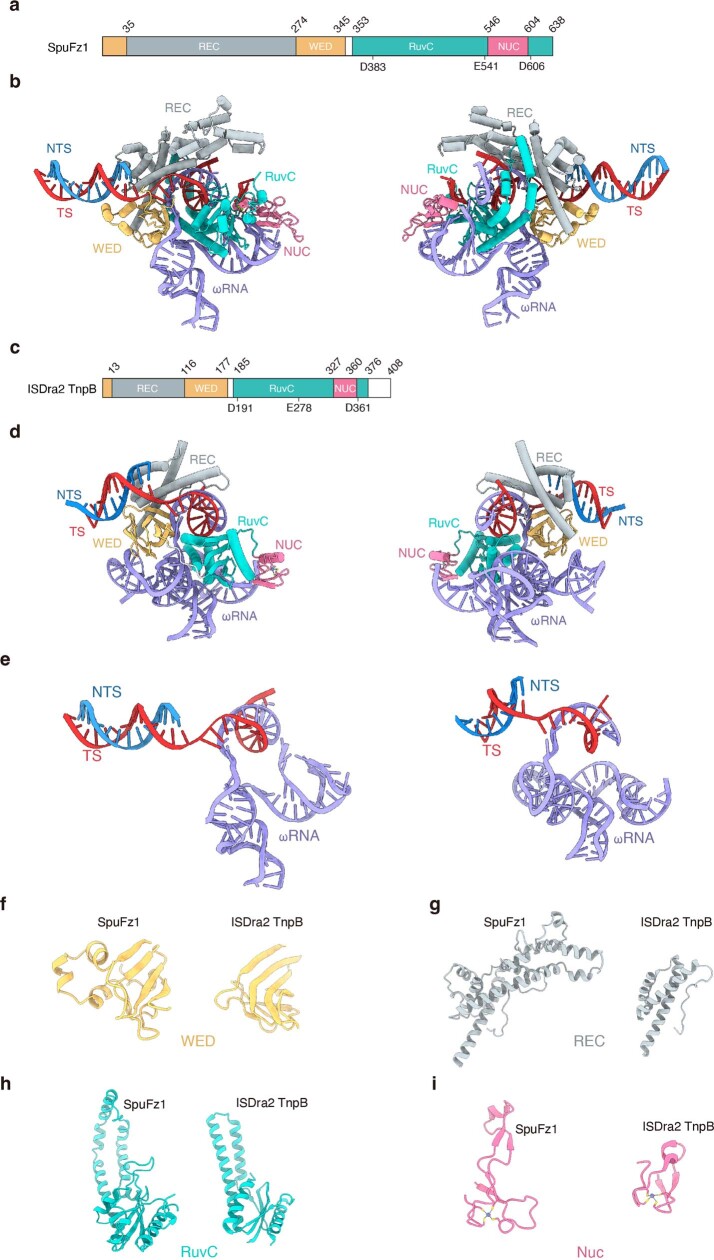
RNA-guided systems, which use complementarity between a guide RNA and target nucleic acid sequences for recognition of genetic elements, have a central role in biological processes in both prokaryotes and eukaryotes. For example, the prokaryotic CRISPR-Cas systems provide adaptive immunity for bacteria and archaea against foreign genetic elements. Cas effectors such as Cas9 and Cas12 perform guide-RNA-dependent DNA cleavage1. Although a few eukaryotic RNA-guided systems have been studied, including RNA interference2 and ribosomal RNA modification3, it remains unclear whether eukaryotes have RNA-guided endonucleases. Recently, a new class of prokaryotic RNA-guided systems (termed OMEGA) was reported4,5. The OMEGA effector TnpB is the putative ancestor of Cas12 and has RNA-guided endonuclease activity4,6. TnpB may also be the ancestor of the eukaryotic transposon-encoded Fanzor (Fz) proteins4,7, raising the possibility that eukaryotes are also equipped with CRISPR-Cas or OMEGA-like programmable RNA-guided endonucleases. Here we report the biochemical characterization of Fz, showing that it is an RNA-guided DNA endonuclease. We also show that Fz can be reprogrammed for human genome engineering applications. Finally, we resolve the structure of Spizellomyces punctatus Fz at 2.7 Å using cryogenic electron microscopy, showing the conservation of core regions among Fz, TnpB and Cas12, despite diverse cognate RNA structures. Our results show that Fz is a eukaryotic OMEGA system, demonstrating that RNA-guided endonucleases are present in all three domains of life.


Conflict of interest statement

M.S., P.X., G.F., S.K., H.A.-T. and F.Z. are co-inventors on a patent application (PCT/US2022/081593) related to this work filed by the Broad Institute and MIT. F.Z. is a scientific advisor and cofounder of Editas Medicine, Beam Therapeutics, Pairwise Plants, Arbor Biotechnologies, Proof Diagnostics and Aera Therapeutics. F.Z. is a scientific advisor for Octant. The remaining authors declare no competing interests.

Figures

Fig. 1
Fig. 1. Phylogenetic analysis of Fz.
a, Unrooted phylogenetic tree from representatives mined from Fz and TnpB. Arrows indicate Fz genes experimentally characterized in this study (SpuFz1, GtFz1, NlovFz2 and MmeFz2). A detailed tree is shown in Extended Data Fig. 1. b, Domain architectures of AsCas12a, ISDra2 TnpB, SpuFz1, GtFz1, NlovFz2 and MmeFz2 determined from structural analysis (Extended Data Fig. 2). c, Top, micrographs of S. punctatus, G. theta and N. lovaniensis and a photograph of M. mercenaria. Representative images from three independent cultures are shown. Middle, small RNA-seq for RNPs of four representative Fz orthologues expressed in S. cerevisiae (n = 3 independent technical replicates). Bottom, secondary structure prediction of ωRNAs for the four representative orthologues. When the ωRNA overlaps the Fz gene, the stop codon is shown in orange; when there is no overlap, the distance to the stop codon is indicated with an arrow. The guide region is shown in green and oriented vertically for comparison. euk., eukaryotic; PI, PAM interacting; RE, right end.
Fig. 2
Fig. 2. Biochemical characterization of Fz.
a, Scheme of TAM identification screen in S. cerevisiae. b, TAMs of four representative Fz orthologues (SpuFz1, GtFz1, NlovFz2 and MmeFz2) and Sanger sequencing traces of the dsDNA targets with PSP1 target sequence matching reprogrammed ωRNA guides. The non-templated addition of a final base was an artefact of the polymerase (as a terminal A in the target strand trace and a terminal T in the NTS trace). Cleavage sites are indicated by blue triangles. c, SpuFz1-mediated target dsDNA cleavage with TAM mutations. Target dsDNA substrates were column-purified after proteinase treatment and run on a 2% agarose gel. d, SpuFz1-mediated target dsDNA cleavage dependence on divalent metal ions. Target dsDNA substrates were column-purified after proteinase treatment and run on a 2% agarose gel. All experiments except those corresponding to this panel were performed with Mg2+. e, Temperature dependence of SpuFz1-mediated target dsDNA cleavage activity. All experiments except those corresponding to this panel were performed at 37 °C. f, SpuFz1 cleaves only target dsDNA. Target nucleic acid species were column-purified after proteinase treatment and run on a 2% agarose gel (for dsDNA) or denaturing polyacrylamide gel (for ssDNA, dsRNA and ssRNA). The gels were imaged with SYBR Gold (for dsDNA channels) or Cy3 (for ssDNA channels) and Cy5 (for dsRNA and ssRNA channels). g, SpuFz1 did not show collateral activity on Cy5.5-labelled collateral dsDNA, Cy5.5-labelled collateral ssDNA, Cy5-labelled collateral dsRNA or Cy5-labelled collateral ssRNA. Representative gel images from three independent technical replicates are shown. Ctrl, control; TS, target strand.
Fig. 3
Fig. 3. Human genome engineering with Fz.
a, Workflow for testing Fz activity in HEK293FT cells. bd, Indel rates and average indel lengths generated by SpuFz1 (b), NlovFz2 (c) and MmeFz2 (d) at eight genomic loci in HEK293FT cells. Left, average indel rate (%); data are presented as mean ± s.d. (n = 3). Right, average indel length at B2M target site. e, Secondary structure prediction of canonical (left) and ghost (right) ωRNAs for SpuFz1. Identical nucleotides between canonical and ghost ωRNA are highlighted in yellow. Guide region has been abbreviated for visualization purposes. f, SpuFz1 activity at B2M with canonical ωRNA, modified ωRNA and ghost ωRNA scaffolds. Average indel rate (%); data are presented as mean ± s.d. (n = 3). Statistical analysis was by two-tailed t test. *P < 0.05; **P < 0.01. g, Indel activity of combinatorial SpuFz1 point mutants at B2M. Average indel rate (%); data are presented as mean ± s.d. (n = 3). Statistical analysis was by two-tailed t test. *P < 0.05; **P < 0.01; ***P < 0.001; ****P < 0.0001. h, SpuFz1-v2 activity at 12 human genomic loci. Average indel (%); data are presented as mean ± s.d. (n = 3). gDNA, genomic DNA; HDV, hepatitis delta virus; hs, Homo sapiens; NS, not significant.
Fig. 4
Fig. 4. Structure of SpuFz1.
a, Domain organization of SpuFz1. White regions represent the flexible loop. b, Cryo-EM map of SpuFz1–ωRNA–target DNA complex. c, Structural model of SpuFz1–ωRNA–target DNA complex. REC domain is coloured grey, WED domain is coloured yellow, RuvC domain is coloured light blue, NUC domain is coloured pink, ωRNA is coloured purple, DNA TS is coloured red and DNA NTS is coloured blue. d, Diagram of SpuFz1 ωRNA and trimmed variants. e, SpuFz1-v2 activity at B2M with trimmed ωRNA variants. Average indel rate (%); data are presented as mean ± s.d. (n = 3). Statistical analysis was by two-tailed t test. *P < 0.05; **P < 0.01; ***P < 0.001; ****P < 0.0001. f, Minimal SpuFz1 ωRNA design.
Fig. 5
Fig. 5. Schematic of ωRNA and target DNA recognition.
The aa residues that engage in interactions with nucleic acids are highlighted in coloured boxes, with the colours specified by the domains where these residues reside. Hydrogen bonds and salt bridges are shown by dashed lines. Hydrophobic interactions are shown by solid lines.
Fig. 6
Fig. 6. Fz, TnpB and Cas12.
OMEGA systems are the ancestors of CRISPR–Cas systems. The ancestral ωprotein TnpB became associated with CRISPR arrays and evolved into Cas12 in prokaryotes and Fz in eukaryotes. Cas12 works as a CRISPR effector protein for adaptive immunity. TnpB helps to propagate insertion sequences in which it is encoded. The biological roles of Fzs remain unknown. ωproteins Fz and TnpB are relatively compact proteins (400–700 and 400–500 aa, respectively) compared with Cas12 proteins (1,000–1,500 aa). crRNA, CRISPR RNA.
Extended Data Fig. 1
Extended Data Fig. 1. Phylogenetic tree of Fanzor and TnpB.
Phylogenetic tree built from the RuvC region of hits detected from structural and profile mining of Fanzor. Blue, black and yellow leaves indicate the domain annotation of the contig where the hit is found respectively eukaryotes, viruses and prokaryotes. Fanzor1 and Fanzor2 clades are shown respectively in blue and pink. Fanzors and TnpB of interest are indicated by arrows. The bars forming the blue inner ring are proportional to the size of the Fanzors in aa as annotated in the database. The middle ring indicates the domains of life from which the Fanzor/TnpB is found (light gray: bacteria, dark gray: archaea, yellow: viruses, blue: eukaryotes). The outer ring displays the taxonomy of the organism in which the Fanzor/TnpB is found (red: bacteria, dark red: archaea, brown: phage and archaeal viruses, pink: eukaryotic viruses, beige: giant viruses, dark green to yellow gradient: fungi, light green gradient: protists, dark blue: opisthokonta (choanoflagellata), crimson: arthropoda, purple: mollusks, and light blue to dark blue gradient: plants with Chlorophyta, Streptophyta, and Cryptophyceae. The green triangles in the outer ring indicate clusters of hits from contigs annotated to be eukaryotes and represent putative eukaryotic radiations. Black trapezoid shapes indicate the two branches containing giant viruses and bacterial hosts.
Extended Data Fig. 2
Extended Data Fig. 2. Structural overview and comparative analysis of representative Fanzor proteins.
Structural comparison of ISDra2 TnpB (PDB: 8H1J), NlovFz2 (AlphaFold model, AF), MmeFz2 (AF), SpuFz1 (AF), GtFz1 (AF) and AsCas12a (PDB: 5B43). Color coding represents common structural regions. Arrows highlight the hypothesized evolutionary progression from TnpB to Fanzors and Cas12a. Fanzor1, Fanzor2 and Cas12a likely emerged independently from TnpBs and acquired various extensions in the N-terminal region (N-term), REC domain, RuvC domain and NUC domain. The extensions in Fanzor1 (represented by SpuFz1 and GtFz1) involve the REC and RuvC domains, which form a channel that is similar to the one found in Cas12a.
Extended Data Fig. 3
Extended Data Fig. 3. Fanzor and standalone ghost loci architecture.
a, Top: Comparison of loci architecture for Fz gene and ghost in S. punctatus and comparison of their Weblogo inverted repeat sequences (IR). IRs are shown as blue triangles, TAM regions as orange rectangles, Fz gene as a light blue arrow, ωRNA regions as medium blue rectangles with a downstream light blue rectangle showing the guide (spacer region). Fanzor and ghost loci share similar but distinct IRs. Bottom: Comparison of loci architecture for Fz gene and ghost in G. theta, N. lovaniensis, and M. mercenaria. b, Sequences alignments of ghost loci from IR to IR. Schematic of the architecture is shown on top of the alignment. Conservation is shown as bits on the top row. In the alignment, grey color indicates identity, black color indicates differences and lines indicate gaps. The sequences are sorted according to a phylogenetic tree made from the full nucleotide sequences in FastTree. IRs and ωRNA regions are strongly conserved across all ghost loci. c, Sequence alignment of the ωRNA region or IR of a Fanzor locus and a ghost locus. Nucleotide background colors highlight differences between ωRNAs. d, Small RNA-seq of Fanzor loci from S. punctatus shows expression of associated ωRNAs.
Extended Data Fig. 4
Extended Data Fig. 4. Small RNA-seq of RNPs of Fz orthologs expressed in Saccharomyces cerevisiae.
Small RNA-seq of RNPs of Fz orthologs expressed in S. cerevisiae mapped to the Fz loci. RE, transposon right end.
Extended Data Fig.5
Extended Data Fig.5. Human genome targeting activity of Fanzor, TnpB and Cas12.
a, Indels generated by Fzs at the B2M locus ordered by abundance, with indel size at left. Left: SpuFz1. Middle: NlovFz2. Right: MmeFz2. b, Indel rates and average indel length generated by ISDra2 TnpB, AsCas12a and AsCas12f1 at 8 genomic loci in HEK293FT cells. Left: The average indel (%) generated is shown with an error bar showing standard deviation (n = 3). Right: Indel pattern from −50 to +20 bp with inset showing the indel pattern spanning 10-bp deletion to 5-bp insertion. c, Targeting SpuFz1, NlovFz2 and MmeFz2 to a representative B2M locus in HEK293FT cells with ωRNAs containing guides of various lengths. The average indel (%) generated is shown with an error bar showing standard deviation (n = 3). Left: SpuFz1. Middle: NlovFz2. Right: MmeFz2. d, Indel activity (relative to WT) of 111 single point mutants measured in HEK293T cells at a representative B2M locus. Red arrows indicate the five mutations tested further in a combinatorial manner. The average indel (%) generated is shown with an error bar showing standard deviation (n = 3). Statistical analysis was performed using a two-tailed t-test. Significant increase compared to WT is indicated by (*). *, p < 0.05; ****, p < 0.0001.
Extended Data Fig. 6
Extended Data Fig. 6. Cryo-EM data processing for the SpuFz1-ωRNA-target DNA complex.
a, Flow chart of cryo-EM data analysis. b, Representative cryo-EM image from 8,727 movies. c, Representative and 2D averages. d, Angular distribution of the SpuFz1-ωRNA-target DNA particles in the final round of 3D refinement. e, Sharpened EM density maps colored by local resolution as calculated by CryoSPARC. f, The ‘gold-standard’ FSC curves of the SpuFz1-ωRNA-target DNA complex.
Extended Data Fig. 7
Extended Data Fig. 7. Structure of the ωRNA and target DNA recognition.
a, The overall structure of the SpuFz1-ωRNA-target DNA complex. Domain structure shown in surface and by colors. b, Electrostatic surface potential of SpuFz1. c, Schematic of the ωRNA and target DNA. Disordered regions are enclosed in a dashed box. d, Structural model of the ωRNA and target DNA. e-g, The structural details of the interaction between stem loop 1 and SpuFz1.
Extended Data Fig. 8
Extended Data Fig. 8. TAM recognition by SpuFz1.
a-b, Interactions between the TAM and SpuFz1. c, Interactions between the end of the TAM and the WED domain loop of SpuFz1.
Extended Data Fig. 9
Extended Data Fig. 9. The structure of RuvC and NUC domains and the active site of SpuFz1.
a, Structure of a DNA target strand segment bound to the RuvC and NUC domains of SpuFz1. b, Electrostatic surface potential of the RuvC and NUC domains. c, Structural details of the active site. d, Structure of the zinc finger motif in the NUC domain of SpuFz1.
Extended Data Fig. 10
Extended Data Fig. 10. Structure comparison of SpuFz1 with ISDra2 TnpB.
a, Domain architecture of SpuFz1. b, Overall structure of the SpuFz1–ωRNA–target DNA complex. c, Domain architecture of ISDra2 TnpB. d, Overall structure of the ISDra2 TnpB–ωRNA–target DNA complex (PDB code: 8H1J). Corresponding domains across structures are color-coded. e, Nucleic acid structure comparison. SpuFz1’s ωRNA lacks the pseudoknot structure inherent to ISDra2 TnpB. f, WED domain structure comparison. In contrast to the WED domain of ISDra2 TnpB, SpuFz1 exhibits three inserted small alpha helical structures, which provides interactions with TAM motifs of target DNA. g, REC domain structure comparison. An additional sequence of 136 aa is inserted within the REC domain of SpuFz1 relative to ISDra2 TnpB. h, RuvC domain structure comparison. The helices of SpuFz1’s RuvC domain are extended and interact with the additional part of the REC domain, providing enhanced structural protection for the RNA/DNA heteroduplex compared to ISDra2 TnpB. i, NUC domain structure comparison. Both SpuFz1 and ISDra2 TnpB share a conserved CCCC zinc finger motif in the NUC domain. The additional NUC structure in SpuFz1 aids in stabilizing the 5′ end of its ωRNA, which forms interactions with the RNA/DNA heteroduplex.

Comment in

References

    1. Hille F, et al. The biology of CRISPR-Cas: backward and forward. Cell. 2018;172:1239–1259. doi: 10.1016/j.cell.2017.11.032. - DOI - PubMed
    1. Ozata DM, Gainetdinov I, Zoch A, O’Carroll D, Zamore PD. PIWI-interacting RNAs: small RNAs with big functions. Nat. Rev. Genet. 2019;20:89–108. doi: 10.1038/s41576-018-0073-3. - DOI - PubMed
    1. Kiss T. Small nucleolar RNAs: an abundant group of noncoding RNAs with diverse cellular functions. Cell. 2002;109:145–148. doi: 10.1016/S0092-8674(02)00718-3. - DOI - PubMed
    1. Altae-Tran H, et al. The widespread IS200/IS605 transposon family encodes diverse programmable RNA-guided endonucleases. Science. 2021;374:57–65. doi: 10.1126/science.abj6856. - DOI - PMC - PubMed
    1. Hirano S, et al. Structure of the OMEGA nickase IsrB in complex with ωRNA and target DNA. Nature. 2022;610:575–581. doi: 10.1038/s41586-022-05324-6. - DOI - PMC - PubMed

Publication types

MeSH terms

Supplementary concepts