. 2023 Aug;120(2):105-121.
doi: 10.1111/mmi.15110. Epub 2023 Jun 28.

Bacillus subtilis extracellular protease production incurs a context-dependent cost

Affiliations

Bacillus subtilis extracellular protease production incurs a context-dependent cost

Thibault Rosazza et al. Mol Microbiol. 2023 Aug.

Abstract

Microbes encounter a wide range of polymeric nutrient sources in various environmental settings, which require processing to facilitate growth. Bacillus subtilis, a bacterium found in the rhizosphere and broader soil environment, is highly adaptable and resilient due to its ability to utilise diverse sources of carbon and nitrogen. Here, we explore the role of extracellular proteases in supporting growth and assess the cost associated with their production. We provide evidence of the essentiality of extracellular proteases when B. subtilis is provided with an abundant, but polymeric nutrient source and demonstrate the extracellular proteases as a shared public good that can operate over a distance. We show that B. subtilis is subjected to a public good dilemma, specifically in the context of growth sustained by the digestion of a polymeric food source. Furthermore, using mathematical simulations, we uncover that this selectively enforced dilemma is driven by the relative cost of producing the public good. Collectively, our findings reveal how bacteria can survive in environments that vary in terms of immediate nutrient accessibility and the consequent impact on the population composition. These findings enhance our fundamental understanding of how bacteria respond to diverse environments, which has importance to contexts ranging from survival in the soil to infection and pathogenesis scenarios.

Keywords: extracellular proteases; nutrient accessibility; public good dilemma.


Conflict of interest statement

The authors declare that they have no known competing financial interests or personal relationships that could have appeared to influence the work reported in this paper.

Figures

FIGURE 1
FIGURE 1
Selection of a polymeric nutrient source. BSA digestion assay using the culture supernatant after monoculture culture of NCIB 3610 (WT) and NRS5645 (Δ8) strains before (Ø) and after heat treatment (HT). BSA protein was mixed in water (BSA) or with culture supernatants for 12 h at 37°C. A representative image of three independent experiments is shown. BSA, bovine serum albumin.
FIGURE 2
FIGURE 2
Extracellular proteases are essential for growth when using polymeric nutrient sources. Growth (a, c, e) and percentage sporulation (b, d, f) of NCIB 3610 (WT, purple) and NRS5645 (Δ8, green) in (a, b) 1% BSA (w/v) (BSA); (c, d) 0.5% glycerol (v/v) and 1% BSA (w/v) (BSA + gly); (e, f) 0.5% glutamic acid (w/v) and 0.5% glycerol (v/v) (Ga + Gly). (a, c, e) Points represent OD600 values (n = 3 biological replicates with two technical replicates), lines represent median and coloured areas represent CI 95%. (b, d, f) Points represent % spores (n = 3 biological replicates) and lines represent median. BSA, bovine serum albumin.
FIGURE 3
FIGURE 3
Extracellular protease production is not influenced by the nutrient levels. (a) Yield of the NCIB 3610 strain obtained at different time points in media containing 0.5% glycerol (v/v) with a BSA concentration ranging between 0% and 2% (w/v). Points represent OD600 values (n = 3) and lines represent the median. (b) The growth rate obtained from exponential regression performed on the yield of growth values displayed in (a). Each point represents the growth rate calculated for each replicate (n = 3) for all BSA concentration ranging between 0% and 2% (w/v). The lines represent the median. (c) Extracellular protease activity in the supernatant normalised to the total yield for a BSA concentrations ranging between 0% and 2% (w/v). Points represent fluorescence intensity/OD600 (n = 3), and lines represent the median. BSA, bovine serum albumin.
FIGURE 4
FIGURE 4
Collective role of extracellular proteases in supporting growth. Yield at 96 h in media containing 0.5% (v/v) glycerol and 1% (w/v) BSA for NCIB 3610 (WT), NRS5645 (Δ8) and for (a) single deletions strains ΔaprE, Δbpr, Δepr, Δmpr, ΔnprB, ΔnprE, Δvpr, ΔwprA (NRS3657, NRS6047, NRS3658, NRS3659, NRS3660, NRS3661, NRS7010 and NRS6810, respectively) and for (b) single extracellular protease producer strains Δ7‐aprE, Δ7‐bpr, Δ7‐epr, Δ7‐mpr, Δ7‐nprB, Δ7‐nprE, Δ7‐vpr, Δ7‐wprA (NRS3679, NRS3680, NRS3681, NRS 3882, NRS3683, NRS3684, NRS3685 and NRS6362, respectively). In both cases each point represents the OD600 values (n = 3 biological replicates and 1 technical replicate) and the lines represent the median. BSA, bovine serum albumin.
FIGURE 5
FIGURE 5
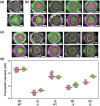
Extracellular proteases are a public good. (a) Transwell® assay control merge images of reflected light and GFP (false coloured green) fluorescence channel after growth in 0.5% glutamic acid (w/v) and 0.5% glycerol (v/v) (right) and WT‐GFP (NRS1473) (green) only inoculated in the inner Transwell (left). (b) Transwell assay merge images of reflected light, fluorescence from both the GFP (false coloured green) and mKate (false coloured magenta) channels after growth in 0.5% glutamic acid (w/v) and 0.5% glycerol (v/v) media for various strain combinations. WT‐GFP (NRS1473) or WT mKate (NRS6932) and Δ8 GFP (NRS3648) or Δ8 mKate (NRS3670). Conditions are annotated following this pattern: strain above dashed‐line = Transwell population, name below dashed‐line = outer well population. The yellow circles represent the region of interest used to quantify fluorescence values in the Transwell. For (a, b) a representative image of three independent experiments is shown. The scale bar represents 5 mm. (c) Transwell assay merge images of reflected light, fluorescence from both the GFP (false coloured green) and mKate (false coloured magenta) channels after growth in 1% BSA (w/v) and 0.5% glycerol (v/v) media for different strain combinations [see (b)]. A representative image of three independent experiments is shown. The scale bar represents 5 mm. (d) Transwell fluorescence intensity after growth as detailed in (c). Each point represents fluorescence intensity values (n = 3 biological replicates with two technical replicates) and the line represents the median value. BSA, bovine serum albumin.
FIGURE 6
FIGURE 6
Exploration of the public good dilemma when extracellular proteases are shared. (a) Schematic of the mathematical model. Producers, W, of extracellular proteases E and non‐producers C, can grow in response to two different nutrient sources; a nutrient A, representing glutamic acid/glycerol, and an alternative nutrient B d , representing degraded BSA. Both producers and non‐producers are assumed to sporulate in response to a lack of nutrient. Available nutrients are represented by A in the model. BSA is represented by B. The nutrient A can be used directly by W and C. However, B requires the action of the protease E to convert it to Bd and before it can be used by W or C. (b) In‐silico total yield (W+C+Ws+Cs) at t=100 for different initial strain proportions. (c) In‐silico non‐producer relative fitness RFC at t=100 for changing initial strain proportions. (d) In‐silico non‐producer proportion (% C+Cs) at t=100 for changing initial strain proportions. (e) CFU/mL representing the total population of WT‐GFP (NRS1473) and Δ8‐BFP (NRS3656) coculture in glutamic acid and glycerol (GA + Gly) (blue) and BSA and glycerol (BSA + Gly) (green) for different initial ratio of WT:Δ8 inoculum ranging from 0:100 to 100:0. Each point represents the total CFU/mL (n = 3) and the lines represent the median. (f) Relative fitness advantage of Δ8‐BFP (NRS3656) population compared to initial Δ8‐BFP (NRS3656) population from WT‐GFP (NRS1473) and Δ8‐BFP (NRS3656) coculture in glutamic acid and glycerol (GA + Gly) (blue) and BSA and glycerol (BSA + Gly) (green) for different initial ratio of WT:Δ8 inoculum ranging from 0:100 to 100:0. Each point represents the calculated relative fitness (n = 3), and the lines represent the median. (g) Final proportion of Δ8‐BFP (NRS3656) population compared to initial Δ8‐BFP (NRS3656) population from WT‐GFP (NRS1473) and Δ8‐BFP (NRS3656) coculture in glutamic acid and glycerol (GA + Gly) (blue) and BSA and glycerol (BSA + Gly) (green) for different initial ratio of WT: Δ8 inoculum ranging from 0:100 to 100:0. Each point represents the total CFU/mL (n = 3), and the lines represent the median. BSA, bovine serum albumin.
FIGURE 7
FIGURE 7
Relative cost of extracellular protease production explains the public good dilemma. (a) Growth of NCIB 3610 in planktonic culture at 12 h for glutamic acid 0.5% (w/v) and 0.5% glycerol (v/v) (Ga + Gly) and 48 h for 1% BSA (w/v) and 0.5% glycerol (v/v) (BSA + Gly). Points represent OD600 values (n = 3 biological replicates with two technical replicates), lines represent median. (b) Extracellular protease activity in the supernatant of culture from (a) normalised to the total yield represented in (a). Points represent fluorescence intensity/OD600 (n = 3 biological replicates with two technical replicates), and lines represent the median. (c) Relative cost of extracellular protease production against the initial fraction of Δ8 in growth media representing glutamic acid and BSA as the nitrogen sources. (d) In‐silico proportion of the non‐producer at t=100 against the in‐silico relative cost of extracellular protease production during growth in a medium containing BSA as the sole source of nitrogen. Note that both axes represent model outputs. Data points correspond are generated by varying the value of χ (0χ2). Red dots represent χs=1, the parameter value used in other simulations (see Table 2).

References

    1. Arkhipova, T.N. , Veselov, S.U. , Melentiev, A.I. , Martynenko, E.V. & Kudoyarova, G.R. (2005) Ability of bacterium Bacillus subtilis to produce cytokinins and to influence the growth and endogenous hormone content of lettuce plants. Plant and Soil, 272, 201–209.
    1. Bankevich, A. , Nurk, S. , Antipov, D. , Gurevich, A.A. , Dvorkin, M. , Kulikov, A.S. et al. (2012) SPAdes: a new genome assembly algorithm and its applications to single‐cell sequencing. Journal of Computational Biology, 19, 455–477. - PMC - PubMed
    1. Blake, C. , Christensen, M.N. & Kovacs, A.T. (2021) Molecular aspects of plant growth promotion and protection by Bacillus subtilis . Molecular Plant‐Microbe Interactions, 34, 15–25. - PubMed
    1. Bolger, A.M. , Lohse, M. & Usadel, B. (2014) Trimmomatic: a flexible trimmer for Illumina sequence data. Bioinformatics, 30, 2114–2120. - PMC - PubMed
    1. Branda, S.S. , Gonzalez‐Pastor, J.E. , Ben‐Yehuda, S. , Losick, R. & Kolter, R. (2001) Fruiting body formation by Bacillus subtilis . Proceedings of the National Academy of Sciences of the United States of America, 98, 11621–11626. - PMC - PubMed

Publication types

LinkOut - more resources