. 2023 Jun 29;14(1):3840.
doi: 10.1038/s41467-023-39288-6.

Using mortuary and burial data to place COVID-19 in Lusaka, Zambia within a global context

Affiliations

Using mortuary and burial data to place COVID-19 in Lusaka, Zambia within a global context

Richard J Sheppard et al. Nat Commun. .

Erratum in

Abstract

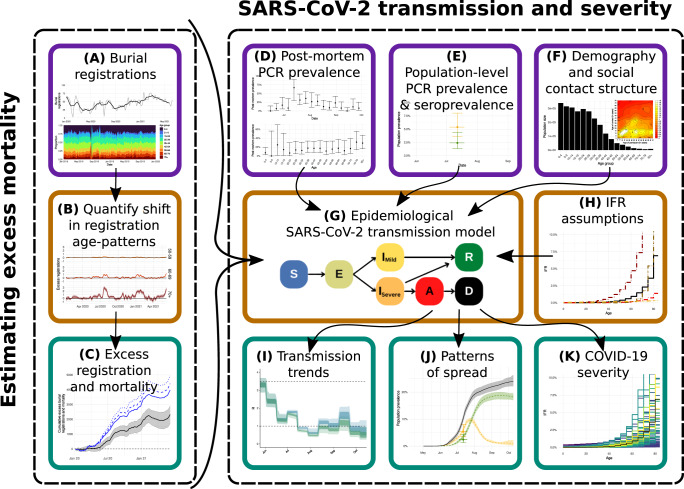
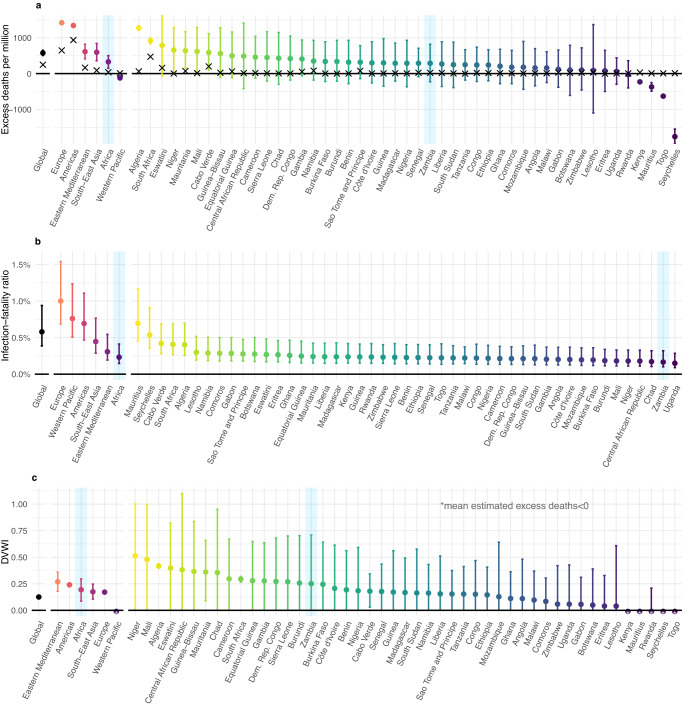
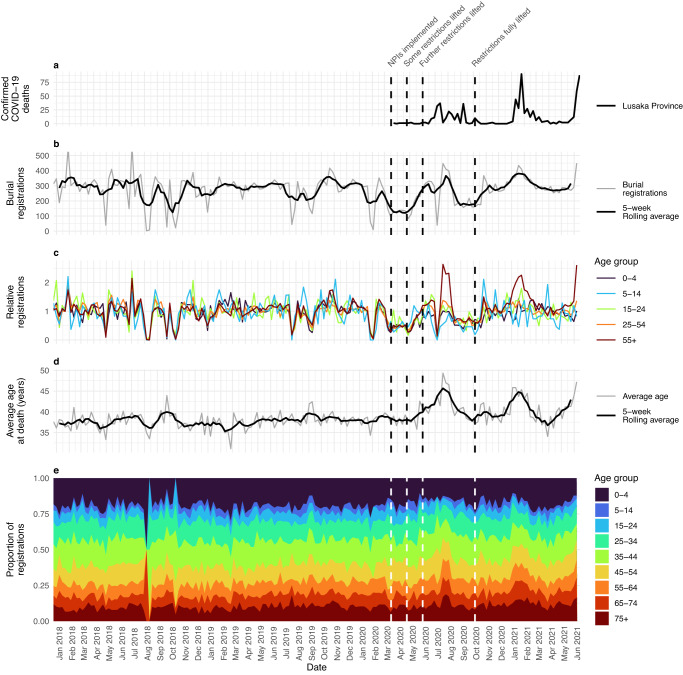
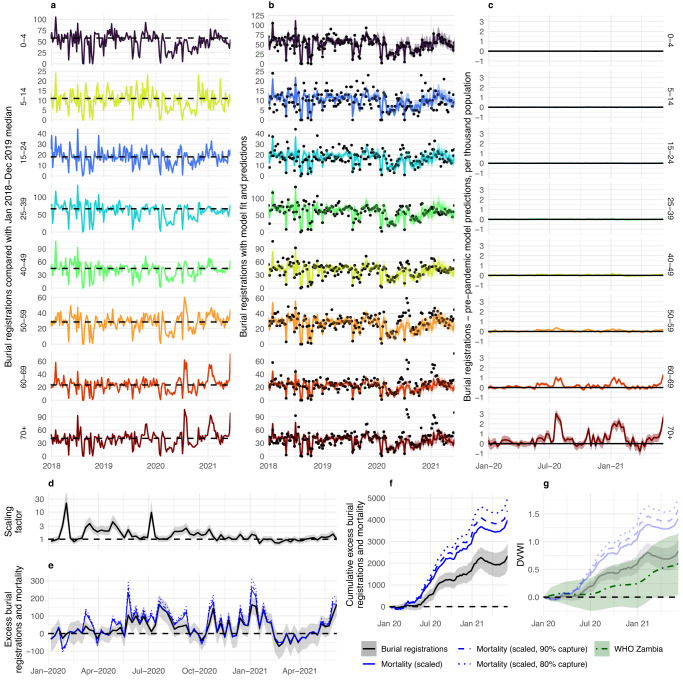
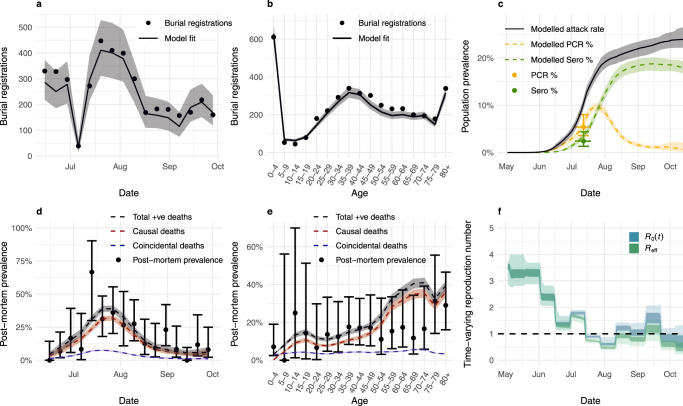
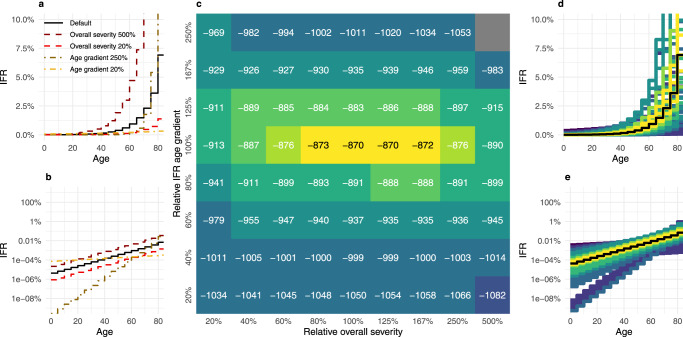
Reported COVID-19 cases and associated mortality remain low in many sub-Saharan countries relative to global averages, but true impact is difficult to estimate given limitations around surveillance and mortality registration. In Lusaka, Zambia, burial registration and SARS-CoV-2 prevalence data during 2020 allow estimation of excess mortality and transmission. Relative to pre-pandemic patterns, we estimate age-dependent mortality increases, totalling 3212 excess deaths (95% CrI: 2104-4591), representing an 18.5% (95% CrI: 13.0-25.2%) increase relative to pre-pandemic levels. Using a dynamical model-based inferential framework, we find that these mortality patterns and SARS-CoV-2 prevalence data are in agreement with established COVID-19 severity estimates. Our results support hypotheses that COVID-19 impact in Lusaka during 2020 was consistent with COVID-19 epidemics elsewhere, without requiring exceptional explanations for low reported figures. For more equitable decision-making during future pandemics, barriers to ascertaining attributable mortality in low-income settings must be addressed and factored into discourse around reported impact differences.


Conflict of interest statement

S.G. declares shareholdings in pharmaceutical companies (AstraZeneca and GlaxoSmithklineBeecham). L.C.O. declares grant funding for other projects from Merck Ltd. The remaining authors declare no competing interests.

Figures

Fig. 1
Fig. 1. Inferential Framework.
Data sources and other inputs are denoted by purple boxes, methodological steps are shown in orange boxes, while results and other outputs are shown in teal boxes. A Age-stratified burial registration data are used to B quantify the shift in registration age-patterns throughout the pandemic, relative to those observed in 2018–2019. These are then converted into C excess mortality estimates during 2020 until June 2021, making several assumptions (subjected to various sensitivity analyses), in particular that registration rate changes in children (mirrored by similar patterns in adolescents and young adults) during the pandemic are a guide to underlying registration and mortality patterns. These estimates are combined with: D weekly post-mortem polymerase chain reaction (PCR) prevalence data from the largest mortuary in Lusaka during June-October 2020; E population-based PCR prevalence and seroprevalence survey data from July 2020; F demography information and likely social-contact structure within Lusaka. These inputs are then used to G fit an age-structured SARS-CoV-2 transmission model using Markov chain Monte Carlo for H a given infection-fatality ratio (IFR) pattern by age to I infer transmission trends over time, J extrapolate patterns of spread throughout the first pandemic wave in Lusaka and K obtain the posterior likelihood of observing the patterns in B, D, and E conditional on the assumed IFR pattern by age.
Fig. 2
Fig. 2. Global estimates of excess mortality relative to patterns of demographic vulnerability.
Figure shows a World Health Organisation (WHO) estimates of excess mortality per million people in 2020. Points show mean and lines 95% confidence intervals from 1000 samples. Crosses show confirmed COVID-19 mortality per million people in 2020. b Estimates of region-level IFR calculated using age-specific IFR estimates from Brazeau et al. weighted by region population age-distribution (i.e., assuming infection equally distributed across the population). Points show median IFR and lines 95% credible intervals from 1000 draws of the joint posterior of the IFR by age curve. c Estimated demographic-vulnerability-weighted impact (DVWI), defined as the cumulative attack rate, spread uniformly by age, required to achieve a level of direct COVID-19 mortality matching the excess mortality in a assuming the posterior median IFR from b. Points and lines show median with 95% confidence intervals corresponding with 1000 draws from excess mortality estimates in a. All panels highlight in blue estimates for the WHO Africa region and Zambia for ease of identification.
Fig. 3
Fig. 3. Burial registrations and COVID-19 mortality patterns.
a Confirmed COVID-19 deaths in Lusaka Province, b total weekly burial registrations in Lusaka with a 5-week rolling average of the two preceding, current and two succeeding weeks, c age-grouped registrations relative to 2018–2019 mean, d weekly average age at death of burial registrations with similar 5-week rolling average, e age-grouped proportion of deaths in burial registrations. Dates of key non-pharmaceutical intervention (NPI) changes are also given (vertical dashed lines, 17th March 2020: initial COVID-19 press briefing and NPIs, 24th April 2020: initial relaxation of some NPIs, 6th June 2020: opening of primary and secondary schools for examination students only, 10th October 2020: business restrictions fully lifted, COVID guidance continues, e.g., mask wearing, good hygiene etc,).
Fig. 4
Fig. 4. Excess mortality in Lusaka.
Figure shows a burial registrations grouped by age with 2018–2019 median shown throughout (dotted line), b burial registrations (points) with model fit (line and ribbon) combining age-distribution of deaths with the number of registrations aged <5 fitted to 2018–2019 burial registrations and predictions of expected registration in 2020–2021, c excess burial registrations per thousand people based on the difference between total burial registrations and 2020-21 model predictions, d scaling factor based on burial registrations aged <5 relative to their pre-pandemic median, e application of scaling factor to excess burial registration of population aged 5+ (black) to estimate median excess mortality (blue) and with additional assumption of 90% and 80% registration capture of underlying mortality (blue, dashed and dotted lines), f cumulative estimates of excess burial registrations (black), median cumulative mortality assuming weekly scaling (blue), and median cumulative mortality assuming 90% and 80% registration capture of underlying mortality (blue, dashed and dotted), g demographic-vulnerability- weighted index (DVWI, the cumulative attack rate required to achieve excess burial registrations (black), or mortality assuming scaling (blue) with 100%, 90%, and 80% registration capture of underlying mortality registration (solid, dashed and dotted) in e, f or in World Health Organisation (WHO) excess mortality estimates for Zambia, assuming the overall IFR for Lusakan and Zambian population structures, respectively, and direct COVID-19 causation. In all model plots, lines and ribbons show the median and 95% credible interval. Registrations, mortality and DVWI are grouped by week in all panels.
Fig. 5
Fig. 5. SARS-CoV-2 transmission in June–October 2020.
Transmission model fit to burial registrations by a week and b 5-year age group during 15th June–4th October 2020, c Lusaka population-level polymerase chain reaction (PCR) prevalence and seroprevalence (sero) surveys, and post-mortem PCR prevalence at UTH with 95% binomial confidence intervals by d week and e 5-year age group during 15th June–4th October 2020, showing total positive (+ve) deaths, delineated by causal and non-causal COVID-19 deaths. Lines and ribbons in panels (ae) show median and 95% credible intervals of 100 samples. Transmissibility through time is given in f with the time-varying reproduction number R0(t), and effective reproduction number Reff as a comparable measure incorporating the impact of population immunity (shown at 50% and 95% credible intervals of 100 samples) such that a value greater than one indicates a growing epidemic.
Fig. 6
Fig. 6. Inference of age-gradient and scale of severity.
a, b are infographics to show how the infection fatality ratio (IFR) curve changes when the intercept or slope is altered on a standard and b log scales. Each plot shows the default IFR from Brazeau et al. as a solid line, with relative overall severities of 20% and 500% of those default values or relative age-gradient of 20% and 250% of the slope on the log scale, maintaining the overall severity of the default. The heatmap c shows the log of the average posterior model fit over 100 samples. d, e show all assessed IFR curves, coloured by posterior fit as found in c, and where default IFR assumptions are highlighted in black, plotted on d standard and e log scales.

References

    1. Global Economic Effects of COVID-19. https://apps.dtic.mil/sti/citations/AD1152929.
    1. WHO. WHO Coronavirus (COVID-19) Dashboard | WHO Coronavirus (COVID-19) Dashboard With Vaccination Data. https://covid19.who.int/?adgroupsurvey={adgroupsurvey}&gclid=Cj0KCQiA4Oy... (2022).
    1. Okell LC, et al. Have deaths from COVID-19 in Europe plateaued due to herd immunity? Lancet. 2020;395:e110–e111. doi: 10.1016/S0140-6736(20)31357-X. - DOI - PMC - PubMed
    1. Sharma M, et al. Understanding the effectiveness of government interventions against the resurgence of COVID-19 in Europe. Nat. Commun. 2021;12:1–13. doi: 10.1038/s41467-021-26013-4. - DOI - PMC - PubMed
    1. Voysey M, et al. Safety and efficacy of the ChAdOx1 nCoV-19 vaccine (AZD1222) against SARS-CoV-2: an interim analysis of four randomised controlled trials in Brazil, South Africa, and the UK. Lancet. 2021;397:99–111. doi: 10.1016/S0140-6736(20)32661-1. - DOI - PMC - PubMed

Publication types