. 2023 Jun 28;14(1):3823.
doi: 10.1038/s41467-023-38921-8.

Increased glucose availability sensitizes pancreatic cancer to chemotherapy

Affiliations

Increased glucose availability sensitizes pancreatic cancer to chemotherapy

Ali Vaziri-Gohar et al. Nat Commun. .

Abstract

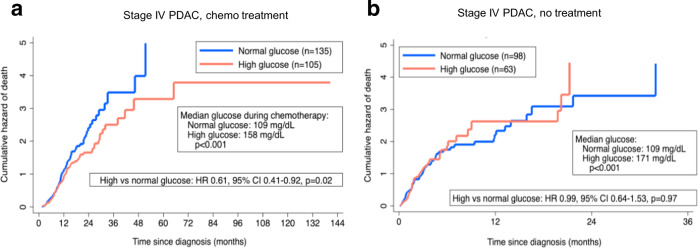
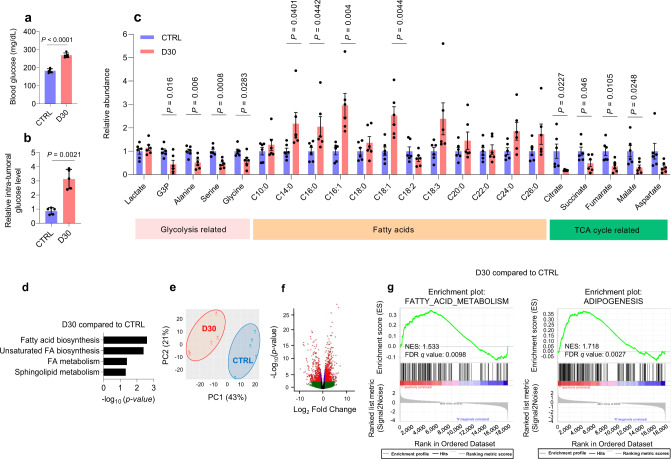
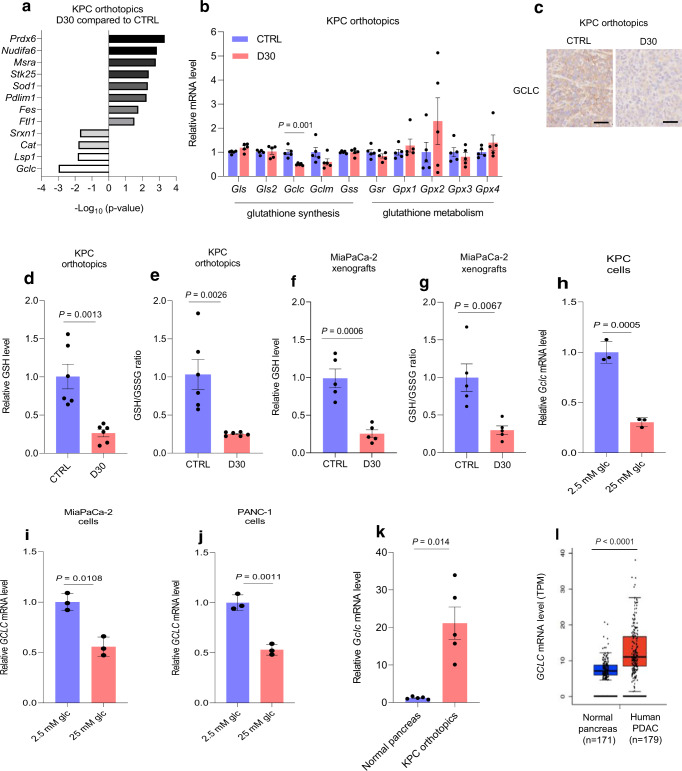
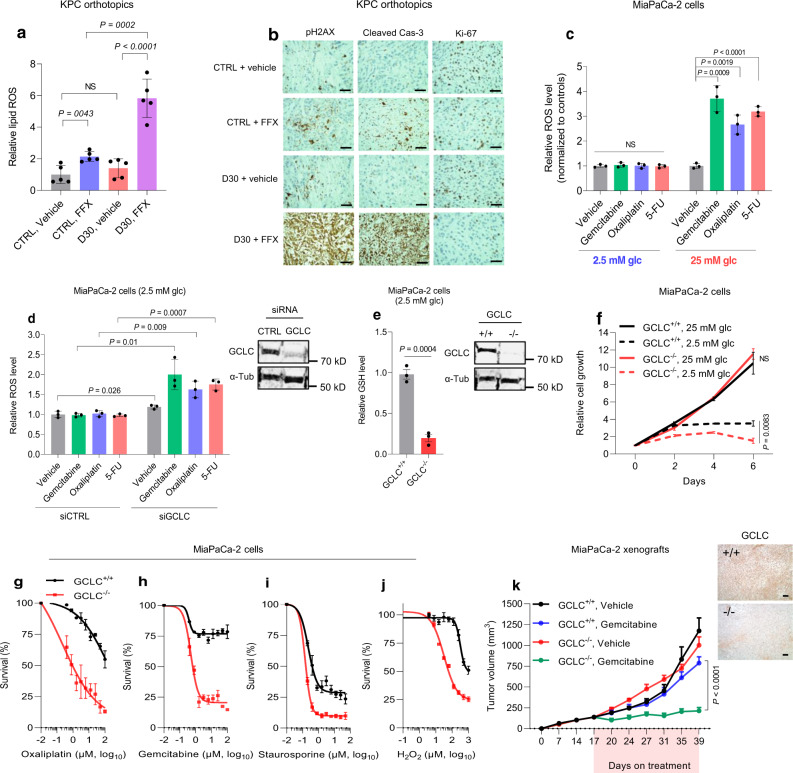
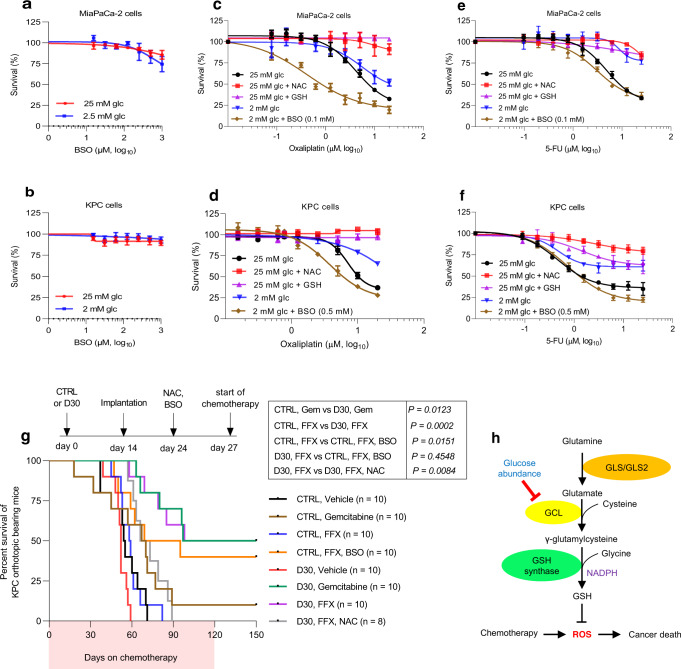
Pancreatic Ductal Adenocarcinoma (PDAC) is highly resistant to chemotherapy. Effective alternative therapies have yet to emerge, as chemotherapy remains the best available systemic treatment. However, the discovery of safe and available adjuncts to enhance chemotherapeutic efficacy can still improve survival outcomes. We show that a hyperglycemic state substantially enhances the efficacy of conventional single- and multi-agent chemotherapy regimens against PDAC. Molecular analyses of tumors exposed to high glucose levels reveal that the expression of GCLC (glutamate-cysteine ligase catalytic subunit), a key component of glutathione biosynthesis, is diminished, which in turn augments oxidative anti-tumor damage by chemotherapy. Inhibition of GCLC phenocopies the suppressive effect of forced hyperglycemia in mouse models of PDAC, while rescuing this pathway mitigates anti-tumor effects observed with chemotherapy and high glucose.


Conflict of interest statement

J.M.S. is a co-author on patents of IDH1 inhibitors, and has received sponsored research funding from the Barer Institute and patents pending to Wistar Institute. C.A.L. has received consulting fees from Astellas Pharmaceuticals and Odyssey Therapeutics, and is an inventor on patents pertaining to Kras regulated metabolic pathways, redox control pathways in cancer, and targeting the GOT1-pathway as a therapeutic approach. J.M.W. along with University Hospitals filed the following patent application on September 24, 2020: Methods for Treating Wild Type Isocitrate Dehydrogenase 1 Cancers. Information regarding this patent application is as follows: PCT/US20/52445 filed 09/24/20, Claiming Priority to US 62/911,717 filed 10/7/19, File Nos: UHOSP-19738 | 2019-014.

Figures

Fig. 1
Fig. 1. Enhanced chemotherapy response with hyperglycemia in patients with stage IV PDAC.
Nelson-Aalen cumulative hazard curves of patients with metastatic PDAC, stratified by glycemic status among patients who received ≥ 2 cycles of chemotherapy (a) and those who did not receive any treatment (b). Patients’ data are provided in the Source Data file.
Fig. 2
Fig. 2. High-glucose diet in mice improves conventional chemotherapy response.
a, b, Peripheral glucose levels (a) and body weights (b) of nude mice receiving normal or D30 water. Each dot represents the mean of weekly measurements of blood glucose per group (n = 5 mice per group). c, Xenograft growth of MiaPaCa-2 cells treated with gemcitabine (n = 5 mice per group, 75 mg/kg twice weekly, i.p.). d, Patient-derived xenograft (TM01212) treated with FOLFIRINOX (n = 5 mice per group, oxaliplatin 5 mg/kg, 5-FU 25 mg/kg, and irinotecan 50 mg/kg, once weekly, i.p.). Data are provided as mean ± s.e.m. Longitudinal mixed models were fit for tumor size growth, and time by treatment interactions were assessed (c, d). Source data are provided as a Source Data file.
Fig. 3
Fig. 3. Hyperglycemia enhances fatty acid accumulation in pancreatic tumors.
a, Peripheral glucose levels in C57BL/6 J mice receiving D30 water or normal water (n = 5 mice per group). b–d, Relative abundance of glucose (b, n = 5 mice per group), other metabolites (c, n = 6 orthotopic tumors per group), and enriched pathways derived from metabolomic analyses (d, n = 6 orthotopic tumors per group) in murine KPC orthotopic tumors after D30 water consumption, as compared to tumors in normoglycemic mice consuming regular water for 14 days. eg, Principal component analysis (e) and volcano plot (f) derived from transcriptomic analyses, and GSEA of genes associated with fatty acid synthesis (g) in KPC orthotopic tumors under the indicated conditions (n = 5 orthotopic tumors per group). FDR-adjusted p value (q values) are provided. Data are provided as mean ± s.d. (a, b) or mean ± s.e.m. (c). Pairwise comparisons were conducted using two-tailed, unpaired Student’s t-tests. Source data are provided as a Source Data file.
Fig. 4
Fig. 4. Reduced GCLC expression and de novo glutathione synthesis in pancreatic cancer exposed to a relative high glucose state.
a, b Significantly altered genes associated with redox metabolism (a) and qPCR analysis of glutathione metabolism-associated enzymes (b) in KPC orthotopic tumors under the indicated conditions (n = 5 orthotopic tumors per group). c, Immunolabeling of GCLC in independent KPC orthotopic tumors receiving D30 water versus control (representative immunoblots of three tumors with similar results are shown). Scale bars, 50 µm. d–g Relative GSH levels (d, n = 6 tumors per group; f, n = 5 tumors per group) and GSH/GSSG ratio (e, n = 6 tumors per group; g, n = 5 tumors per group) in indicated tumors. qPCR analysis in PDAC cells under the indicated conditions for 48 hours (h–j) (n = 3 independent experiments). k qPCR analysis of GCLC transcripts in murine orthotopic pancreatic tumors compared to normal pancreas (n = 5 per group). l, Box plot showing GCLC transcripts (TPM: transcripts per million) in human pancreatic tumors versus normal pancreas. For this gitter box plot, the center line indicates the median, box limits represent the upper and lower quartiles, and whiskers indicate the 1.5x interquartile range. These data were taken from TCGA and GTEx databases for tumor and normal pancreas, respectively, and were analyzed using GEPIA. The number of cases is indicated (P = 3.68e−13). Data are provided as mean ± s.d. (h–j) or mean ± s.e.m (b, d–g, k). Pairwise comparisons were conducted using two-tailed, unpaired Student’s t-tests. Source data are provided as a Source Data file.
Fig. 5
Fig. 5. Downregulation of GCLC enhances the efficacy of ROS inducers in PDAC cells.
a, b Relative lipid ROS levels (a) and pH2AX (Ser139), cleaved caspase-3, and Ki-67 immunolabeling (b) of KPC orthotopic tumors under indicated treatments for 14 days (n = 5 orthotopic tumors per group). Scale bars, 50 µm. c, d Relative ROS levels in parental MiaPaCa-2 cells cultured in low (2.5 mM) or high (25 mM) glucose for 30 hours (c) and in MiaPaCa-2 cells transiently transfected with siRNAs (control non-targeting or against GCLC) cultured in low glucose conditions (d), followed by chemotherapy administration (gemcitabine (100 nM), oxaliplatin (1 µM), 5-FU (1 µM)) for an additional 16-18 hours (n = 3 independent experiments). e, Immunoblot of GCLC in GCLC+/+ and GCLC–/– MiaPaCa-2 PDAC cells and relative GSH levels under low glucose conditions (n = 3 independent experiments). f, Relative clonogenic growth of GCLC+/+ and GCLC–/– MiaPaCa-2 cells under indicated conditions and time intervals (n = 3 independent experiments). g–j Relative survival of GCLC+/+ and GCLC–/– cells treated with the indicated chemotherapeutic agents under low glucose conditions for five days (g, h) or alternative ROS-inducers under low serum conditions (2%) for four days (i, j) (n = 3 independent experiments). For these experiments, cells were cultured in media containing 2.5 mM glucose for 30 h prior treatment with indicated compounds. k The growth rates of GCLC+/+ and GCLC–/– MiaPaCa-2 xenografts with the indicated treatments (n = 5 mice per group). Immunolabeling of GCLC in tumors receiving vehicle are shown. Scale bars, 50 µm. Data are provided as mean ± s.d. (c–j) or mean ± s.e.m. (a, k). Pairwise comparisons were conducted using two-tailed, unpaired Student’s t-tests. Longitudinal mixed models were fit for tumor size growth, and time by treatment interactions were assessed (k, P = 2.28E−09). Source data are provided as a Source Data file.
Fig. 6
Fig. 6. Glutathione biosynthesis affects chemotherapy response.
a–f Relative survival of MiaPaCa-2 cells (a, c, e) and KPC cells (b, d, f) at the indicated conditions for five days. For experiments under low glucose conditions, cells were cultured in reduced glucose media for 30 hours prior to chemotherapy treatment. GSH (reduced glutathione, 4 mM), NAC (N-acetylcysteine, 1.5 mM), or BSO (L-Buthionine sulfoximine, at indicated concentration) was co-administered with chemotherapy (n = 3 independent experiments). g Survival of C57BL/6 J mice bearing KPC orthotopic tumors with the indicated treatments. The number of mice per group is indicated. h Depiction of the de novo glutathione synthesis pathway and the effects of glucose limitation and chemotherapy on cancer death. Survival distributions were estimated using Kaplan-Meier estimation and compared by log-rank tests (g). Data are provided as mean ± s.d. (a–f). Source data are provided as a Source Data file.

References

    1. Morgan R, Ward R, Barton M. The contribution of cytotoxic chemotherapy to 5-year survival in adult malignancies. Clin. Oncol. (R. Coll. Radio.) 2004;16:549–560. doi: 10.1016/j.clon.2004.06.007. - DOI - PubMed
    1. Kou et al. (Cancer Epidemiology Biomarkers & Prevention, 2020).
    1. Conroy T, et al. FOLFIRINOX versus gemcitabine for metastatic pancreatic cancer. N. Engl. J. Med. 2011;364:1817–1825. doi: 10.1056/NEJMoa1011923. - DOI - PubMed
    1. Von Hoff, et al. Increased survival in pancreatic cancer with nab-paclitaxel plus gemcitabine. N. Engl. J. Med. 2013;369:1691–1703. doi: 10.1056/NEJMoa1304369. - DOI - PMC - PubMed
    1. Siegel RL, Miller KD, Wagle NS, Jemal A. Cancer statistics, 2023. CA Cancer J. Clin. 2023;73(Jan):17–48. doi: 10.3322/caac.21763. - DOI - PubMed

Publication types