. 2023 Jun 28;14(1):3837.
doi: 10.1038/s41467-023-39573-4.

Plant traits poorly predict winner and loser shrub species in a warming tundra biome

Affiliations

Plant traits poorly predict winner and loser shrub species in a warming tundra biome

Mariana García Criado et al. Nat Commun. .

Abstract

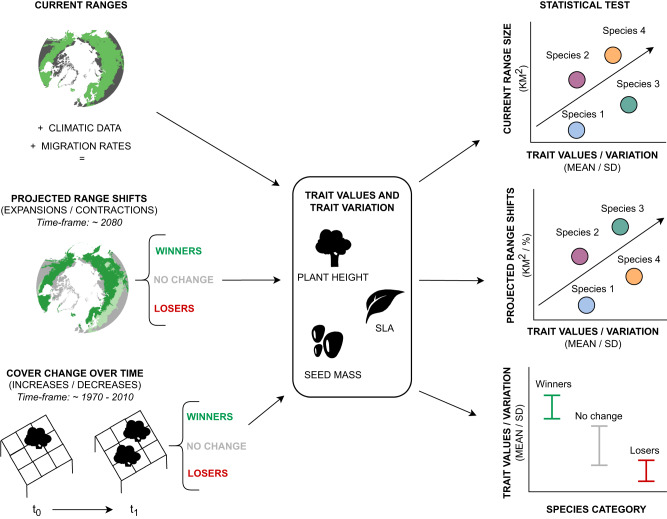
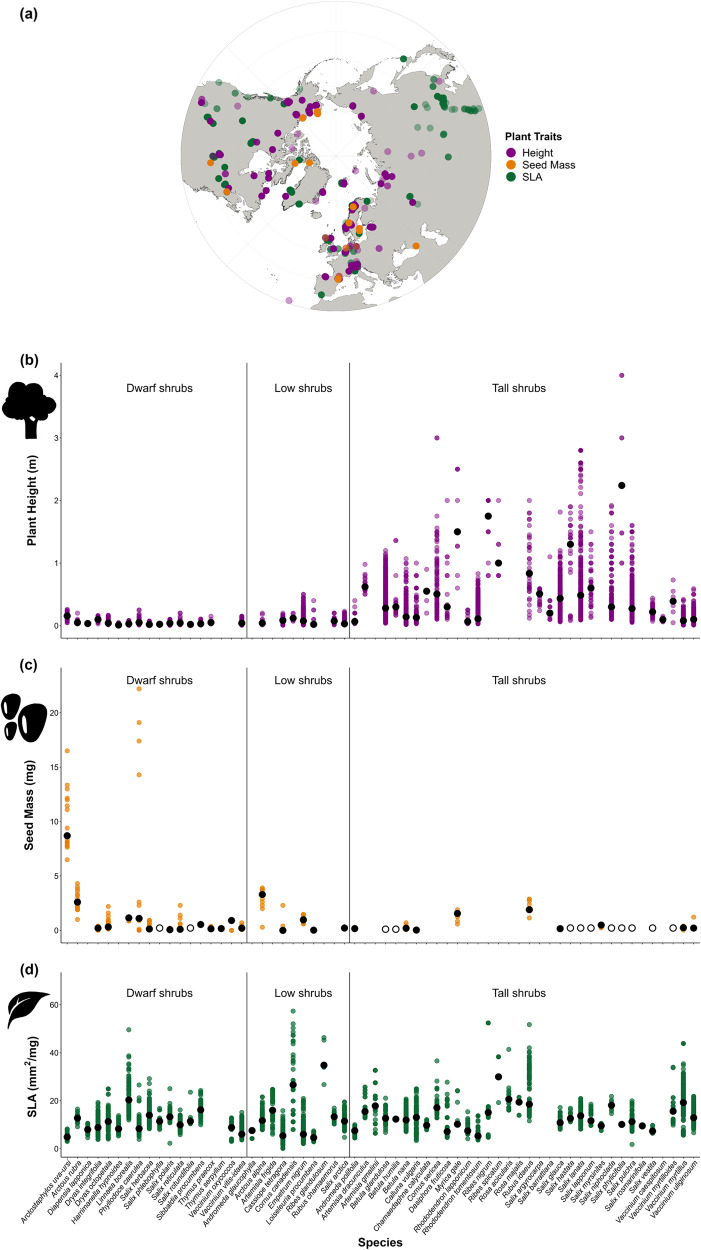
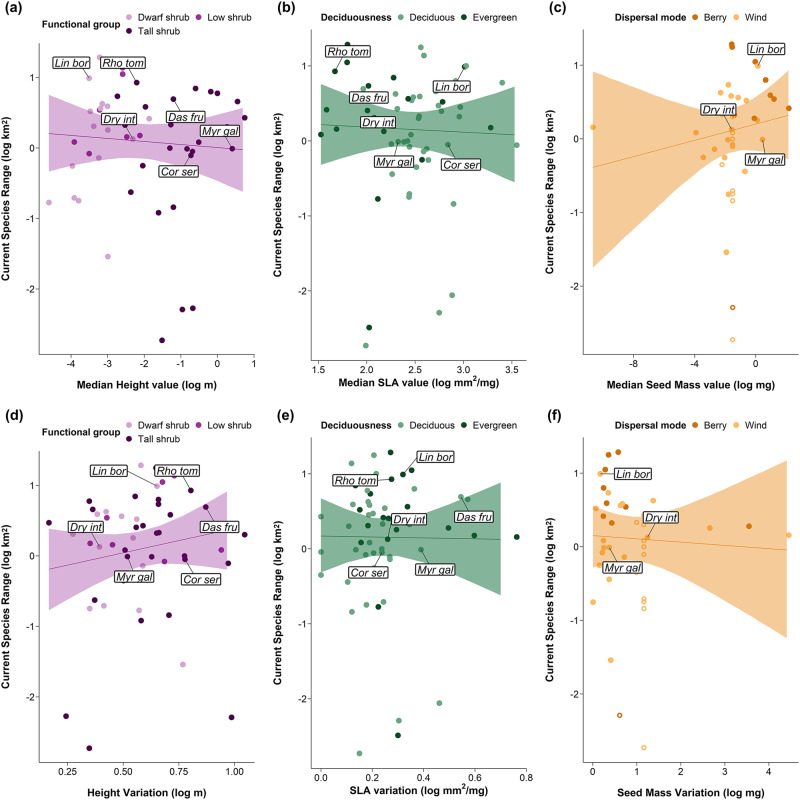
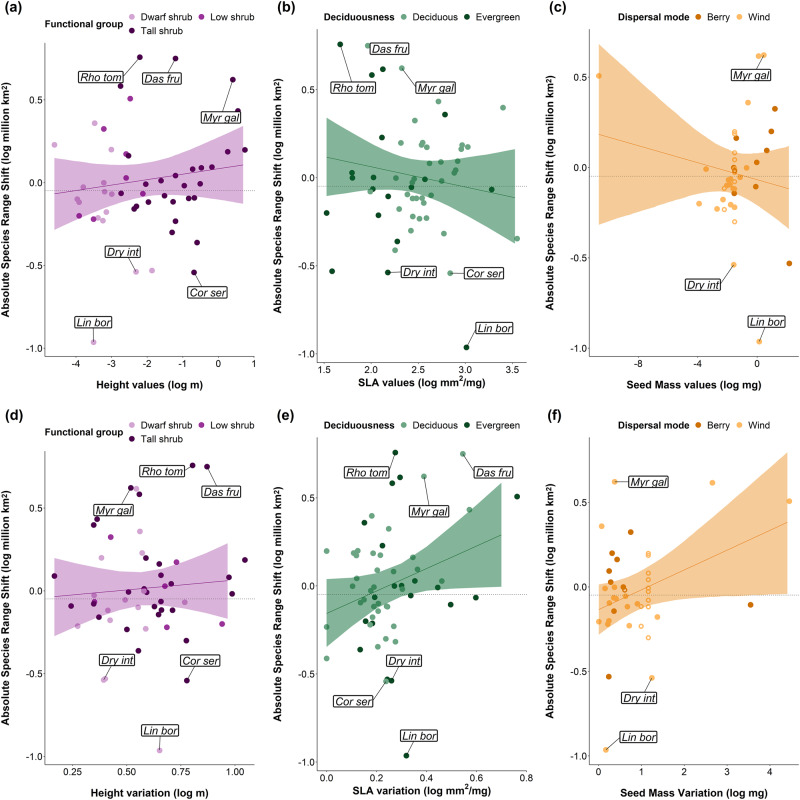
Climate change is leading to species redistributions. In the tundra biome, shrubs are generally expanding, but not all tundra shrub species will benefit from warming. Winner and loser species, and the characteristics that may determine success or failure, have not yet been fully identified. Here, we investigate whether past abundance changes, current range sizes and projected range shifts derived from species distribution models are related to plant trait values and intraspecific trait variation. We combined 17,921 trait records with observed past and modelled future distributions from 62 tundra shrub species across three continents. We found that species with greater variation in seed mass and specific leaf area had larger projected range shifts, and projected winner species had greater seed mass values. However, trait values and variation were not consistently related to current and projected ranges, nor to past abundance change. Overall, our findings indicate that abundance change and range shifts will not lead to directional modifications in shrub trait composition, since winner and loser species share relatively similar trait spaces.


Conflict of interest statement

The authors declare no competing interests.

Figures

Fig. 1
Fig. 1. Conceptual diagram of the different types of data used in this study and their relationships.
In the current range map, green represents the current distribution of a species. In the projected range shifts map, different green shades in the map represent the difference between current and projected ranges. In the cover change over time drawing, the point-framing grid represents cover change over time. Categories of winner, no change or loser species were identified following two different methods: based on future projections of range shifts (future winner/losers), and based on past cover change over time (past winner/losers). Current range sizes were modelled with trait values and variation, and projected range shifts (which could be range expansions or contractions) were modelled as a function of trait values and variation. Cover change over time species categories were modelled with trait values and variation. SD means standard deviation. The polar basemaps were geo-referenced and digitized from AMAP (1998). The shrub, leaf and seed icons were commissioned for this article and designed by Alberto S. Ballesteros, who grants permission for their display here.
Fig. 2
Fig. 2. We compiled trait data from shrubs across three continents to test whether trait values and variation were related to range size, projected range shifts and cover change.
Trait records with no coordinate information are not represented in the map. a Location of the geo-referenced trait records in this database, north of 30 degrees latitude. Map with polar projection created with the ‘ggOceanMapsData’ package, which are made with Natural Earth. b Plant Height values (in m) for 52 species. c Seed mass values (in mg) for 40 species. d SLA values (in mm2/mg) for 57 species. Each coloured point represents an individual trait value recorded for that specific species. Coloured points are semi-transparent, with darker colour tones indicating overlaps of multiple points. Black points indicate the median value per species. Open black circles indicate the median values of seed mass for gap-filled species. Species are organised alphabetically within functional groups. The shrub, leaf and seed icons were commissioned for this article and designed by Alberto S. Ballesteros, who grants permission for their display here.
Fig. 3
Fig. 3. There were no clear relationships between mean trait values (MTV) or intraspecific trait variation (ITV) and current range sizes of tundra shrubs.
Model outputs of the weighted linear regressions of current species range size as a function of a height values b SLA values, c seed mass values, d height variation, e SLA variation and f seed mass variation. MTV are the median per species and ITV is the SD of trait records. Points are coloured according to categorical traits related to each continuous trait. Lines are the predicted model slopes and the semi-transparent ribbons represent the 95% model credible intervals. Open circles in c and f represent the gap-filled seed mass points calculated from genus medians. Labels represent abbreviated species names from the top three future winners (Rhododendron tomentosum [previously Ledum palustre], Dasiphora fruticosa and Myrica gale) and the bottom three future losers (Linnaea borealis, Cornus sericea and Dryas integrifolia).
Fig. 4
Fig. 4. There were similar numbers of future winner and loser species on the basis of their predicted absolute and relative species range change.
The panel shows projections of a absolute and b relative range change of tundra shrubs. Each point represents the median across the 24 predicted climatic scenarios per species, while the error bars represent the 25 and 75% quantiles of range change. Species are ordered across the horizontal axis in descending absolute change median value and coloured according to their functional group. Species whose lower quantile does not overlap zero are considered winners with expanding ranges, those whose either quantile overlaps zero are considered to experience no change (also indicated by the vertical grey polygons), and those whose upper quantile does not overlap zero are considered losers with contracting ranges. The horizontal black line represents zero range shift.
Fig. 5
Fig. 5. There were no clear relationships between mean trait values (MTV) or intraspecific trait variation (ITV) and median projected range shifts of tundra shrubs, except for seed mass variation.
Model outputs of the weighted linear regressions of median absolute species range change as a function of a height values b SLA values, c seed mass values, d height variation, e SLA variation, and f seed mass variation. MTV represent the median per species and ITV is calculated as SD. Points are coloured according to categorical traits related to each continuous trait. Coloured lines are the predicted model slopes and the semi-transparent ribbons represent the 95% model credible intervals. Open circles in c and f represent the gap-filled seed mass values. Labels represent abbreviated species names as the top three future winners (Rhododendron tomentosum, Dasiphora fruticosa, and Myrica gale) and the bottom three future losers (Linnaea borealis, Cornus sericea, and Dryas integrifolia). Horizontal dotted lines indicate the zero range shift after scaling the data. Species above this line are winners and species below this line are losers.
Fig. 6
Fig. 6. Future winners had slightly different trait values from loser and no change species for tundra shrubs.
Principal Component Analysis for a mean trait values (MTV) and b intraspecific trait variation (ITV; n = 36). Ellipses and points are coloured according to species categories. Arrows indicate the direction and weighting of each trait. Ellipses indicate the 68% confidence interval of distributions per category. c, d Effect sizes of the binomial models with category (future winners versus losers and no change) as a function of c MTV and d ITV (both n = 36). Mid-points represent mean posterior estimates and vertical error bars represent the 95% credible intervals of the slope estimates. Asterisks indicate relationships between categories and traits that did not overlap zero (represented by the horizontal dotted line).

References

    1. Rantanen M, et al. The Arctic has warmed nearly four times faster than the globe since 1979. Commun. Earth Environ. 2022;3:1–10. doi: 10.1038/s43247-022-00498-3. - DOI
    1. Chylek P, et al. Annual mean Arctic amplification 1970–2020: observed and simulated by CMIP6 climate models. Geophys. Res. Lett. 2022;49:e2022GL099371. doi: 10.1029/2022GL099371. - DOI
    1. García Criado M, Myers‐Smith IH, Bjorkman AD, Lehmann CER, Stevens N. Woody plant encroachment intensifies under climate change across tundra and savanna biomes. Glob. Ecol. Biogeogr. 2020;29:925–943. doi: 10.1111/geb.13072. - DOI
    1. Martin AC, Jeffers ES, Petrokofsky G, Myers-Smith IH, Macias-Fauria M. Shrub growth and expansion in the Arctic tundra: an assessment of controlling factors using an evidence-based approach. Environ. Res. Lett. 2017;12:13. doi: 10.1088/1748-9326/aa7989. - DOI
    1. Myers-Smith IH, et al. Shrub expansion in tundra ecosystems: dynamics, impacts and research priorities. Environ. Res. Lett. 2011;6:045509. doi: 10.1088/1748-9326/6/4/045509. - DOI

Publication types