. 2023 Jun;618(7967):967-973.
doi: 10.1038/s41586-023-06119-z. Epub 2023 Jun 28.

Natural short-lived halogens exert an indirect cooling effect on climate

Affiliations

Natural short-lived halogens exert an indirect cooling effect on climate

Alfonso Saiz-Lopez et al. Nature. 2023 Jun.

Abstract

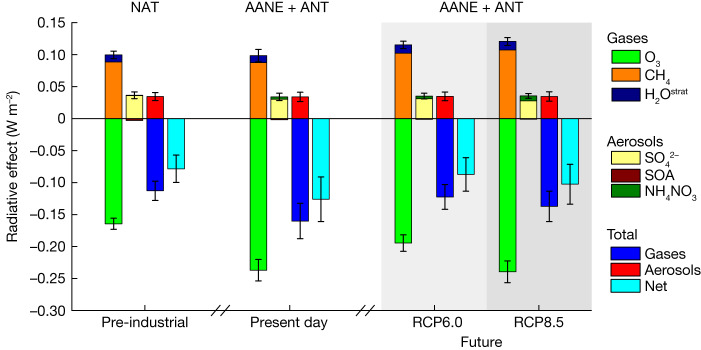
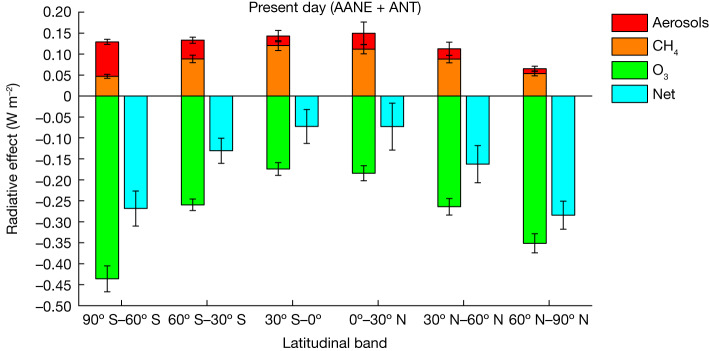
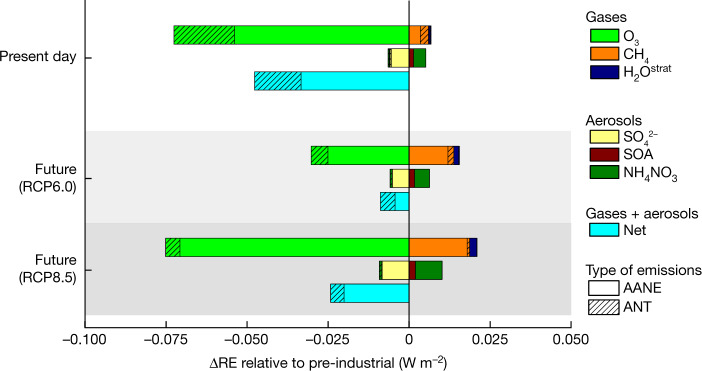
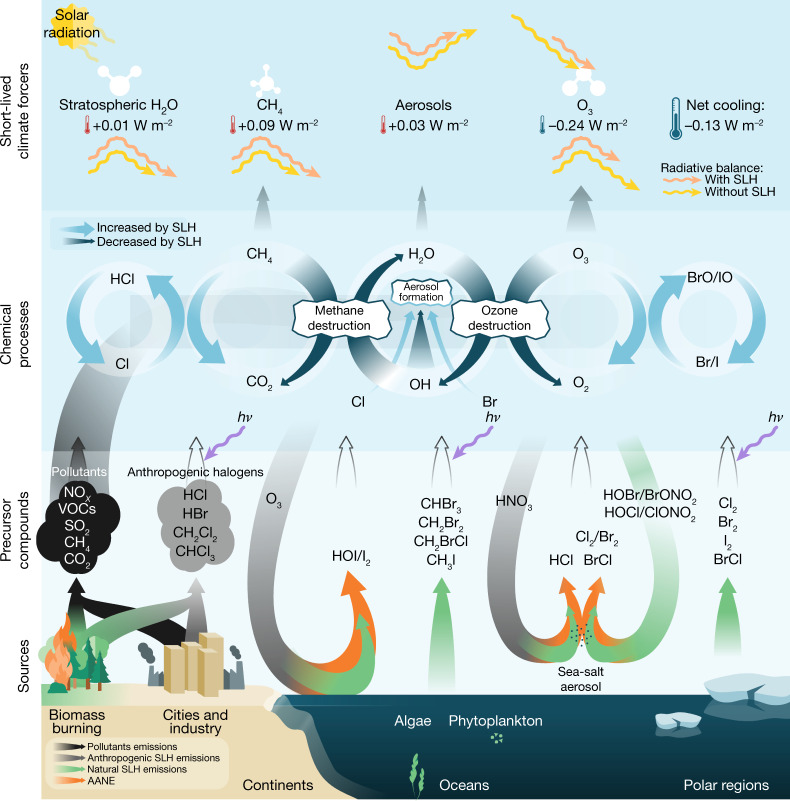
Observational evidence shows the ubiquitous presence of ocean-emitted short-lived halogens in the global atmosphere1-3. Natural emissions of these chemical compounds have been anthropogenically amplified since pre-industrial times4-6, while, in addition, anthropogenic short-lived halocarbons are currently being emitted to the atmosphere7,8. Despite their widespread distribution in the atmosphere, the combined impact of these species on Earth's radiative balance remains unknown. Here we show that short-lived halogens exert a substantial indirect cooling effect at present (-0.13 ± 0.03 watts per square metre) that arises from halogen-mediated radiative perturbations of ozone (-0.24 ± 0.02 watts per square metre), compensated by those from methane (+0.09 ± 0.01 watts per square metre), aerosols (+0.03 ± 0.01 watts per square metre) and stratospheric water vapour (+0.011 ± 0.001 watts per square metre). Importantly, this substantial cooling effect has increased since 1750 by -0.05 ± 0.03 watts per square metre (61 per cent), driven by the anthropogenic amplification of natural halogen emissions, and is projected to change further (18-31 per cent by 2100) depending on climate warming projections and socioeconomic development. We conclude that the indirect radiative effect due to short-lived halogens should now be incorporated into climate models to provide a more realistic natural baseline of Earth's climate system.


Conflict of interest statement

The authors declare no competing interests.

Figures

Fig. 1
Fig. 1. Radiative effect of SLH on gas and aerosol SLCF.
RE for all-sky conditions at the top of the model owing to natural halogens in the pre-industrial (left) together with anthropogenic plus anthropogenically amplified natural emissions (AANE + ANT) in the present day (centre). The RE owing to AANE + ANT halogens in year 2100 for RCP6.0 (light-grey shading) and RCP8.5 (dark-grey shading) climate scenarios are also shown on the right. The individual contributions from different SLCF are grouped into short-lived gases (O3, CH4 and stratospheric water vapour (H2Ostrat)) and aerosols (mainly sulfate, SOA and NH4NO3). The halogen-mediated radiative contribution from all gases (resulting in net cooling) and aerosols (producing net warming), as well as the net (gas + aerosol) is shown for each period. The uncertainty range for each species is calculated as half of the difference between the maximum and minimum RE obtained for the complete set of model sensitivities for each individual time period (mean ± range/2) as described in Supplementary Information and Extended Data Table 5. A comparison between only AANE and AANE + ANT cases for all-sky and clear-sky conditions during different time periods is shown in Extended Data Fig. 1.
Fig. 2
Fig. 2. Spatially resolved SLH-driven RE of the main SLCF.
af, The individual RE contribution arising from CH4 (a,b), O3 (c,d) and aerosols (e,f) at the top of the model are shown for the natural emission simulation during pre-industrial times (NAT; left) and the anthropogenic plus anthropogenically amplified natural emissions in the present day (AANE + ANT; right). It is noted that the CH4 RE reaches a maximum within the low latitudes resulting in net heating, whereas the O3 radiative cooling is more prominent over the high latitudes. The aerosol RE reaches a maximum over the Southern Ocean owing to the OH reduction caused by SLH, presenting spatial hotspots over industrialized regions such as Europe, North America and East Asia during the present day. The spatially resolved RE for the RCP6.0 and RCP8.5 scenarios is shown in Extended Data Fig. 2 and the radiative contribution for individual aerosol species is shown in Extended Data Fig. 4. All maps and elements were created by our research group using Matplotlib Basemap for Python.
Fig. 3
Fig. 3. Latitudinal variation of SLH-induced RE on SLCF under present-day conditions.
Despite the opposite sign of the RE induced by SLH on CH4 (positive orange bars, warming) and O3 (negative green bars, cooling), changes in CH4 RE peak at low latitudes and close to the Equator, whereas the O3 RE reaches a maximum over the high latitudes and polar regions. The SLH-mediated RE contribution from aerosols peaks over the southern high latitudes and shows the largest uncertainty over the northern mid-latitudes. Consequently, the net (gas + aerosols, cyan bars) perturbation of SLH on the radiative balance shows a pronounced latitudinal variation, where the net high-latitude RE can be up to three-times larger than within the low latitudes. The uncertainty range for each species is calculated as half of the difference between the maximum and minimum RE obtained for the complete set of present-day model sensitivities (mean ± range/2) as described in Supplementary Information (see also Extended Data Table 5).
Fig. 4
Fig. 4. Change in SLH-driven RE on SLCF with respect to pre-industrial times.
The change in radiative effect (ΔRE) for different periods of time distinguishes the contribution from pure anthropogenic halogen emissions (ANT, black-striped coloured bars) with respect to the anthropogenic amplification of natural SLH emissions (AANE, empty coloured bars). The contribution of ANT is largest during present times and, regardless of the scenario considered, the contribution of AANE increases in the future. Compared with present times, the SLH-driven ΔRE for CH4 is projected to increase (warming) by the end of the century regardless of the emissions scenario considered; whereas, for O3, the strength of the cooling effect (negative ΔRE) depends on the future RCP scenario considered. Future RCP results are based on time-slice simulations representative of the year 2100.
Fig. 5
Fig. 5. Conceptual representation of the SLH influence on atmospheric composition and radiative feedbacks within the climate system.
Halogens influence the climate system through direct changes in O3 and OH radical chemical cycling, which in turn regulate the abundance of radiatively active SLCF such as CH4, aerosols and stratospheric water vapour (H2O). The widening (thinning) of the semi-circular arrows within the chemical process layer represents an enhancement (reduction) of the efficiency of the direct SLH-driven (light blue) and indirect OH-driven (dark blue) chemical recycling of CH4, H2O and O3. The green, grey and black upwards arrows within the precursor’s layer are the direct emissions of natural SLH, anthropogenic SLH and anthropogenic air pollutants, respectively. The U-shaped arrows show natural atmospheric cycling processes of halogenated (greenish tail) and anthropogenic (greyish tail) chemical reservoirs, respectively, both of which have been anthropogenically amplified (orange head) and altered the baseline state of the climate system. The length variation of the curly yellow and pink arrows on the uppermost SLCF layer represents the effect induced by SLH on Earth’s radiative balance. The individual warming and cooling effect of each individual SLCF, as well as the net SLH-driven cooling RE, are synthesized as coloured thermometers. Figure 5 was created by NorArte Visual Science (https://www.norarte.es/en/) upon request.
Extended Data Fig. 1
Extended Data Fig. 1. Radiative effect of SLH on short-lived climate forcers at the top of model.
RE for the only AANE and AANE+ANT configurations are shown by empty and black-striped colored bars, respectively, for all-sky (a) and clear-sky (b) conditions. Results for the pre-industrial period are on the left and consider only natural halogen emissions, while the RE in year 2100 for RCP6.0 (light-grey shading) and RCP8.5 (heavy-grey shading) climate scenarios are shown on the right. The RE due to clouds and aerosol-cloud (Aer-Cld) interaction is shown on top of the net (gas+aerosol) effect on b. Comparison of only AANE and AANE+ANT results indicates that most of the RE due to SLH arise from the contribution of natural sources that have been anthropogenically amplified during present-day and end-of-the-century conditions. The uncertainty range for each species is computed as half of the difference between the maximum and minimum RE obtained for the complete set of model sensitivities for each individual time period (mean ± range/2) as described in the Supplementary Information (see Extended Data Table 5).
Extended Data Fig. 2
Extended Data Fig. 2. Spatially-resolved SLH-driven radiative effect of the main short-lived climate forcers during future scenarios.
The individual RE contribution arising from methane (a,b), ozone (c,d) and aerosols (e,f) at the top of the model are shown for the AANE+ANT configuration in year 2100 for the RCP 6.0 (left column) and RCP 8.5 (right column) scenarios. Equivalent panels for pre-industrial and present-day conditions are shown in Fig. 2. All maps and elements were created by our research group using Matplotlib Basemap for Phyton.
Extended Data Fig. 3
Extended Data Fig. 3. SLH-driven perturbation of the atmospheric oxidative capacity.
The percentage change in hydroxyl radical (OH) mixing ratios for pre-industrial (a,b) and present-day (c,d) are computed as PI(%) = (Natural−NoSLH)/NoSLH × 100% and PD(%) = (AANE+ANT−NoSLH)/NoSLH × 100%, respectively (see definitions of model simulations in Extended Data Table 1). The annual mean surface OH difference is shown in the left column panels, whereas the annual zonal mean difference is presented on the right panels. Note that even though SLH increase surface OH abundance over the continents (mostly above industrialized regions during present-day), the net effect of SLH on the oxidative capacity is to reduce the global mean OH abundance. All maps and elements were created by our research group using gsn_csm library for NCL.
Extended Data Fig. 4
Extended Data Fig. 4. Spatially-resolved radiative effect contribution for individual aerosols.
The individual contribution arising from sulfate (a,b,c,d; top row), SOA (e,f,g,h; middle row) and ammonium nitrate (i,j,k,l; bottom row) for the AANE+ANT configuration are shown for pre-industrial (1st column; only NAT), present-day (2nd column), RCP 6.0 (3rd column) and RCP 8.5 (4th column) scenarios. The total contribution for all aerosols together is shown in the bottom row of Fig. 2 and Extended Data Fig. 2. The aerosol RE present a pronounced spatial variability (most notorious for ammonium nitrate, which has a predominant anthropogenic origin), with maximum impacts during present-day over industrialized regions such as Europe, North America and East Asia. The halogen-driven RE of sulfate aerosols during present-day (panel b) changes from positive to negative over China, in agreement with ref. . All maps and elements were created by our research group using Matplotlib Basemap for Phyton.
Extended Data Fig. 5
Extended Data Fig. 5. Spatial distribution of the SLH-driven change in radiative effect (ΔRE) for individual SLCF.
ΔRE for methane (a,b,c; top row), ozone (d,e,f; middle row) and aerosols (g,h,i; bottom row) with respect to the pre-industrial period are shown for the AANE+ANT simulations. Note that methane presents a pronounced enhancement for both RCP 6.0 and RCP 8.5, while for the case of ozone ΔRE for present-day and future RCP 8.5 scenarios is larger than for the future RCP 6.0 because the latter presents more stringent air-pollutants reductions. ΔRE for aerosols shows a pronounced spatial-distribution, presenting positive and negative variations due to the different contributions of sulfate, ammonium nitrate and SOA (see Extended Data Fig. 4). All maps and elements were created by our research group using Matplotlib Basemap for Phyton.

Comment in

References

    1. Saiz-Lopez, A. & von Glasow, R. Reactive halogen chemistry in the troposphere. Chem. Soc. Rev.41, 6448–6472 (2012). 10.1039/c2cs35208g - DOI - PubMed
    1. Simpson, W. R., Brown, S. S., Saiz-Lopez, A., Thornton, J. A. & Von Glasow, R. Tropospheric halogen chemistry: sources, cycling, and impacts. Chem. Rev.115, 4035–4062 (2015). 10.1021/cr5006638 - DOI - PMC - PubMed
    1. Engel, A. et al. Update on Ozone-Depleting Substances (ODSs) and Other Gases of Interest to the Montreal Protocol. In Scientific Assessment of Ozone Depletion: 2018 Ch. 1 (WMO, 2019); https://csl.noaa.gov/assessments/ozone/2018/executivesummary/#section-5.
    1. Cuevas, C. A. et al. Rapid increase in atmospheric iodine levels in the North Atlantic since the mid-20th century. Nat. Commun.9, 1452 (2018). 10.1038/s41467-018-03756-1 - DOI - PMC - PubMed
    1. Legrand, M. et al. Alpine ice evidence of a three-fold increase in atmospheric iodine deposition since 1950 in Europe due to increasing oceanic emissions. Proc. Natl Acad. Sci. USA115, 12136–12141 (2018). 10.1073/pnas.1809867115 - DOI - PMC - PubMed

Publication types