. 2023 Jun 28;6(1):676.
doi: 10.1038/s42003-023-05057-w.

Spermidine from arginine metabolism activates Nrf2 and inhibits kidney fibrosis

Affiliations

Spermidine from arginine metabolism activates Nrf2 and inhibits kidney fibrosis

Seishi Aihara et al. Commun Biol. .

Abstract

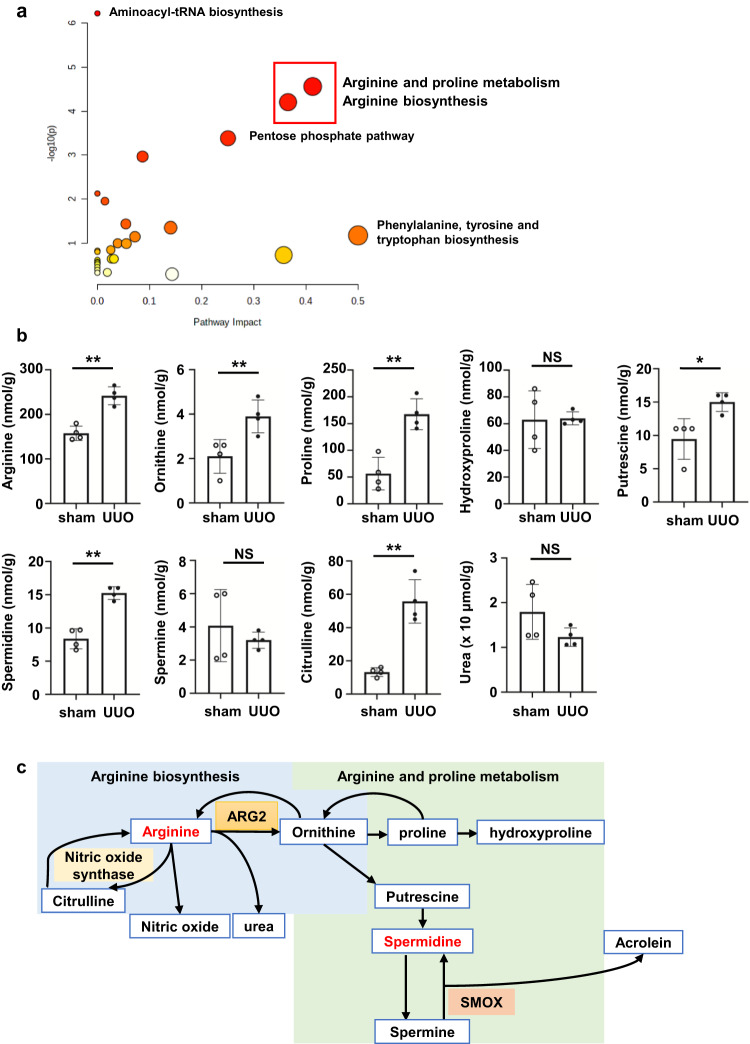
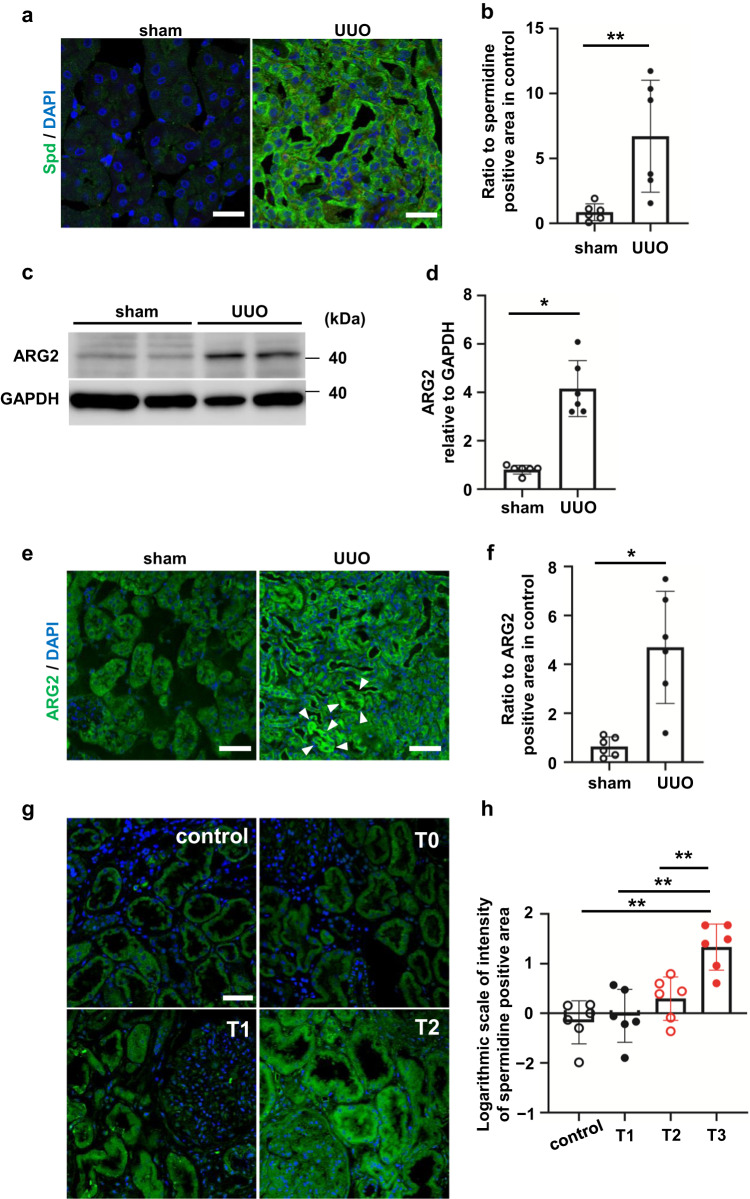
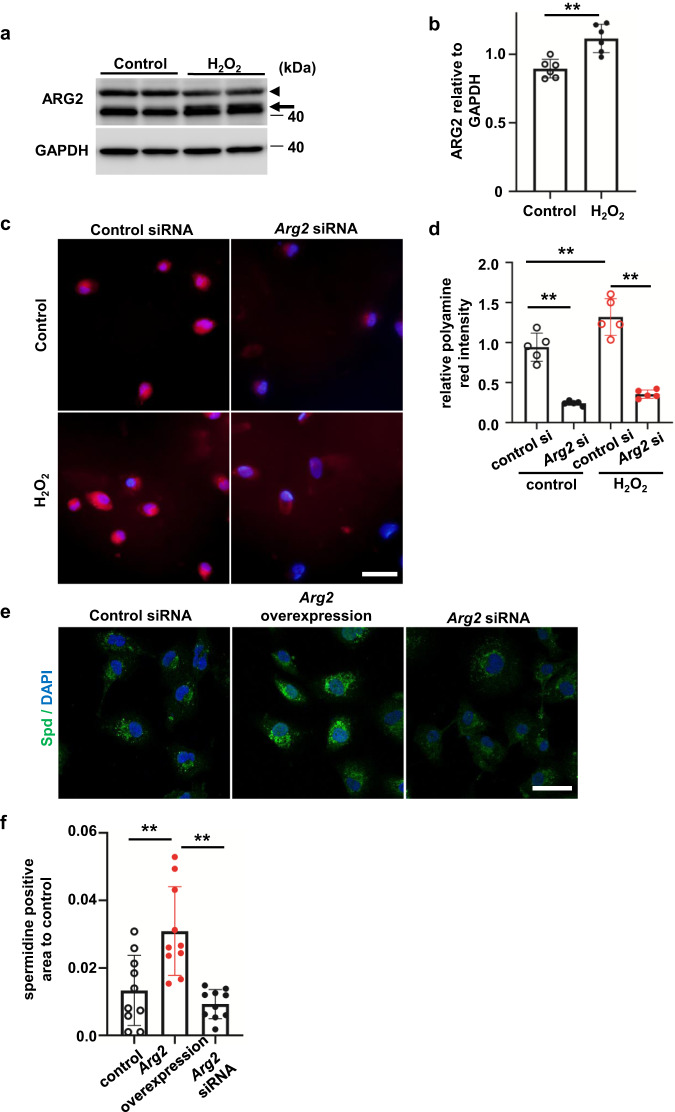
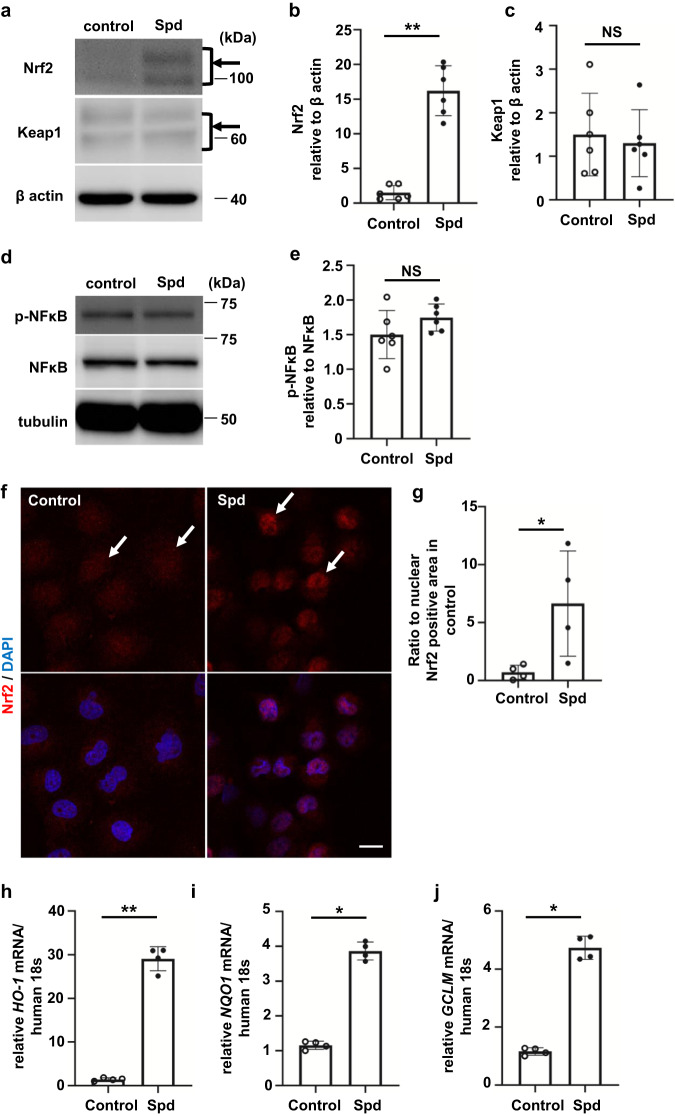
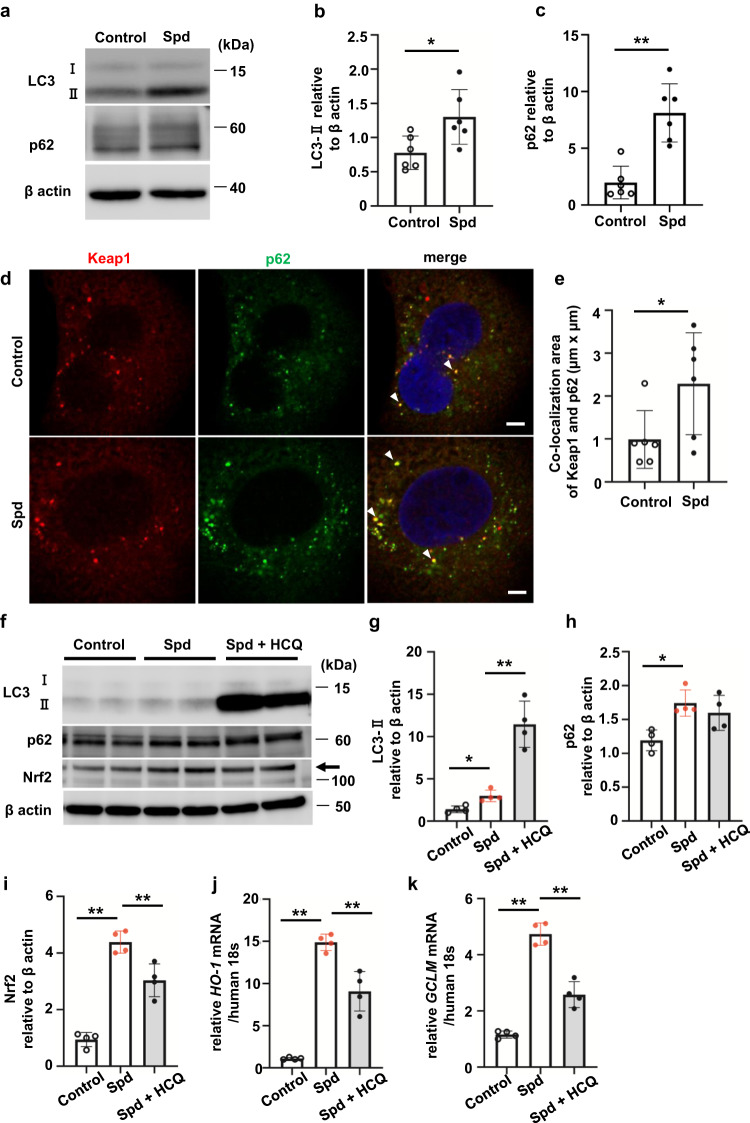
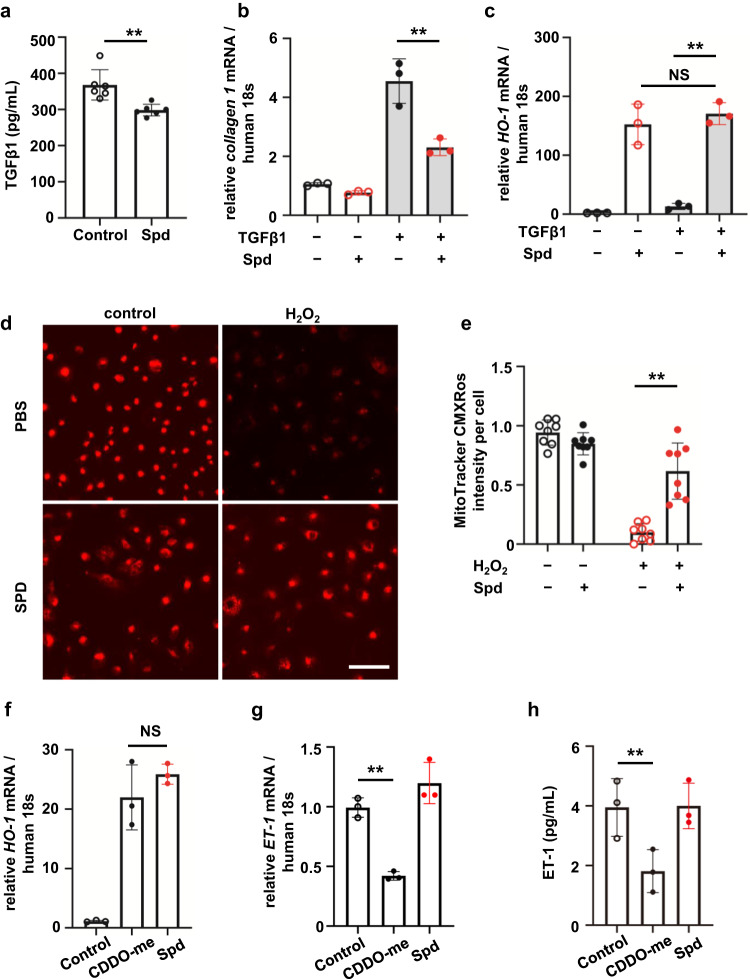
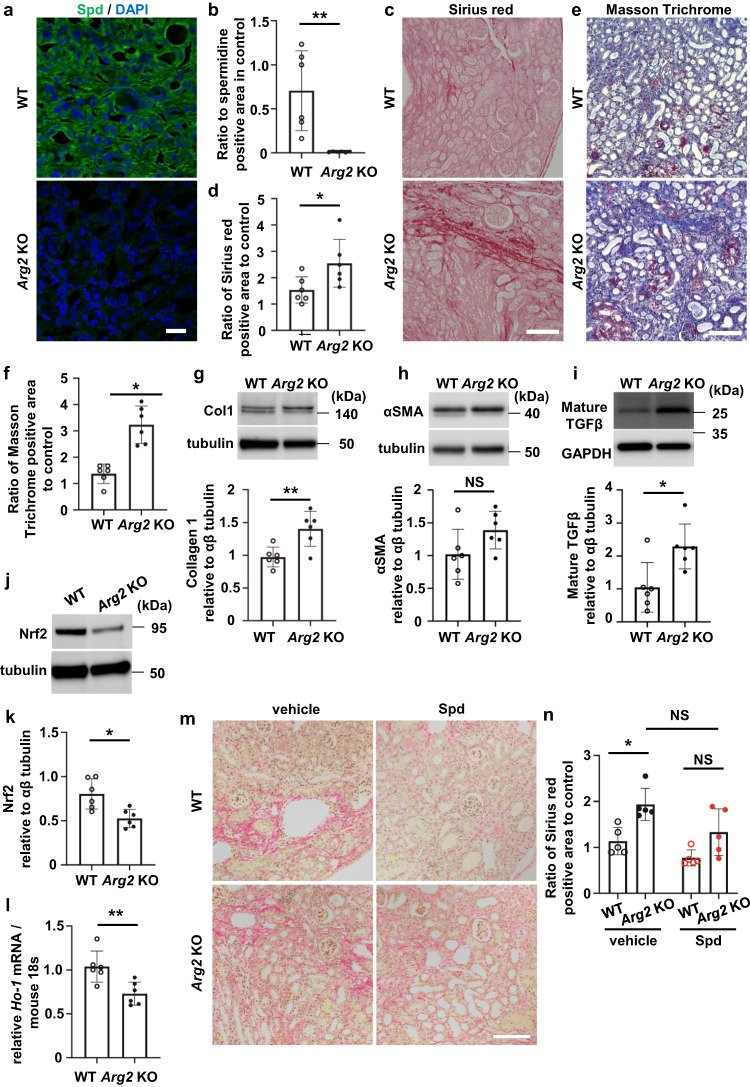
Kidney metabolism may be greatly altered in chronic kidney disease. Here we report that arginine metabolism is the most altered in unilateral ureteral obstruction (UUO)-induced fibrosis of the kidneys in metabolomic analysis. Spermidine is the most increased metabolite of arginine. In human glomerulonephritis, the amount of spermidine shown by immunostaining is associated with the amount of fibrosis. In human proximal tubule cells, spermidine induces nuclear factor erythroid 2-related factor 2 (Nrf2). Subsequently, fibrotic signals, such as transforming growth factor β1 secretion, collagen 1 mRNA, and oxidative stress, represented by a decrease in the mitochondrial membrane potential is suppressed by spermidine. UUO kidneys of Arg2 knockout mice show less spermidine and significantly exacerbated fibrosis compared with wild-type mice. Nrf2 activation is reduced in Arg2 knockout UUO kidneys. Spermidine treatment prevents significant fibrotic progression in Arg2 knockout mice. Spermidine is increased in kidney fibrosis, but further increases in spermidine may reduce fibrosis.


Conflict of interest statement

The authors declare no competing interests.

Figures

Fig. 1
Fig. 1. Arginine metabolism is upregulated in the UUO kidney of mice.
a Results of pathway analysis using MetaboAnalyst. Of the 110 metabolites, pathway analysis was performed only for metabolites with a fold change of ≥1.5 in the UUO kidney relative to shams (n = 4 in each group). Red squares indicate “arginine and proline metabolism” and “arginine biosynthesis”. b Absolute quantitative values of metabolites related to arginine metabolites in the UUO kidney compared with those in shams (n = 4 in each group). Data are indicated as means ± SD. c Schematic diagram of “arginine biosynthesis” and “arginine and proline metabolism”. *P < 0.05, **P < 0.01. NS not significant, UUO unilateral ureteral obstruction, ARG2 arginase 2, SMOX spermine oxidase.
Fig. 2
Fig. 2. UUO increases spermidine and ARG2 protein levels in the mouse kidney.
a Confocal immunofluorescence microscopic images of Spd in control and UUO kidneys. Green, anti-Spd antibody; blue, DAPI. Scale bars, 50 µm. b Quantification of the Spd-positive area in control and UUO kidneys (n = 6 in each group). Data are indicated as means ± SD. c Western blot analysis of ARG2 protein levels in the whole kidney of sham and UUO mice. d Relative levels of ARG2 protein normalized to GAPDH in sham and UUO kidneys are shown (n = 6 in each group). Data are indicated as means ± SD. e Immunohistochemistry of ARG2 in control and UUO kidneys. Green, anti-ARG2 antibody; blue, DAPI. Scale bars, 50 µm. White arrowheads indicate ARG2-positive tubules. f Quantification of the ARG2-positive area in sham and UUO kidneys (n = 6 in each group). Data are indicated as means ± SD. *P < 0.05, **P < 0.01. g Immunostaining of Spd in the human kidney. Control, donor kidneys; T0–T2, interstitial fibrosis/tubular atrophy scores from the Oxford classification of IgA nephropathy. The percentages of lesions in the cortical area were as follows: T0 = 0%–25%, T1 = 26%–50%, and T2 = > 50%. Scale bars, 50 µm. h Quantification of the Spd-positive area in human kidneys (n = 6 in each group). Data are indicated as means ± SD. **P < 0.01. Spd spermidine, UUO unilateral ureteral obstruction, ARG2 arginase 2, DAPI 4′,6-diamidino-2-phenylindole, GAPDH glyceraldehyde-3-phosphate dehydrogenase.
Fig. 3
Fig. 3. Oxidative stress upregulates ARG2 protein levels in renal tubular epithelial cells.
a Western blot analysis of ARG2 protein levels in HK-2 cells stimulated with H2O2. The arrowhead shows a nonspecific signal. b Relative levels of ARG2 protein normalized to GAPDH are shown (n = 6 in each group). Data are indicated as means ± SD. c Polyamine red staining in control or Arg2 siRNA-transfected HK-2 cells stimulated with H2O2. Red, polyamine; blue, DAPI. Scale bars, 20 µm. d Quantification of polyamine red fluorescence intensity/cell shown in Fig. 3c (n = 5 in each group). Data are indicated as means ± SD. e Immunofluorescence images of Spd in HK-2 cells with Arg2 overexpression or knockdown. Green, anti-Spd antibody; blue, DAPI. Scale bars, 20 µm. f Quantification of the Spd-positive area corrected for nuclei (n = 10 in each group). Data are indicated as means ± SD. *P < 0.05, **P < 0.01. Spd spermidine, ARG2 arginase 2, DAPI 4′,6-diamidino-2-phenylindole, GAPDH glyceraldehyde-3-phosphate dehydrogenase.
Fig. 4
Fig. 4. Spd activates the transcription factor Nrf2 in renal tubular epithelial cells.
a Western blot analysis of Nrf2 and Keap1 protein levels in HK-2 cells incubated with Spd. The arrow shows two Nrf2 bands. b Relative levels of Nrf2 protein normalized to β-actin are shown (n = 6 in each group). Data are indicated as means ± SD. c Relative levels of Keap1 protein normalized to β-actin are shown (n = 6 in each group). Data are indicated as means ± SD. d Western blot analysis of phospho- and total NF-κB in HK-2 cells incubated with Spd. e Relative levels of phospho-NF-κB protein normalized to total NF-κB are shown (n = 6 in each group). Data are indicated as means ± SD. f Immunofluorescence images of Nrf2 in HK-2 cells incubated with Spd. Red, anti-Nrf2 antibody; blue, DAPI. Scale bars, 20 µm. g Quantification of the nuclear Nrf2-positive area corrected for nuclei. Data are indicated as means ± SD. h HO-1, i NQO1, and j GCLM mRNA expression determined by real-time PCR in HK-2 cells incubated with Spd (n = 4 in each group). Data are indicated as means ± SD. *P < 0.05, **P < 0.01. Spd spermidine, Nrf2 nuclear factor erythroid 2-related factor 2, Keap1 kelch-like ECH-associated protein 1, NF-κB nuclear factor-κB, DAPI 4′,6-diamidino-2-phenylindole.
Fig. 5
Fig. 5. Spd activates autophagy, resulting in acceleration of Keap1 degradation in renal tubular epithelial cells.
a Western blot analysis of LC3-I and II and p62 in HK-2 cells incubated with Spd. b Relative levels of LC3-II protein normalized to β-actin are shown (n = 6 in each group). Data are indicated as means ± SD. c Relative levels of p62 protein normalized to β-actin are shown (n = 6 in each group). Data are indicated as means ± SD. d Confocal immunofluorescence microscopic images of Keap1 and p62 in HK-2 cells incubated with Spd. Red, anti-Keap1 antibody; green, anti-p62 antibody; blue, DAPI. White arrowheads indicate co-localized areas. Scale bars, 5 µm. e Quantification of co-localization areas of Keap1 and p62 in each cell. Data are indicated as means ± SD. f Western blot analysis of LC3-I and II, p62, and Nrf2 in HK-2 cells incubated with Spd in the presence of HCQ. g LC3-II, h p62, and i Nrf2 relative protein levels normalized to β-actin are shown (n = 4 in each group). Data are indicated as means ± SD. j HO-1 and k GCLM mRNA expression determined by real-time PCR (n = 4 in each group). Data are indicated as means ± SD. *P < 0.05, **P < 0.01. Spd spermidine, LC3 microtubule-associated protein 1A/1B-light chain 3, Keap1 kelch-like ECH-associated protein 1, HCQ hydroxychloroquine.
Fig. 6
Fig. 6. Spd suppresses fibrotic signaling, but does not inhibit the endothelin pathway like bardoxolone methyl.
a Secretion of TGFβ1 from HK-2 cells treated with Spd measured by ELISA (n = 6 in each group). Data are indicated as means ± SD. b Collagen 1 and c HO-1 mRNA expression determined by real-time PCR in HK-2 cells incubated with TGFβ1 in the presence of Spd (n = 3 in each group). Data are indicated as means ± SD. d MitoTracker Red CMXRos staining in HK-2 cells when exposed to H2O2 and Spd. Scale bar, 100 µm. e Quantification of Mitotracker Red CMXRos intensity measured by a multimode plate reader (n = 8 in each group). Data are indicated as means ± SD. f HO-1 and g ET-1 mRNA expression determined by real-time PCR in HK-2 cells incubated with Spd and CDDO-me (n = 3 in each group). Data are indicated as means ± SD. h Secretion of ET-1 from HK-2 cells treated with Spd and CDDO-me measured by ELISA (n = 3 in each group). Data are indicated as means ± SD. **P < 0.01. NS not significant, Spd spermidine, TGFβ1 transforming growth factor β1, CDDO-me bardoxolone methyl.
Fig. 7
Fig. 7. UUO-induced kidney fibrosis is aggravated in the Arg2 knockout mouse kidney.
a Confocal immunofluorescence images of Spd in the UUO kidney of WT and Arg2 KO mice. Green, anti-Spd antibody; blue, DAPI. Scale bars, 20 µm. b Quantification of the Spd-positive area (n = 6 in each group). Data are indicated as means ± SD. c Representative images of Sirius red staining in the UUO kidney of WT and Arg2 KO mice. Scale bars, 100 µm. d Quantification of the Sirius red staining-positive area (n = 6 in each group). Data are indicated as means ± SD. e Representative images of Masson trichrome staining in the UUO kidney of WT and Arg2 KO mice. Scale bars, 100 µm. f Quantification of the Masson trichrome staining-positive area (n = 6 in each group). Data are indicated as means ± SD. g Western blot analysis of collagen type 1 protein in the UUO kidney of WT and Arg2 KO mice. Quantification of relative levels of collagen type 1 protein normalized to αβ tubulin are shown on the right (n = 6 in each group). Data are indicated as means ± SD. h Western blot analysis of αSMA protein in the UUO kidney of WT and Arg2 KO mice. Quantification of relative levels of αSMA protein normalized to αβ tubulin are shown on the right (n = 6 in each group). Data are indicated as means ± SD. i Western blot analysis of mature TGFβ protein in the UUO kidney of WT and Arg2 KO mice. Quantification of relative levels of mature TGFβ protein normalized to αβ tubulin are shown on the right (n = 6 in each group). Data are indicated as means ± SD. j Western blot analysis of Nrf2 protein in the UUO kidney of WT and Arg2 KO mice. k Quantification of relative levels of Nrf2 protein normalized to αβ tubulin (n = 6 in each group). Data are indicated as means ± SD. l HO-1 mRNA expression in the UUO kidney of WT and Arg2 KO mice determined by real-time PCR (n = 6 in each group). Data are indicated as means ± SD. m Representative images of Sirius red staining in the UUO kidney of WT and Arg2 KO mice treated with Spd. Scale, 100 µm. n Quantification of the Sirius red staining-positive area (n = 5 in each group). Data are indicated as means ± SD. *P < 0.05, **P < 0.01. NS not significant, UUO unilateral ureteral obstruction, Col1 collagen 1, Spd spermidine, DAPI 4′,6-diamidino-2-phenylindole, αSMA α smooth muscle actin, TGFβ transforming growth factor β1, Nrf2 nuclear factor erythroid 2-related factor 2.

References

    1. Rockey DC, Bell PD, Hill JA. Fibrosis-a common pathway to organ injury and failure. N. Engl. J. Med. 2015;372:1138–1149. doi: 10.1056/NEJMra1300575. - DOI - PubMed
    1. Levey AS, Coresh J. Chronic kidney disease. Lancet. 2012;379:165–180. doi: 10.1016/S0140-6736(11)60178-5. - DOI - PubMed
    1. Kang HM, et al. Defective fatty acid oxidation in renal tubular epithelial cells has a key role in kidney fibrosis development. Nat. Med. 2015;21:37–46. doi: 10.1038/nm.3762. - DOI - PMC - PubMed
    1. Rinschen MM, et al. Accelerated lysine metabolism conveys kidney protection in salt-sensitive hypertension. Nat. Commun. 2022;13:4099. doi: 10.1038/s41467-022-31670-0. - DOI - PMC - PubMed
    1. Garibotto G, et al. Amino acid and protein metabolism in the human kidney and in patients with chronic kidney disease. Clin. Nutr. 2010;29:424–433. doi: 10.1016/j.clnu.2010.02.005. - DOI - PubMed

Publication types