. 2023 Jul;619(7968):143-150.
doi: 10.1038/s41586-023-06249-4. Epub 2023 Jun 28.

GDF15 promotes weight loss by enhancing energy expenditure in muscle

Affiliations

GDF15 promotes weight loss by enhancing energy expenditure in muscle

Dongdong Wang et al. Nature. 2023 Jul.

Abstract

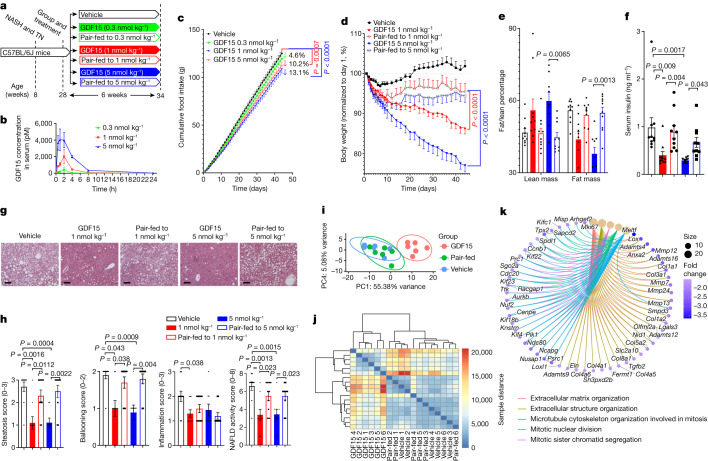
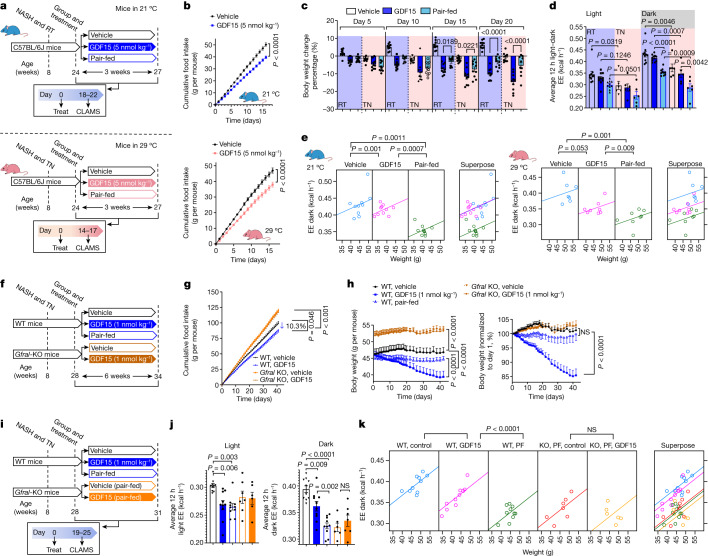
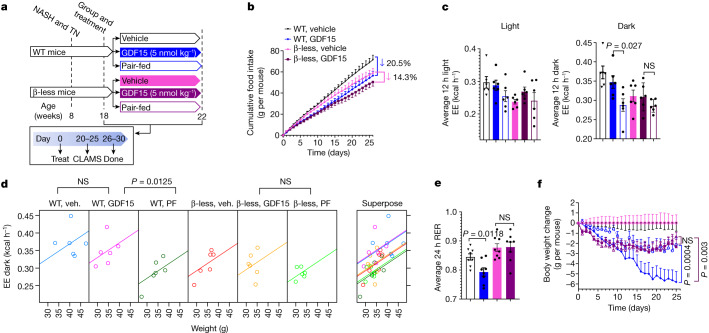
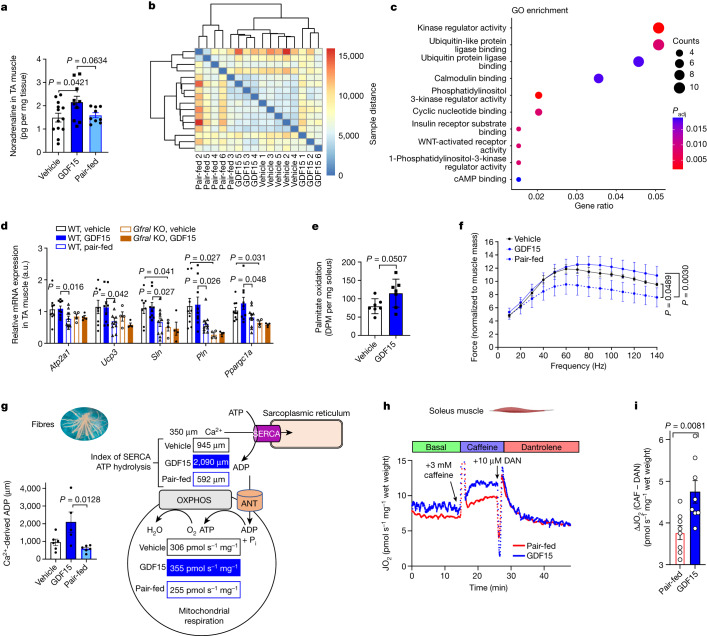
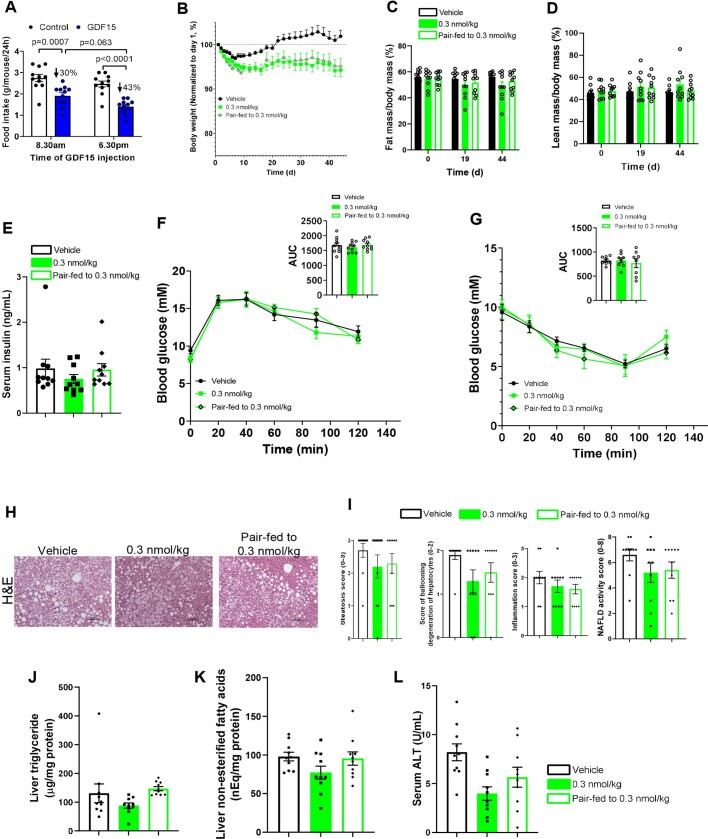
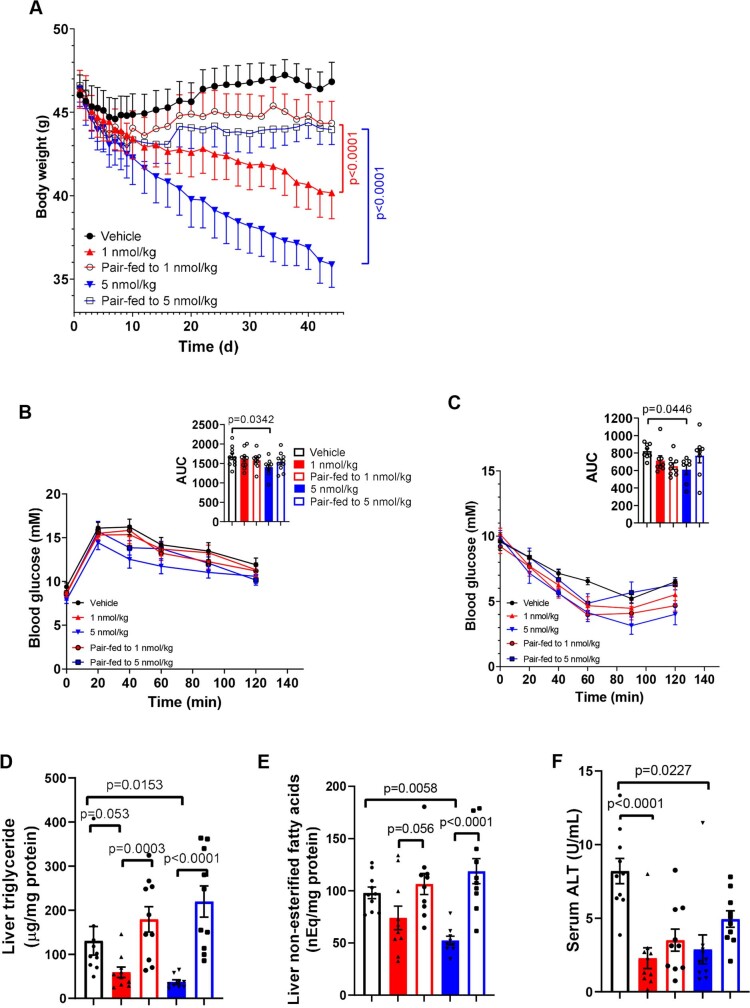
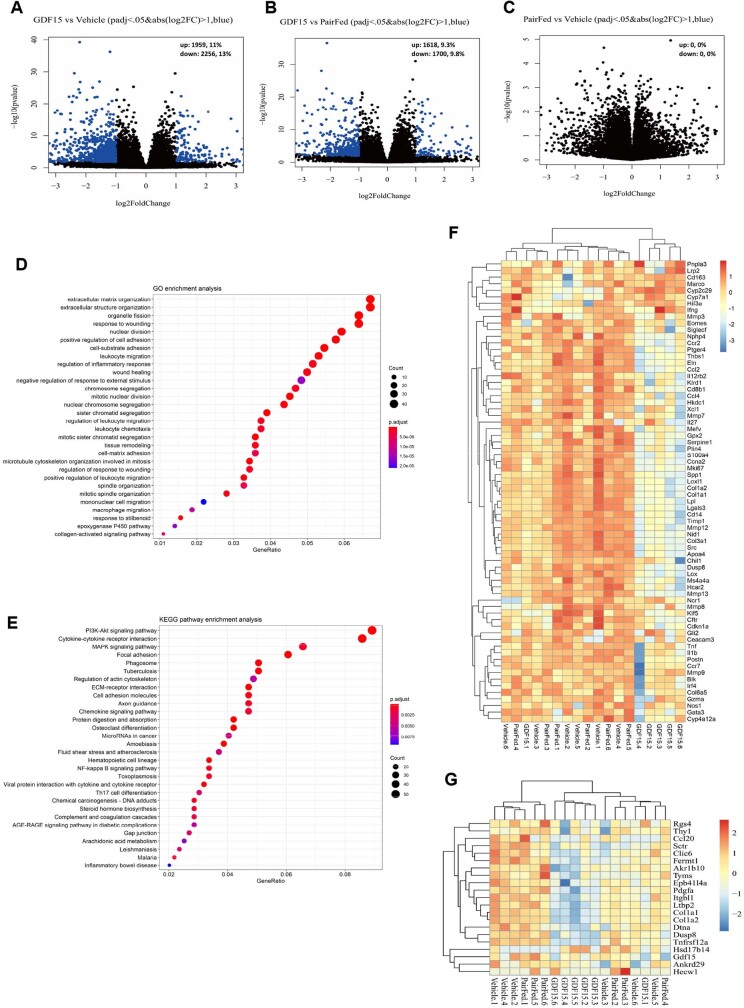
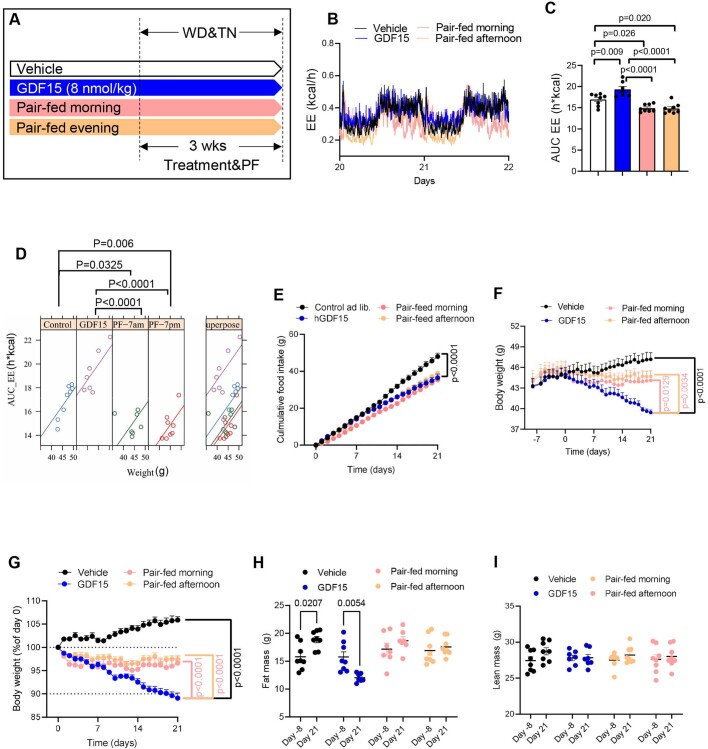
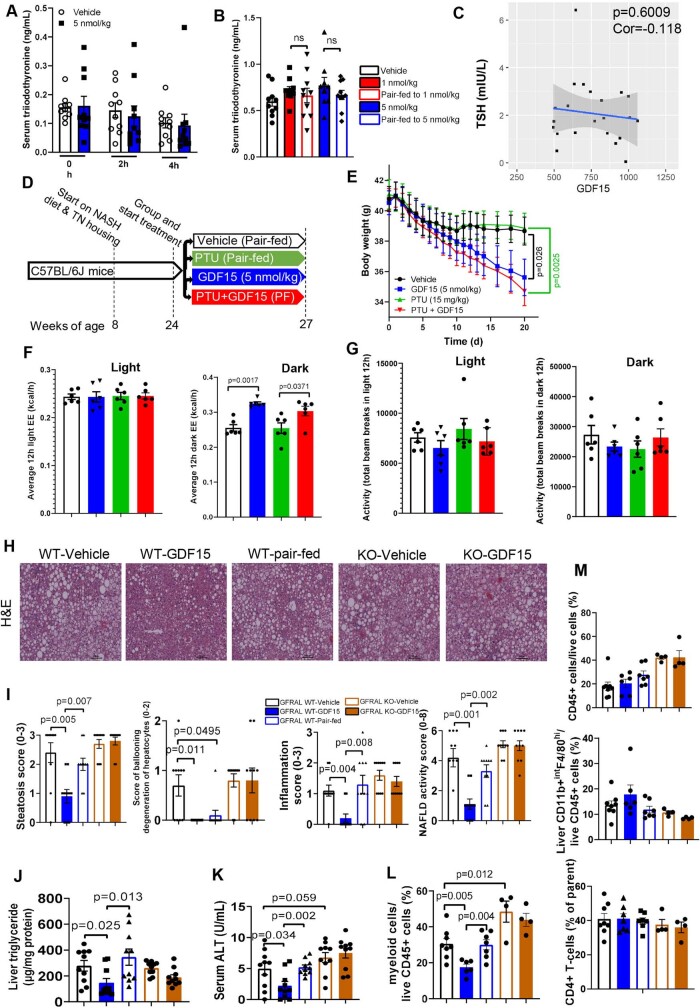
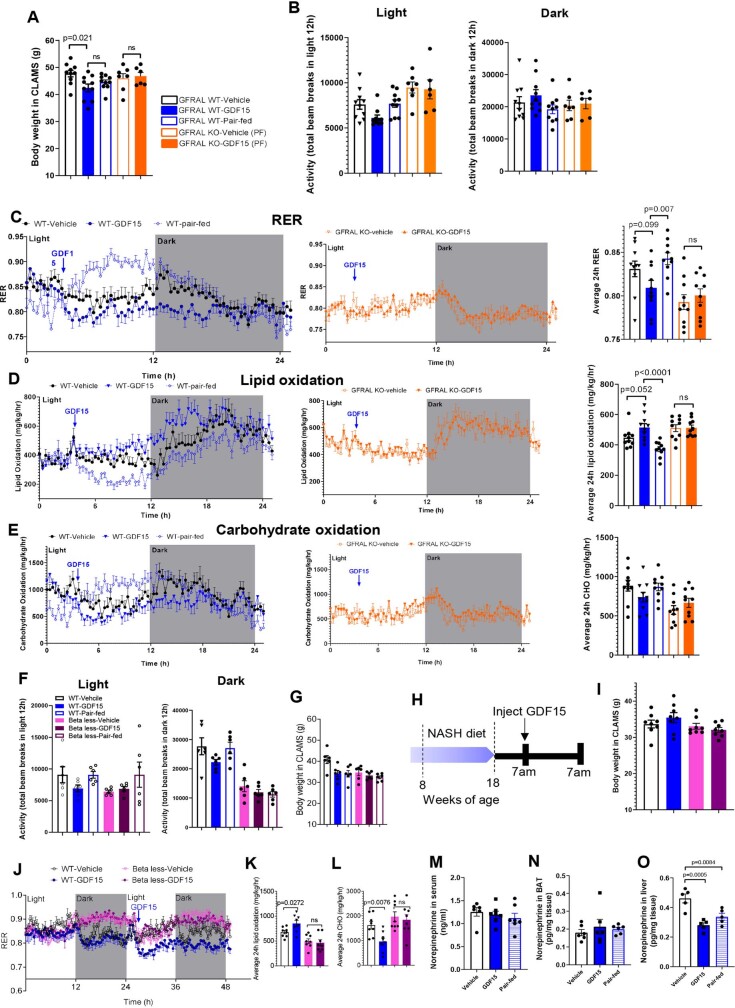
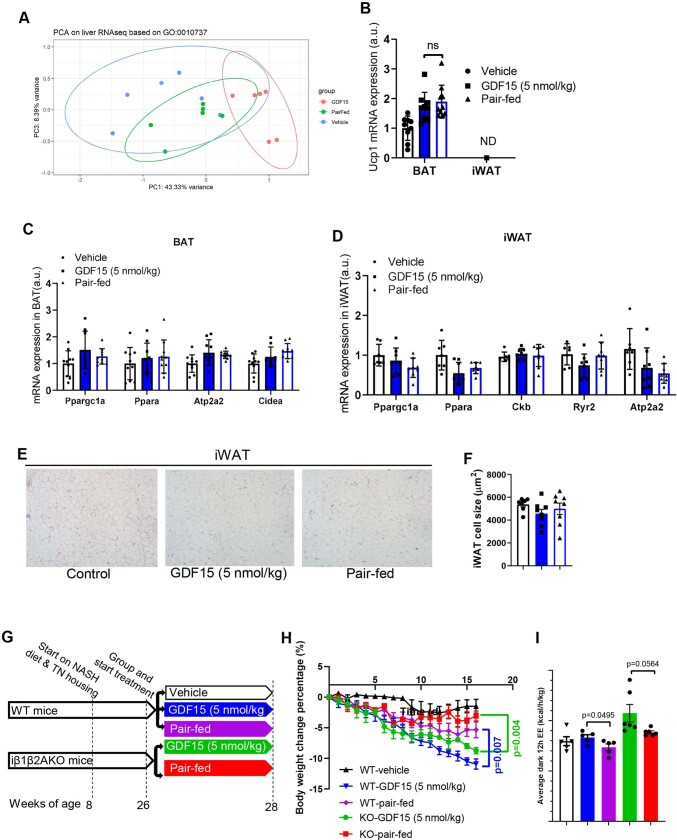
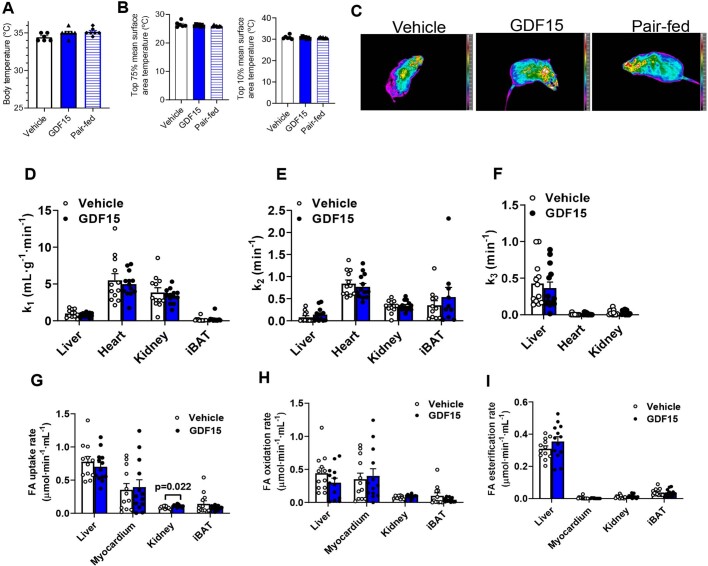
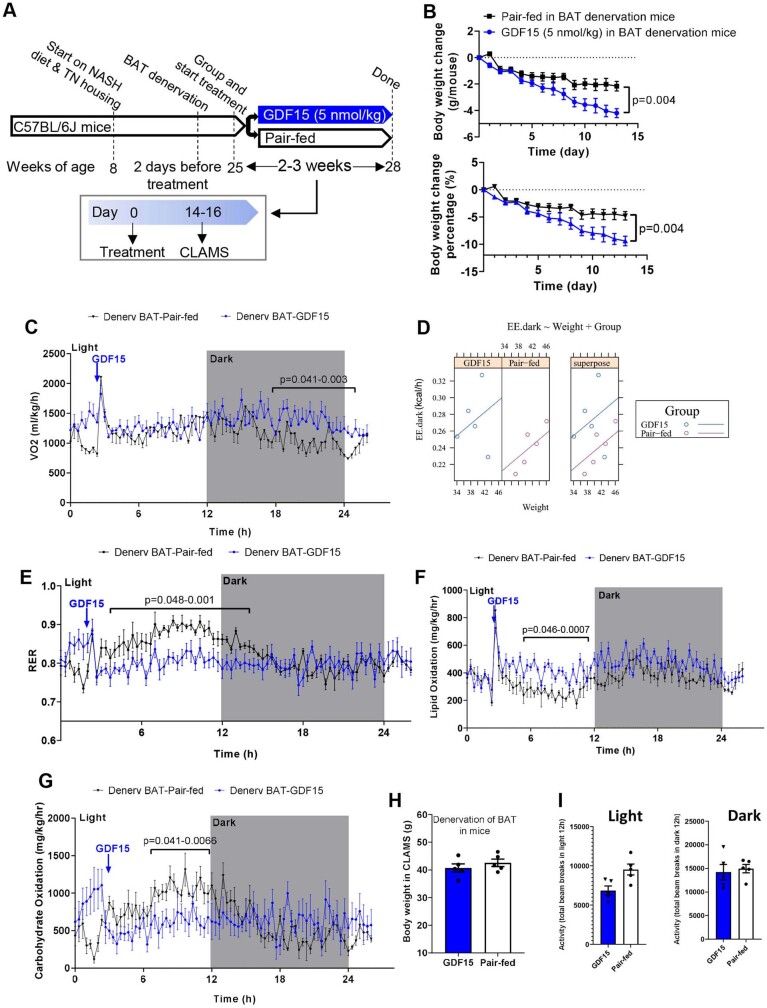
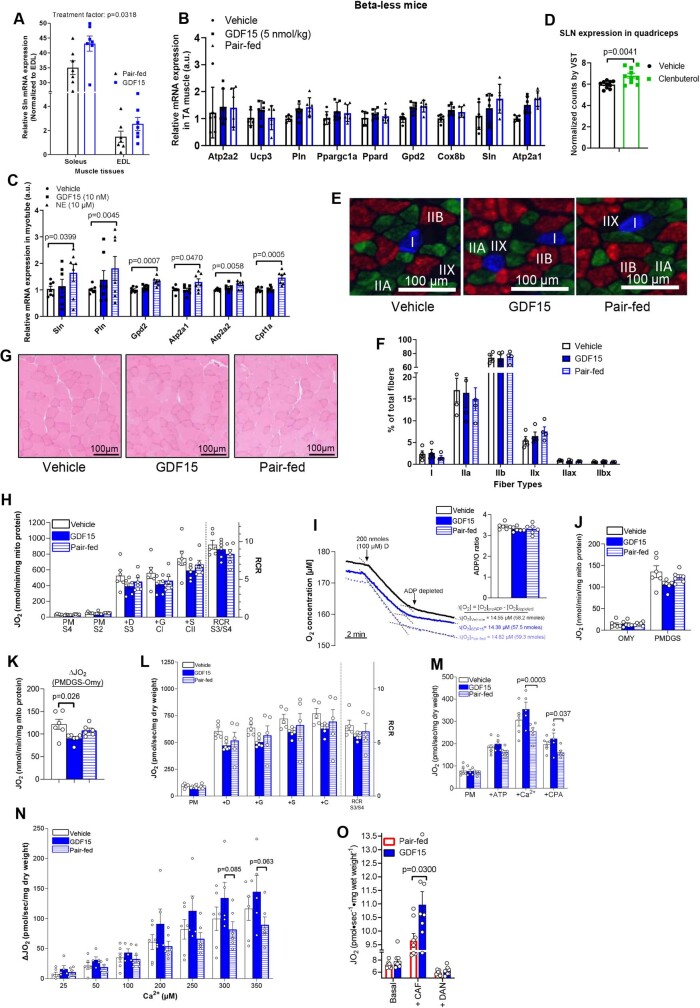
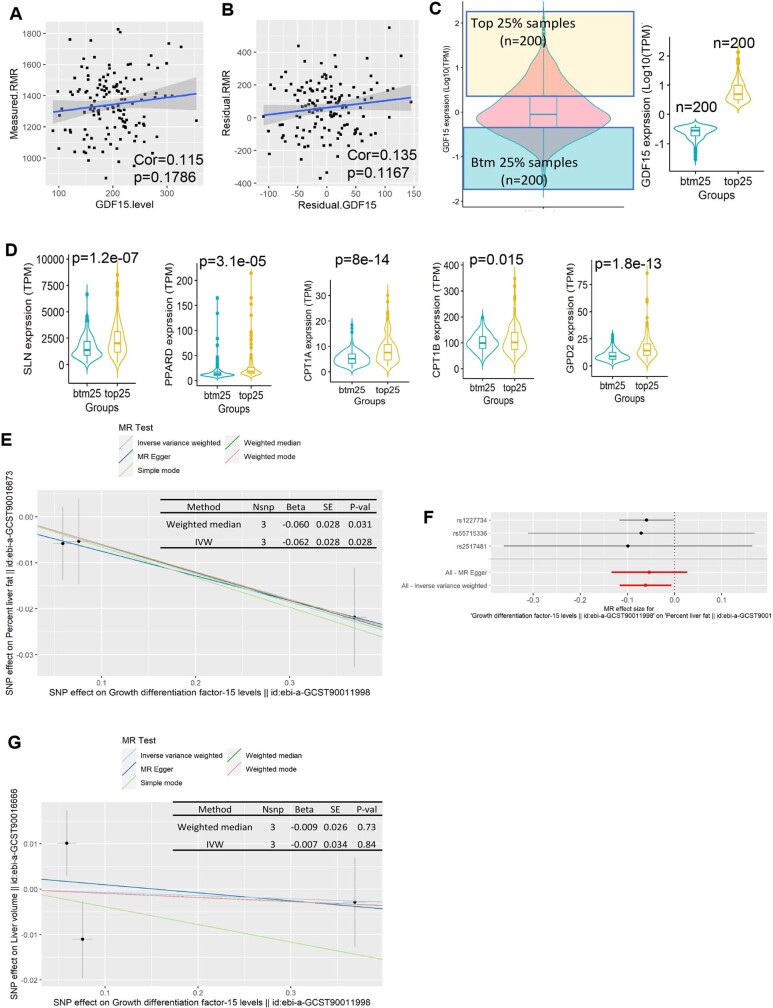
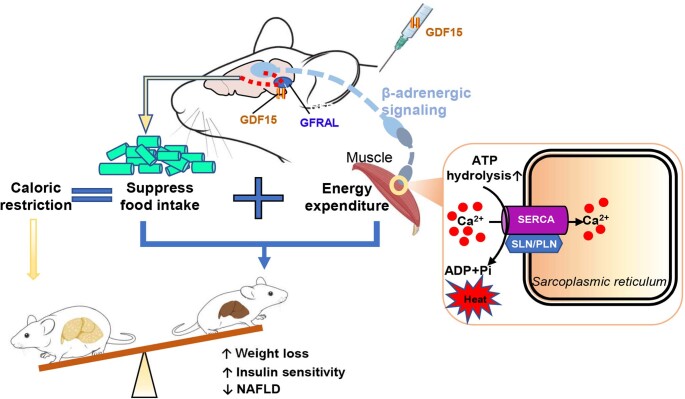
Caloric restriction that promotes weight loss is an effective strategy for treating non-alcoholic fatty liver disease and improving insulin sensitivity in people with type 2 diabetes1. Despite its effectiveness, in most individuals, weight loss is usually not maintained partly due to physiological adaptations that suppress energy expenditure, a process known as adaptive thermogenesis, the mechanistic underpinnings of which are unclear2,3. Treatment of rodents fed a high-fat diet with recombinant growth differentiating factor 15 (GDF15) reduces obesity and improves glycaemic control through glial-cell-derived neurotrophic factor family receptor α-like (GFRAL)-dependent suppression of food intake4-7. Here we find that, in addition to suppressing appetite, GDF15 counteracts compensatory reductions in energy expenditure, eliciting greater weight loss and reductions in non-alcoholic fatty liver disease (NAFLD) compared to caloric restriction alone. This effect of GDF15 to maintain energy expenditure during calorie restriction requires a GFRAL-β-adrenergic-dependent signalling axis that increases fatty acid oxidation and calcium futile cycling in the skeletal muscle of mice. These data indicate that therapeutic targeting of the GDF15-GFRAL pathway may be useful for maintaining energy expenditure in skeletal muscle during caloric restriction.


Conflict of interest statement

S.B.J. and R.E.K. are employees of Novo Nordisk, a pharmaceutical company producing and selling medicine for the treatment of diabetes and obesity. G.R.S. is a co-founder and shareholder of Espervita Therapeutics. McMaster University has received funding from Espervita Therapeutics, Esperion Therapeutics, Poxel Pharmaceuticals and Nestle for research conducted in the laboratory of G.R.S. S.R. is supported by a MITACS postdoctoral fellowship sponsored by Novo Nordisk. H.C.G. holds the McMaster-Sanofi Population Health Institute Chair in Diabetes Research and Care. G.R.S., G.P. and H.C.G. are inventors listed on a patent for identifying GDF15 as a biomarker for metformin. G.R.S. has received consulting/speaking fees from Astra Zeneca, Eli Lilly, Esperion Therapeutics, Merck, Poxel Pharmaceuticals and Cambrian Biosciences. The other authors declare no competing interests.

Figures

Fig. 1
Fig. 1. GDF15 reduces obesity, insulin resistance and NASH independently of reductions in food intake.
a, Experimental schematic. TN, thermoneutrality. b, Plasma GDF15 after injection with 0.3, 1 and 5 nmol per kg GDF15. Data are mean ± s.e.m. n = 3 mice per group. c, Food intake over time. Data are mean ± s.e.m. n = 10 mice per group, except for GDF15 (5 nmol per kg), for which n = 9 mice. P values were calculated using two-way analysis of variance (ANOVA) with Tukey’s multiple-comparison test. d, The percentage change in body mass over time. Data are mean ± s.e.m. n = 10 mice per group, except for GDF15 (5 nmol per kg), for which n = 9 mice. P values were calculated using two-way ANOVA with Tukey’s multiple-comparison test. e, The percentage of fat/lean mass relative to body mass. Data are mean ± s.e.m. n = 10 mice per group, except for GDF15 (5 nmol per kg), for which n = 9 mice. P values were calculated using two-way ANOVA with Tukey’s multiple-comparison test. f, Serum insulin. Data are mean ± s.e.m. n = 10 mice per group, except for GDF15 (5 nmol per kg), for which n = 9 mice. P values were calculated using one-way ANOVA with Tukey’s multiple-comparison test. g, Representative images of paraffin-embedded liver sections stained with haematoxylin and eosin (H&E). h, From left to right, steatosis score, ballooning score, inflammation score and NAFLD activity score. Data are mean ± s.e.m. n = 10 mice per group, except for GDF15 (5 nmol per kg), for which n = 9 mice. P values were calculated using two-sided unpaired Mann–Whitney U-tests. i, PCA of liver samples from vehicle-treated and GDF15-treated (5 nmol per kg) mice and pair-fed controls using VST data from DESeq2. n = 6 mice per group. j, Heatmap of the sample-to-sample distances on the basis of VST data from DESeq2. n = 6 mice per group. k, Gene-concept network diagram, indicating the corresponding enriched GO terms according to differentially expressed genes (DEGs) between vehicle and GDF15 groups. Source data
Fig. 2
Fig. 2. GDF15 increases energy expenditure and reduces body mass through GFRAL.
a, Experimental schematic. Mice were housed at room temperature (RT; 21 °C) or thermoneutrality (TN, 29 °C). CLAMS,Comprehensive Laboratory Animal Monitoring System. b, Cumulative food intake. Data are mean ± s.e.m. n = 10 mice per group at room temperature. n = 7 mice per group at thermoneutrality. P values were calculated using two-way ANOVA with Tukey’s multiple-comparison test. c, Percentage body weight change. Data are mean ± s.e.m. n = 10 mice per group. P values were calculated using one-way ANOVA with Tukey’s multiple-comparison test. d, Average energy expenditure. Data are mean ± s.e.m. n = 10 mice per group at room temperature. n = 6 mice per group at thermoneutrality. P values were calculated using one-way ANOVA with Šidák’s multiple-comparison test. e, ANCOVA using body mass as a covariate (two-sided without adjustment). n = 10 mice per group at room temperature and n = 6 mice per group at thermoneutrality. f, Experimental schematic for the effect of GDF15 on WT and Gfral-KO mice. EE, energy expenditure. g, Cumulative food intake. Data are mean ± s.e.m. n = 10 mice per group. P values were calculated using two-way ANOVA with Tukey’s multiple-comparison test. h, Body weight and percentage change over time. Data are mean ± s.e.m. n = 10 mice per group. P values were calculated using two-way ANOVA with Tukey’s multiple-comparison test. i, Experimental schematic for the effects of GDF15 and matched caloric restriction on energy expenditure in WT and Gfral-KO mice. j, The average energy expenditure during a 12 h–12 h light–dark cycle. Data are mean ± s.e.m. n = 10 (WT, vehicle; WT, GDF15; and WT pair-fed), n = 7 (KO, pair-fed) and n = 6 (KO, GDF15) mice. P values were calculated using one-way ANOVA with Šidák’s multiple-comparison test. NS, not significant. k, ANCOVA using body mass as a covariate and treatment as a fixed factor (two-sided without adjustment). n = 10 (WT, vehicle; WT, GDF15; and WT, pair-fed (PF)), n = 7 (KO, pair-fed) and n = 6 (KO, GDF15) mice. Images of mice generated using BioRender.com. Source data
Fig. 3
Fig. 3. GDF15 increases energy expenditure and fatty acid oxidation through β-adrenergic receptors.
a, Experimental schematic for the effects of GDF15 and matched caloric restriction in WT and β-less mice. b, Cumulative food intake. Data are mean ± s.e.m. n = 6 mice per group. P values were calculated using two-way ANOVA with Tukey’s multiple-comparison test. c, The average energy expenditure during a 12 h–12 h light–dark cycle. Data are mean ± s.e.m. n = 6 mice per group. P values were calculated using one-way ANOVA with Šidák’s multiple-comparison test. d, ANCOVA of energy expenditure against body weight of mice using body mass as a covariate and treatment as a fixed factor (two-sided without adjustment). n = 6 mice per group. Veh., vehicle. e, Average RER over 24 h. Data are mean ± s.e.m. n = 8 mice per group. P values were calculated using one-way ANOVA with Tukey’s multiple-comparison test. f, Body weight change (in grams) over time. Data are mean ± s.e.m. n = 6 mice per group. P values were calculated using two-way ANOVA with Tukey’s multiple-comparison test. Source data
Fig. 4
Fig. 4. GDF15 increases calcium futile cycling in skeletal muscle.
a, GDF15 increases noradrenaline in tibialis anterior (TA) muscle. Data are mean ± s.e.m. n = 13 (vehicle), n = 10 (GDF15), n = 9 (pair-fed) mice. P values were calculated using one-way ANOVA with Tukey’s multiple-comparison test. b, Heatmap of the sample-to-sample distances for TA muscle. n = 5 mice per group, except for the GDF15 group, for which n = 6 mice. c, GO annotation between GDF15 and pair-fed groups. The adjusted P value (Padj) was calculated using the Benjamini–Hochberg method. d, Relative gene expression in muscle. Data are mean ± s.e.m. n = 9 (WT, vehicle; and WT, GDF15), n = 10 (WT, pair-fed) and n = 4 (KO, pair-fed; and KO, GDF15) mice. P values were calculated using two-way ANOVA with Tukey’s multiple-comparison test. a.u., arbitrary units. e, Fatty acid oxidation in soleus muscle. Data are mean ± s.e.m. n = 7 mice per group. P values were calculated using two-sided unpaired t-tests. DPM, disintegrations per minute. f, Force–frequency curve of EDL muscles. Data are mean ± s.e.m. n = 4 mice per group. P values were calculated using two-way ANOVA with Tukey’s multiple-comparison test. g, Calculated calcium (Ca2+)-derived ADP in permeabilized fibres from red skeletal muscle. Data are mean ± s.e.m. n = 6 mice per group, except for the GDF15 group, for which n = 5 mice. P values were calculated using one-way ANOVA with Tukey’s multiple-comparison test (Supplementary Fig. 5). Schematic of the SERCA efficiency. Pi, inorganic phosphate. h, Real-time trace from a single soleus respiration experiment (n = 1 mouse per group) showing the experimental protocol to measure basal, caffeine-stimulated (CAF; 3 mM) and Ca2+-independent (10 μM dantrolene (DAN)) respiration (JO2). I, Ca2+-dependent JO2 (CAF-DAN) calculated from Extended Data Fig. 10o. Data are mean ± s.e.m. n = 8 mice per group. P values were calculated using two-sided unpaired t-tests. Source data
Extended Data Fig. 1
Extended Data Fig. 1. GDF15 at 0.3 nmol/kg has no effects on body weight, body composition, glucose homeostasis and NAFLD.
A, the influence of injection of mice on food intake at the start of the light/dark-cycle with GDF15 (5 nmol/kg). Data are means ± SEM, n = 10 mice/group. P values by two-way ANOVA with Tukey’s multiple comparisons test. B, Body weight. Data are means ± SEM, n = 10 mice/group. C, Fat mass/body mass (%). Data are means ± SEM, n = 10 mice/group. D, Lean mass/body mass (%). Data are means ± SEM, n = 10 mice/group. E, Serum insulin levels. Data are means ± SEM, n = 10 per group. F, Glucose tolerance test (GTT). Data are means ± SEM, n = 10 mice/group. G, Insulin tolerance test (ITT). Data are means ± SEM, n = 8 mice/group. H, Representative images of paraffin-embedded liver sections stained with H&E. I, Steatosis score, score of ballooning degeneration of hepatocytes, inflammation score, and NAFLD activity score. Data are means ± SEM, n = 10 mice/group. J, liver triglycerides (TG). Data are means ± SEM, n = 10 mice/group. K, Liver non-esterified free-fatty acids (NEFA). Data are means ± SEM, n = 10 mice/group. L, Serum alanine aminotransferase (ALT). Data are means ± SEM, n = 10 mice/group. Source data
Extended Data Fig. 2
Extended Data Fig. 2. The effect of GDF15 at 1 and 5 nmol/kg on glucose homeostasis, liver TG, NEFA and ALT.
A, Body weight. Data are means ± SEM, n = 10 mice/group except GDF15 (5 nmol/kg), n = 9 mice. P values by two-way ANOVA with Tukey’s multiple comparisons test. B, Glucose tolerance test (GTT). Data are means ± SEM, n = 10 mice/group except GDF15 (5 nmol/kg), n = 9 mice. P values by one-way ANOVA with Dunnett’s multiple comparisons test. C, Insulin tolerance test (ITT). Data are means ± SEM, n = 10 mice/group except GDF15 (5 nmol/kg), n = 9 mice. P values by one-way ANOVA with Dunnett’s multiple comparisons test. D, Liver triglycerides (TG). Data are means ± SEM, n = 8 mice/group. P values by one-way ANOVA with Dunnett’s multiple comparisons test. E, Liver non-esterified free-fatty acids (NEFA). Data are means ± SEM, n = 10 mice/group except GDF15 (5 nmol/kg), n = 9 mice. P values by one-way ANOVA with Dunnett’s multiple comparisons test. F, Serum alanine aminotransferase (ALT). Data are means ± SEM, n = 10 mice/group except GDF15 (5 nmol/kg), n = 9 mice. P values by one-way ANOVA with Dunnett’s multiple comparisons test. Source data
Extended Data Fig. 3
Extended Data Fig. 3. Liver transcriptomic analysis based on RNA-seq data.
A-C, Volcano plot showing differential expression genes (DEGs) identified between GDF15 and vehicle groups (A), GDF15 and pair-fed groups (B), and pair-fed and vehicle groups (C). n = 6 mice/group. Differential expression genes analysis with DEGseq2 is based on Wald test (two-sided, no adjustment). D, Top 30 terms in GO annotation involved in DEGs between vehicle and GDF15, n = 6 mice/group. Adjust-p value calculated by Benjamini-Hochberg method. E, Top 30 pathway by using KEGG pathway enrichment analysis. Adjust-p value calculated by Benjamini-Hochberg method. F, Hierarchical clustering by using the mouse fibrosis panel from NanoString. G, A hierarchical clustering of the liver RNA-seq data by using the 25-gene signature established in humans.
Extended Data Fig. 4
Extended Data Fig. 4. GDF15 increases energy expenditure independently on the time of feeding.
A, Experimental scheme for the effects of GDF15 and matched caloric restriction (the “pair-fed morning” group: fed at start of light cycle (0600-0700h); the “pair-fed evening” group: fed at start of dark cycle (1800–1900h)) on body mass and energy expenditure (EE) in mice. B, Average energy expenditure curves. C, AUC of average energy expenditure. Data are means ± SEM, n = 8 mice/group except GDF15 group, n = 7 mice. P values by one-way ANOVA with Tukey’s multiple comparisons test. D, ANCOVA of total energy expenditure against body weight of mice using body mass as a covariate and treatment as a fixed factor. n = 8 mice/group except GDF15 group, n = 7 mice. E, Cumulative food intake. Data are means ± SEM, n = 8 mice/group. P values by two-way ANOVA with Tukey’s multiple comparisons test. F, Body weight. Data are means ± SEM, n = 8 mice/group except GDF15 group, n = 7 mice. P values by two-way ANOVA with Tukey’s multiple comparisons test. G, Body weight percentage (Normalized to day 0). Data are means ± SEM, n = 8 mice/group except GDF15 group, n = 7 mice. P values by two-way ANOVA with Tukey’s multiple comparisons test. H, Fat mass. Data are means ± SEM, n = 8 mice/group. P values by one-way ANOVA with Tukey’s multiple comparisons test. I, Lean mass. Data are means ± SEM, n = 8 mice/group except GDF15 group, n = 7 mice. P values by one-way ANOVA with Tukey’s multiple comparisons test. Source data
Extended Data Fig. 5
Extended Data Fig. 5. (A-G) Triiodothyronine (T3) is unlikely the primary mechanism contributing to increases in the body weight loss and energy expenditure (EE) induced by GDF15.
A, A single dose of GDF15 did not change serum T3. Data are means ± SEM, n = 10 mice/group. B, GDF15 treatment for 6 weeks did not change serum T3. Data are means ± SEM, n = 10 mice/group except GDF15 (5 nmol/kg) and pair-fed groups, n = 9 mice. Statistical analysis was performed by one-way ANOVA with Tukey’s multiple comparisons test. C, Correlation between GDF15 and thyroid-stimulating hormone (TSH) in human plasma (n = 22 participants). The correlation analysis was performed using Pearson’s product-moment correlation (two-sided without adjustment). D, Experimental scheme for examining the effects of the T3 blocker propylthiouracil (PTU) and GDF15 on body mass and EE in mice fed with western diet and housed at thermoneutrality. E, Body weight. Data are means ± SEM, n = 6 mice/group. P values by two-way ANOVA with Tukey’s multiple comparisons test. F, Average 12h-ligh/dark EE. Data are means ± SEM, n = 6 mice/group. P values by one-way ANOVA with Tukey’s multiple comparisons test. G, Animal activity during 12h-light/dark circle. Data are means ± SEM, n = 6 mice/group. (H-M) GDF15 reduces NAFLD and liver inflammation through GFRAL. H, Representative images of paraffin-embedded liver sections stained with H&E. I, Steatosis score, score of ballooning degeneration of hepatocytes, inflammation score, and NAFLD activity score. Data are means ± SEM, n = 10 mice/group. P values by unpaired Mann-Whitney test (two-sided). J, Liver triglycerides (TG). Data are means ± SEM, n = 10 mice/group. P values by one-way ANOVA with Dunnett’s multiple comparisons test. K, Serum alanine aminotransferase (ALT). Data are means ± SEM, n = 10 mice/group. P values by one-way ANOVA with Dunnett’s multiple comparisons test. L, Myeloid cell percentage in the liver. Data are means ± SEM, n = 8 mice (WT-vehicle), n = 6 mice (WT-GDF15), n = 7 mice (WT-pair-fed), n = 4 mice (KO-GDF15 and KO-pair-fed). P values by one-way ANOVA with Tukey’s multiple comparisons test. M, Flowcytometry analysis for immune cell populations, including: CD45+ cell percentage, liver macrophage percentage, and CD4+ T cells percentage in the liver. Data are presented as means ± SEM. Data are means ± SEM, n = 8 mice (WT-vehicle), n = 6 mice (WT-GDF15), n = 7 mice (WT-pair-fed), n = 4 mice (KO-GDF15 and KO-pair-fed). Source data
Extended Data Fig. 6
Extended Data Fig. 6. GDF15 increases energy expenditure and fatty acid oxidation through GFRAL and beta-adrenergic signalling.
A, Body weight in Comprehensive Lab Animal Monitor System (CLAMS). Data are means ± SEM, n = 10 mice (WT-vehicle, WT-GDF15 and WT-pair-fed), n = 7 mice (KO-Pair-fed) and n = 6 mice (KO-GDF15). P values by one-way ANOVA with Dunnett’s multiple comparisons test. B, Animal activity during 12h-light/dark circle. Data are means ± SEM, n = 10 mice (WT-vehicle, WT-GDF15 and WT-pair-fed), n = 7 mice (KO-Pair-fed) and n = 6 mice (KO-GDF15). C, Average respiratory exchange ratios (RER) curves in WT and GFRAL KO mice and quantification of average 24h RER. Data are means ± SEM, n = 10 mice/group. P values by one-way ANOVA with Šídák’s multiple comparisons test. D, Average lipid oxidation curves in WT and GFRAL KO mice and quantification of average 24h lipid oxidation. Data are means ± SEM, n = 10 mice/group. P values by one-way ANOVA with Šídák’s multiple comparisons test. E, Average carbohydrate oxidation (CHO) curves in WT and GFRAL KO mice and quantification of average 24h CHO. Data are means ± SEM, n = 10 mice/group. P values by one-way ANOVA with Šídák’s multiple comparisons test. F, Animal activity during 12h-light/dark circle. Data are means ± SEM, n = 6 mice/group. G, Body mass of mice in CLAMS. n = 6 mice/group. H, Experimental scheme for the effects of a single injection of GDF15 on respiratory exchange ratios (RER), lipid oxidation and carbohydrate oxidation (CHO) in WT and beta-less mice. I, Body weight in CLAMS. Data are means ± SEM, n = 8 mice/group. J, Respiratory exchange ratio (RER) over time in WT and beta-less mice. Data are means ± SEM, n = 8 mice/group. K, Average fatty acid oxidation over 24hours. Data are means ± SEM, n = 8 mice/group. P values by one-way ANOVA with Tukey’s multiple comparisons test. L, Average carbohydrate oxidation over 24h. Data are means ± SEM, n = 8 mice/group. P values by one-way ANOVA with Tukey’s multiple comparisons test. M, GDF15 did not change serum norepinephrine. Data are means ± SEM, n = 7 mice/group except vehicle group, n = 6 mice. N, GDF15 did not change norepinephrine in the brown adipose tissue (BAT). Data are means ± SEM, n = 6 mice/group. O, GDF15 did not change norepinephrine in the liver. Data are means ± SEM, n = 5 mice/group. P values by one-way ANOVA with Tukey’s multiple comparisons test. Source data
Extended Data Fig. 7
Extended Data Fig. 7. GDF15 does not alter SNS signalling in liver, expression of thermogenic genes in adipose tissue and does not require adipose tissue AMPK to induce weight loss.
A, Principal component analysis (PCA) for liver RNAseq data based on protein kinase A signalling pathway (GO: 0010737), n = 6 mice/group. B, Ucp1 gene expression in iWAT and iBAT. Data are means ± SEM, n = 9 mice/group except pair-fed group, n = 10 mice/group. Statistical analysis was performed by one-way ANOVA with Tukey’s multiple comparisons test. C, Gene expression in iBAT. Data are means ± SEM, n = 10 mice/group except GDF15 group, n = 9 mice. D, Gene expression in iWAT. Data are means ± SEM, n = 8 mice/group except vehicle group, n = 7 mice. E, Representative images of paraffin-embedded iWAT sections stained with H&E. F, Mean cell size of iWAT. Data are means ± SEM, n = 8 mice/group except vehicle group, n = 7 mice. G, Experimental scheme for the effect of GDF15 on body mass and energy expenditure in WT and an inducible model for deletion of the AMPKβ1 and β2 subunits in adipocytes (iβ1β2AKO) mice fed with western diet and housed at thermoneutrality. H, Body weight change. Data are means ± SEM, n = 5 mice/group (WT mice), n = 6 mice/group (iβ1β2AKO mice). P values by two-way ANOVA with Tukey’s multiple comparisons test. I, Average 12h-dark EE. Data are means ± SEM, n = 5 mice/group (WT mice), n = 6 mice/group (iβ1β2AKO mice). P values by one-way ANOVA with Tukey’s multiple comparisons test. Source data
Extended Data Fig. 8
Extended Data Fig. 8. GDF15 does not alter body temperature or oxidative metabolism in liver or brown adipose tissue.
A, Body temperature (rectal temperature). Data are means ± SEM, n = 6 mice/group (Vehicle), n = 7 mice/group (GDF15 and Pair-fed groups). B, Surface temperature of mice. Data are means ± SEM, n = 6 mice/group (Vehicle), n = 7 mice (GDF15 and Pair-fed groups). C, Representative infrared images of mice. Images are displayed using the rainbow high contrast colour palette in the FLiR Research IR program. Data are means ± SEM, n = 6 mice/group (Vehicle and GDF15 groups), n = 7 mice (Pair-fed). D, k1 in mL·g−1·min−1 (Tissue blood flow index based on the uptake rate of [11C]-acetate) in liver, interscapular brown adipose tissue (iBAT), heart and kidney. Data are means ± SEM, n = 12 mice/group (Vehicle), n = 13 mice/group (GDF15). E, k2 in min−1 (oxidative metabolism index: the rapid fractional tissue clearance of [11C]-acetate) in liver, iBAT, heart and kidney. Data are means ± SEM, n = 12 mice/group (Vehicle except iBAT, n = 11 mice), n = 11 mice, n = 13 mice/group (GDF15 except iBAT, n = 11 mice). F, k3 in min−1 (non-oxidative disposal: trapping of 11C in tissue as free [11C]-acetate or other metabolites, such as lipids) in liver, heart and kidney. Data are means ± SEM, n = 12 mice/group (Vehicle), n = 13 mice/group (GDF15). G, Fatty acid (FA) uptake rate in liver, iBAT, myocardium and kidney using [11C]-palmitate PET. Data are means ± SEM, n = 12 mice (Vehicle), n = 13 mice (GDF15). P values by Paired t test H, FA oxidation rate in liver, iBAT, myocardium and kidney. Data are means ± SEM, n = 12 mice (Vehicle), n = 13 mice (GDF15). I, FA esterification rate in liver, iBAT, myocardium and kidney. Data are means ± SEM, n = 12 mice (Vehicle), n = 13 mice (GDF15). Source data
Extended Data Fig. 9
Extended Data Fig. 9. Denervation of BAT does not prevent GDF15-induced body weight loss, energy expenditure and fatty acid oxidation.
A, Experimental scheme for testing the effects of GDF15 and matched caloric restriction in iBAT denervated C57BL/6J mice fed a western diet and housed at thermoneutrality (TN, 29 °C). The BAT of mice were denervated by 6-hydroxydopamine hydrobromide (6OHDA). B, Body weight change and percentage body weight change. Data are means ± SEM, n = 5 mice/group. P values by unpaired t test (two-sided). C, Oxidation consumption curves. Data are means ± SEM, n = 5 mice/group. P values by unpaired t test (two-sided). D, ANCOVA of energy expenditure against body weight of mice using body mass as a covariate and treatment as a fixed factor. E, Average respiratory exchange ratios (RER) curves. Data are means ± SEM, n = 5 mice/group. P values by unpaired t test (two-sided). F, Average lipid oxidation curves. Data are means ± SEM, n = 5 mice/group. P values by unpaired t test (two-sided). G, Average carbohydrate oxidation (CHO) curves. Data are means ± SEM, n = 5 mice/group. P values by t test (two-sided). H, Body weight. Data are means ± SEM, n = 5 mice/group. I, Animal activity during 12h-light/dark circle. Data are means ± SEM, n = 5 mice/group. Source data
Extended Data Fig. 10
Extended Data Fig. 10. GDF15 increases beta-adrenergic signalling and mitochondrial respiration in skeletal muscle without change fibre type percentages and muscle structure.
A, Relative Sln gene expression level in soleus and extensor digitorum longus (EDL) muscle. Data are means ± SEM, n = 7 mice/group. P values of treatment factor was analysed by Mixed-effects model (REML, two-sided without adjustment). B, Relative expression level of Atp2a1, Atp2a2, Ucp3, Sln, Pln, Ppard, Gpd2, Cox8b and Pppargc1a in TA muscle from beta-less mice. n = 6 mice/group. C, Relative expression level of Atp2a1, Atp2a2, Sln, Pln, Gpd2, and Cpt1a in myotubes treated with vehicle, GDF15 and norepinephrine (NE). n = 7 biologically independent samples/group. P values by two-way ANOVA with Tukey’s multiple comparisons test. D, Sln expression in quadriceps isolated from mice treated with the vehicle or beta-2 agonist (Clenbuterol). Data are means ± SEM, n = 10 mice/group. P values by unpaired t test (two-sided). E, Representative immunohistochemical staining for fibre types in gastrocnemius. F, Muscle fibre type percentage. Data are mean ± SEM, n = 4 group. G, Representative images of frozen gastrocnemius muscle sections stained with H&E (4 mice/group). Within each gastrocnemius, the entire muscle cross-section was visualized and imaged to evaluate the whole cross-section in its entirety. H, Absolute mitochondrial respiration (JO2); S4: State 4 (pyruvate + malate), S2: State 2 (pyruvate + malate, depleted ADP), S3: State 3 (PMD (+max ADP)), CI: maximal CI respiration (PMDG (+max glutamate)), CII: maximal CII respiration (+max succinate), RCR: S3/S4. Data are means ± SEM, n = 6 mice/group. I, Representative trace of oxygen depletion in mitochondria in the presence of 100 μM (200 nmoles) ADP for determination of ADP/O ratios. Data are means ± SEM, n = 6 mice/group. J, Absolute mitochondrial JO2 with oligomycin and maximal CII supported respiration. OMY: JO2 with mitochondria + oligomycin (no substrates), CII: maximal respiration with PMDGS. Data are means ± SEM, n = 6 mice/group. K, Change in mitochondrial JO2 from OMY with PMDGS. Data are means ± SEM, n = 6 mice/group. P values by one-way ANOVA with Tukey’s multiple comparisons test. L, JO2 in permeabilized fibres in the presence and absence of ADP and various substrates. Data are means ± SEM, n = 5 mice/group except GDF15 group, n = 6 mice. M, Oxygen consumption (JO2) in permeabilized muscle fibres treated with (PM, Pyruvate + Malate, ATP, Ca2+ or CPA, cyclopiazonic acid). Data are means ± SEM, n = 6 mice/group except GDF15 group, n = 5 mice. P values by two-way ANOVA with Šídák’s multiple comparisons test. N, Change in JO2 during a calcium titration in permeabilized fibres. Data are means ± SEM, n = 6 mice/group except GDF15 group, n = 5 mice. P values by two-way ANOVA with Tukey’s multiple comparisons test. P- pyruvate; M - malate; D - ADP; G - glutamate; S - succinate; RCR - respiratory control ratio. O, Absolute JO2. Data are means ± SEM, n = 8 mice/group. P values by unpaired t test (two-sided). Source data
Extended Data Fig. 11
Extended Data Fig. 11. The relationship between GDF15 and resting metabolic rate (RMR) and NAFLD in humans.
A, Correlation between GDF15 levels and RMR in a population of healthy adults (n = 137 participants). The correlation analysis was performed using Pearson’s product-moment correlation (two-sided). B, the correlation between GDF15 levels correcting to weight and mass and RER after correction for fat mass, fat free mass and age from TANITA, by using our published equation Ln BEE = −0.954+0.707 Ln FFM +0.019 Ln FM. The correlation analysis was performed using Pearson’s product-moment correlation (two-sided). C, Distribution of GDF15 expression levels (log10(TPM)) from 806 muscle tissues for human subjects in GTEx. The yellow and blue boxes represent the top 25% (n = 200) and bottom 25% (n = 200) groups, respectively. The hinges correspond to first and third quartiles, the whiskers extend to the largest/smallest value, and the centre lines represent the median values. D, Relative expression level (TPM) of SLN, PPARD, CPT1A, CPT1B, GPD2. n = 200 human subjects per group. P values by unpaired t test (two-sided). The hinges correspond to first and third quartiles, the whiskers extend to the largest/smallest value, and the centre lines represent the median values. E, Scatter plot of the SNP-effect on GDF15 and SNP-effect on liver fat percentage in humans by using two sample Mendelian Randomization (2SMR). Error bars indicate 95% CI, n = 32,859 participants in UK Biobank. MR analysis was performed by using Simple median method, MR weighted mode estimator, Weighted median method, MR Egger regression, Inverse variance weighted methods. F, Single SNP analysis of GDF15 on liver fat percentage in human, Error bars indicate 95% CI, n = 32,859 participants in UK Biobank. G, Scatter plot of the SNP-effect on GDF15 and SNP-effect on liver volume in human. Error bars indicate 95% CI, n = 32,859 participants in UK Biobank. MR analysis was performed by using Simple median method, MR weighted mode estimator, Weighted median method, MR Egger regression, Inverse variance weighted methods. Source data
Extended Data Fig. 12
Extended Data Fig. 12. A graphical model depicting the biological circuit linking GDF15 with GFRAL and beta-adrenergic receptors to maintain energy expenditure in muscle during caloric restriction.
Mice, liver, muscle and brain illustrations are obtained from BioRender.com (publication license number TZ259QRW6B).

Comment in

  • GDF15 boosts muscle energy burn.
    Starling S. Starling S. Nat Rev Endocrinol. 2023 Sep;19(9):499. doi: 10.1038/s41574-023-00877-6. Nat Rev Endocrinol. 2023. PMID: 37452212 No abstract available.

References

    1. Petersen KF, et al. Reversal of nonalcoholic hepatic steatosis, hepatic insulin resistance, and hyperglycemia by moderate weight reduction in patients with type 2 diabetes. Diabetes. 2005;54:603–608. doi: 10.2337/diabetes.54.3.603. - DOI - PMC - PubMed
    1. Tremblay A, Royer MM, Chaput JP, Doucet E. Adaptive thermogenesis can make a difference in the ability of obese individuals to lose body weight. Int. J. Obes. 2013;37:759–764. doi: 10.1038/ijo.2012.124. - DOI - PubMed
    1. Johannsen DL, et al. Metabolic slowing with massive weight loss despite preservation of fat-free mass. J. Clin. Endocrinol. Metab. 2012;97:2489–2496. doi: 10.1210/jc.2012-1444. - DOI - PMC - PubMed
    1. Yang L, et al. GFRAL is the receptor for GDF15 and is required for the anti-obesity effects of the ligand. Nat. Med. 2017;23:1158–1166. doi: 10.1038/nm.4394. - DOI - PubMed
    1. Emmerson PJ, et al. The metabolic effects of GDF15 are mediated by the orphan receptor GFRAL. Nat. Med. 2017;23:1215–1219. doi: 10.1038/nm.4393. - DOI - PubMed

Publication types

MeSH terms