. 2023 Jul;619(7969):323-331.
doi: 10.1038/s41586-023-06250-x. Epub 2023 Jun 28.

Locus for severity implicates CNS resilience in progression of multiple sclerosis

Collaborators

Locus for severity implicates CNS resilience in progression of multiple sclerosis

International Multiple Sclerosis Genetics Consortium et al. Nature. 2023 Jul.

Abstract

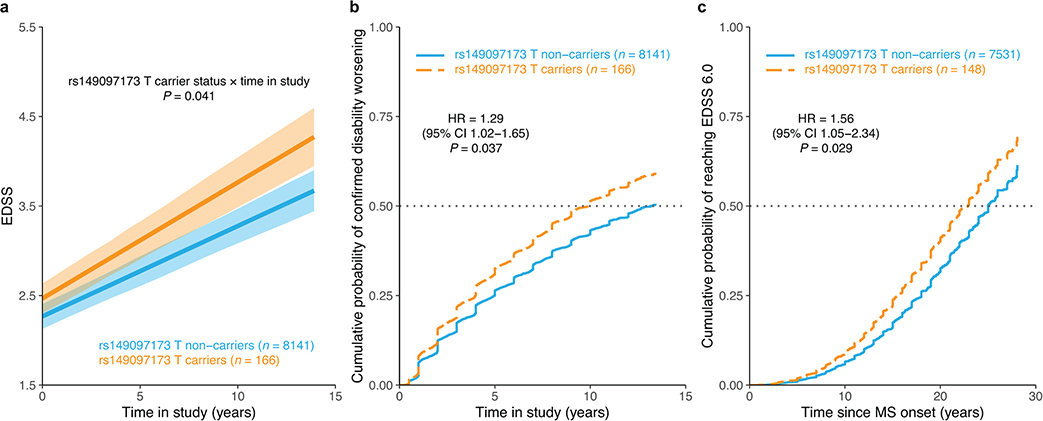
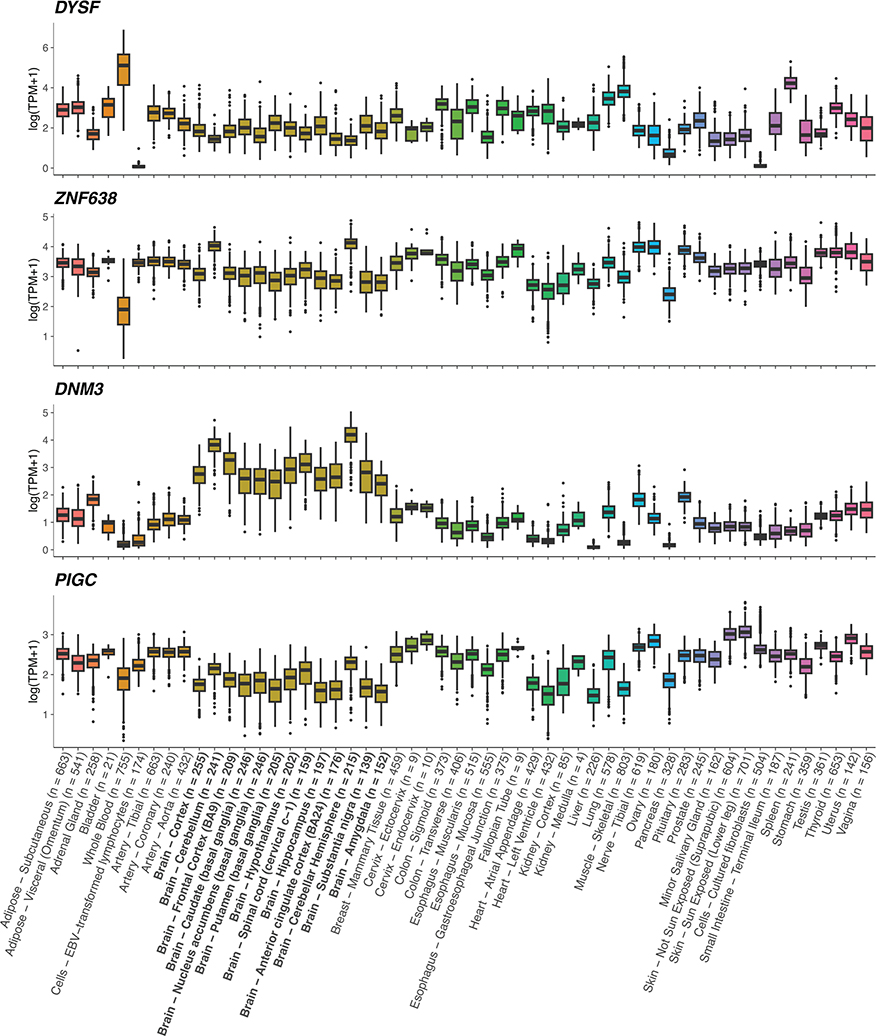
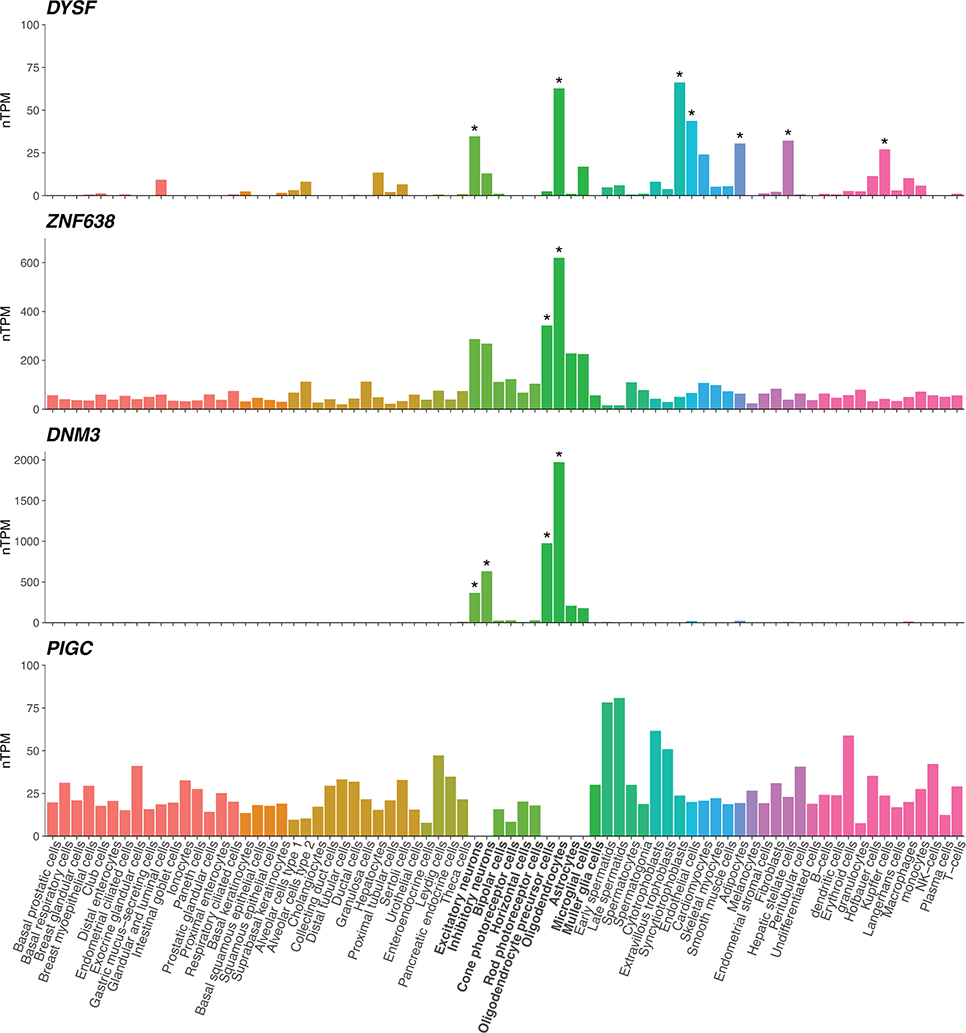
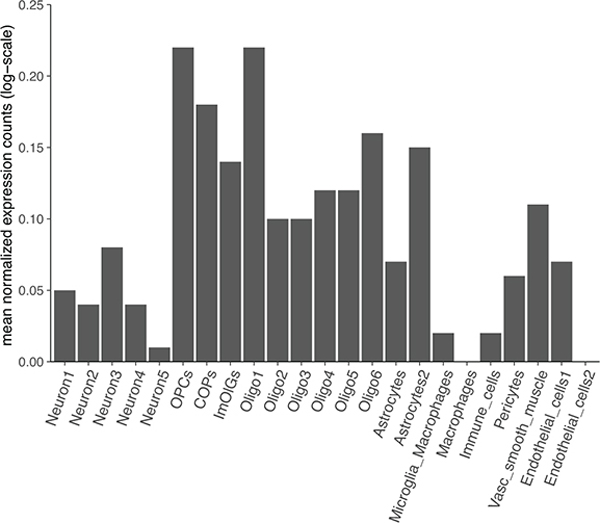
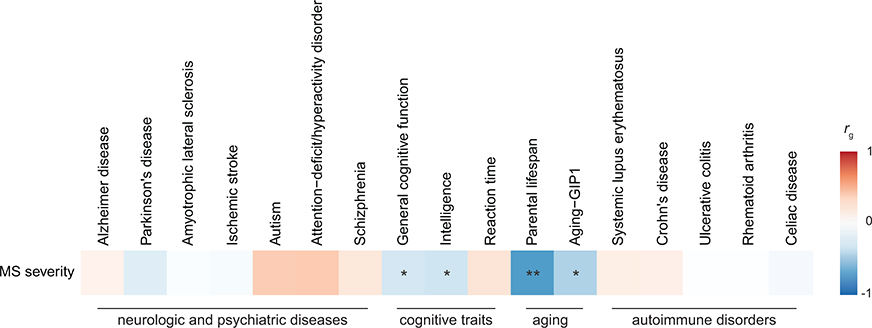
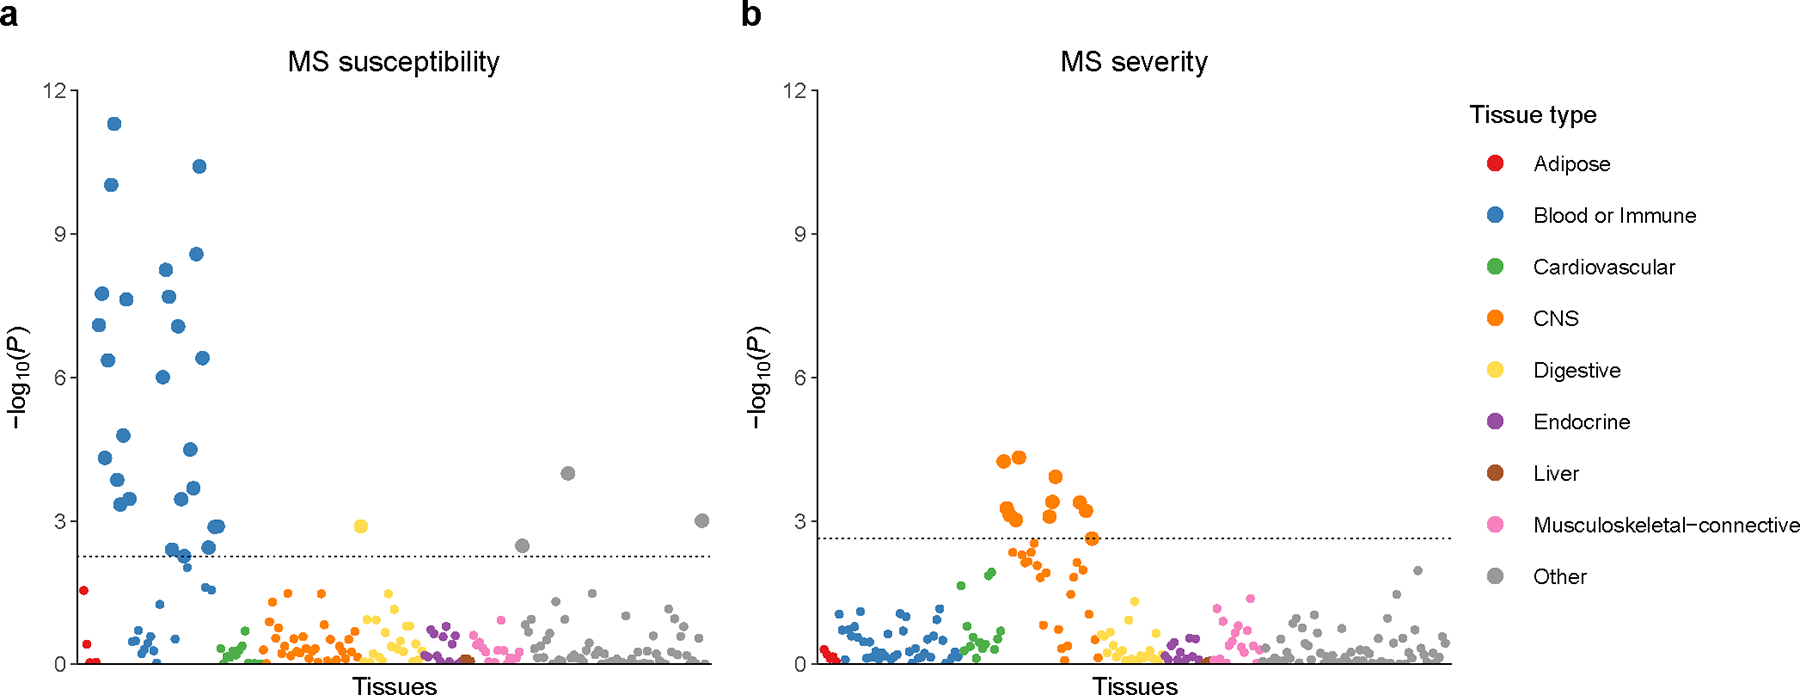
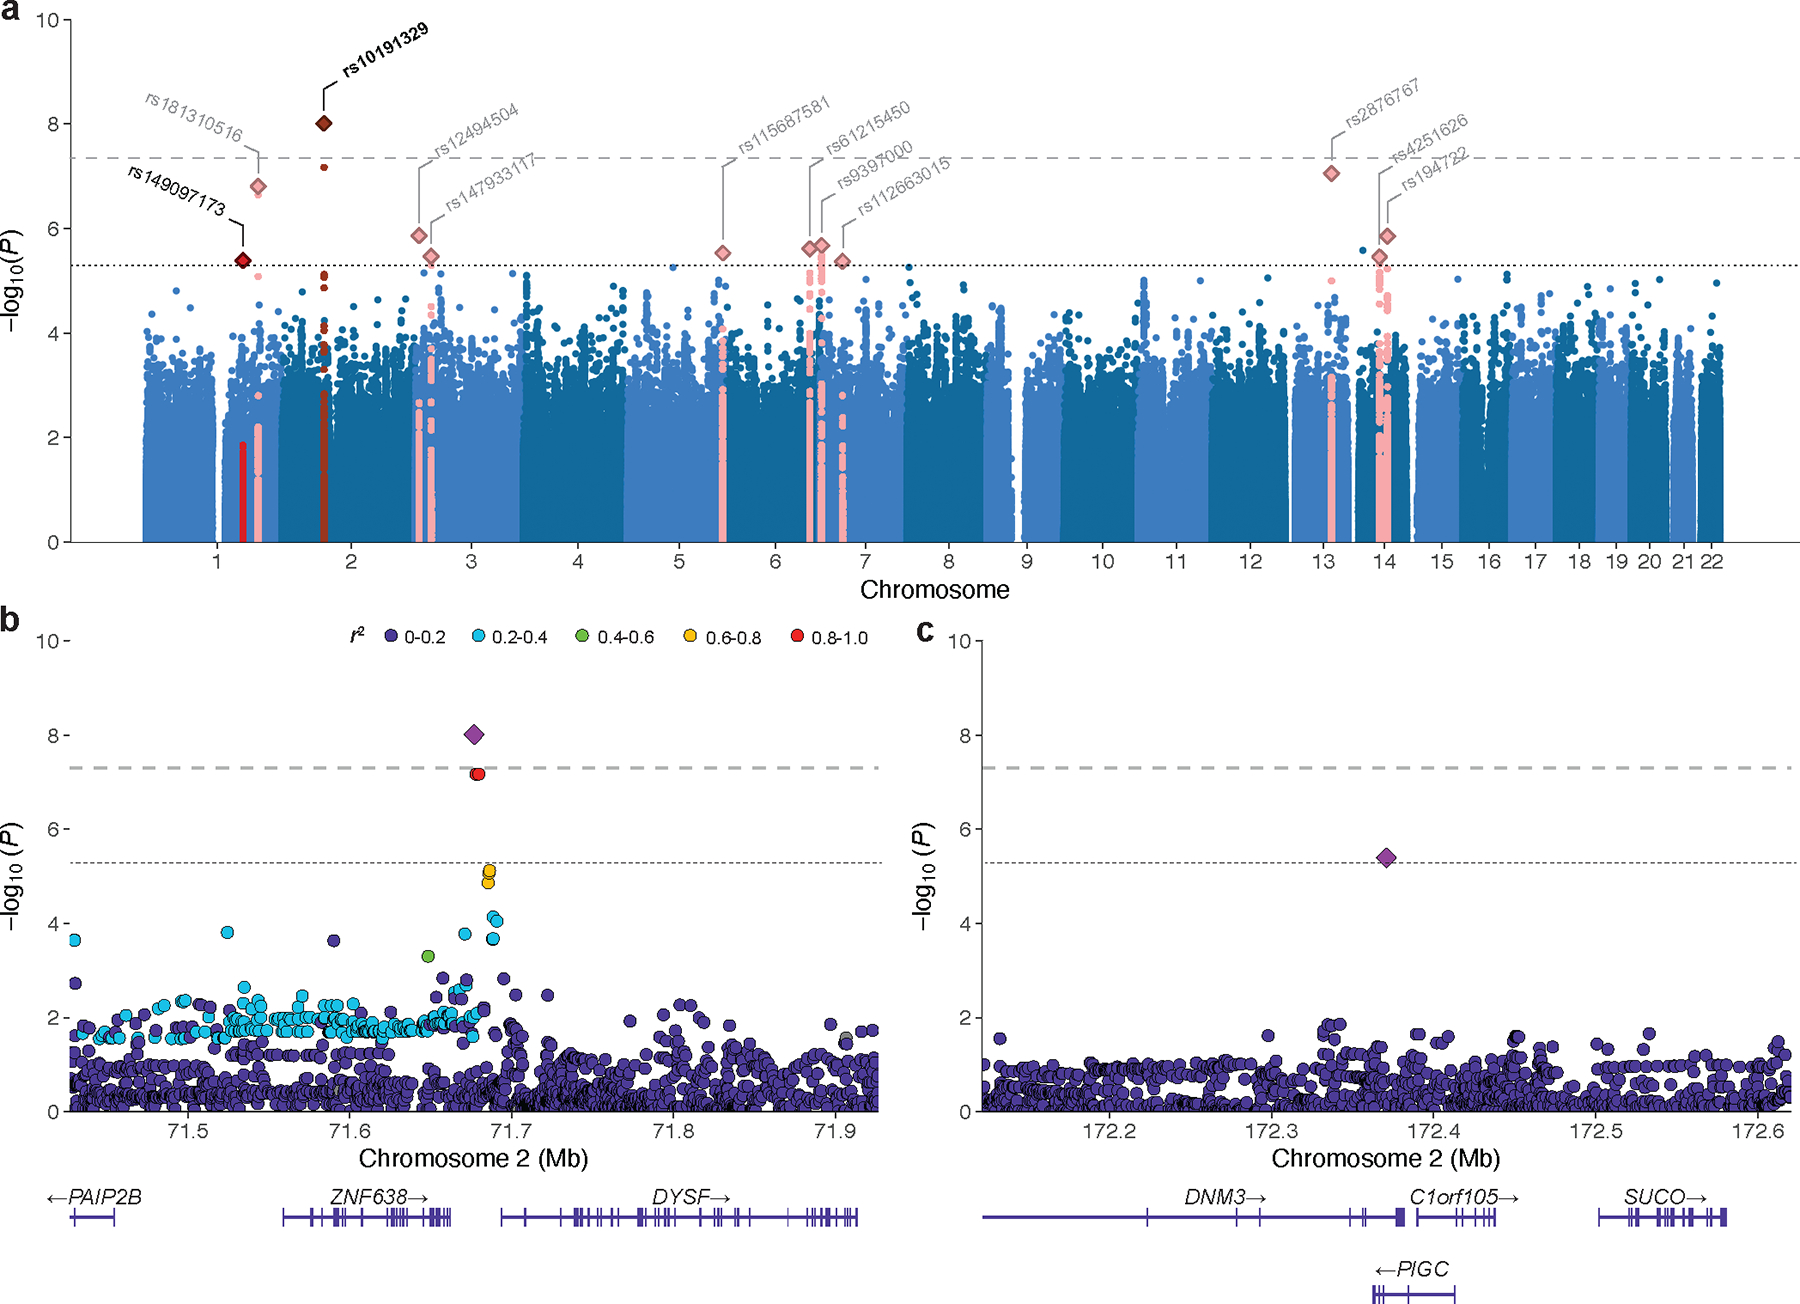
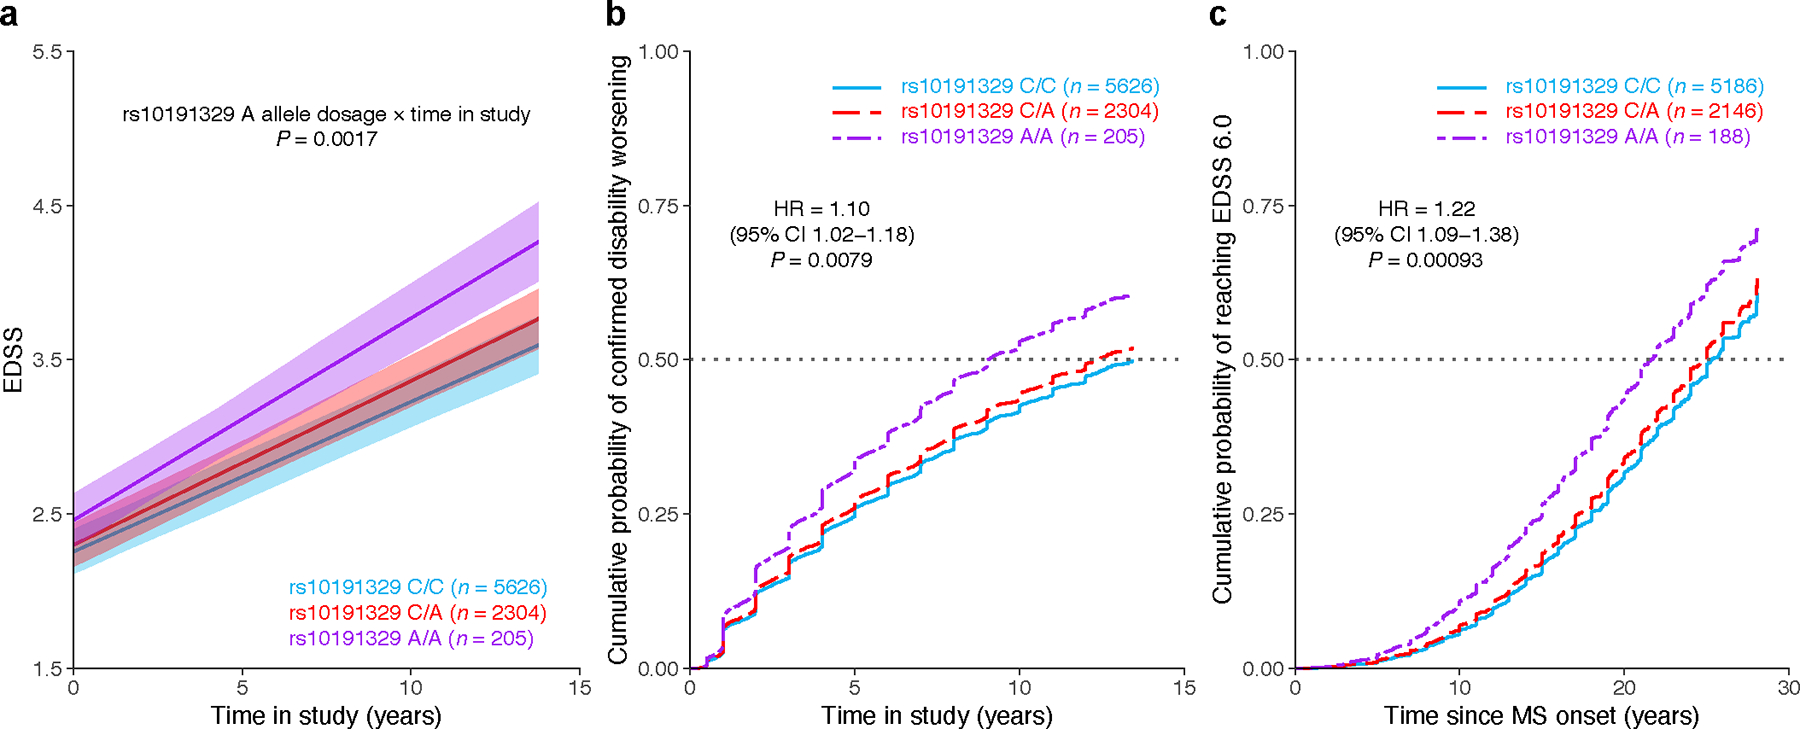
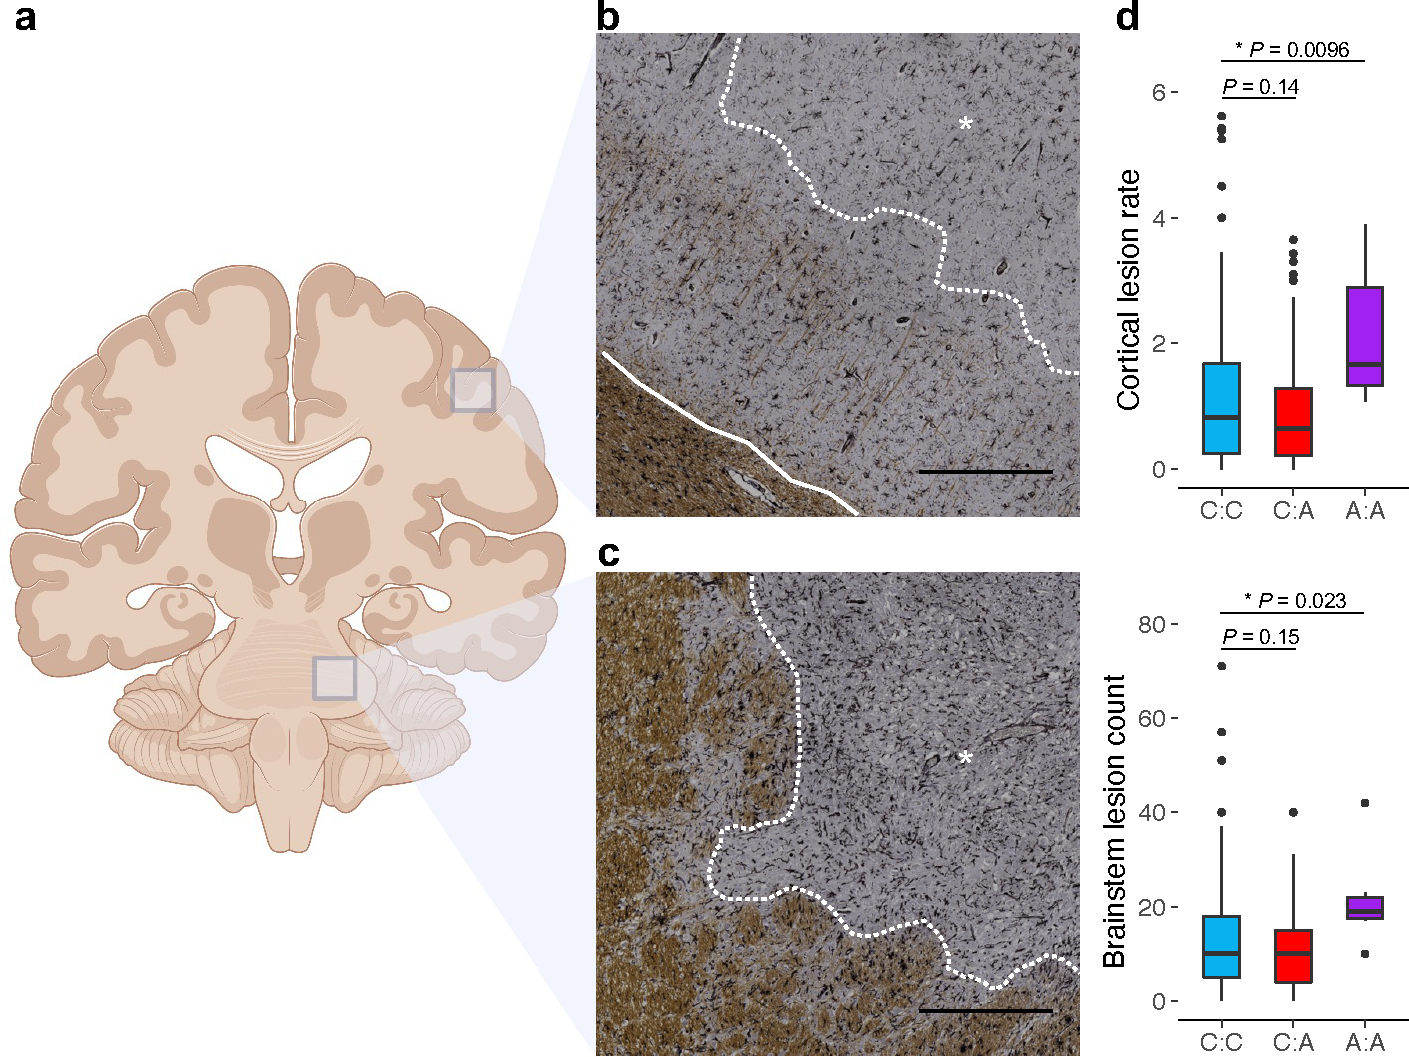
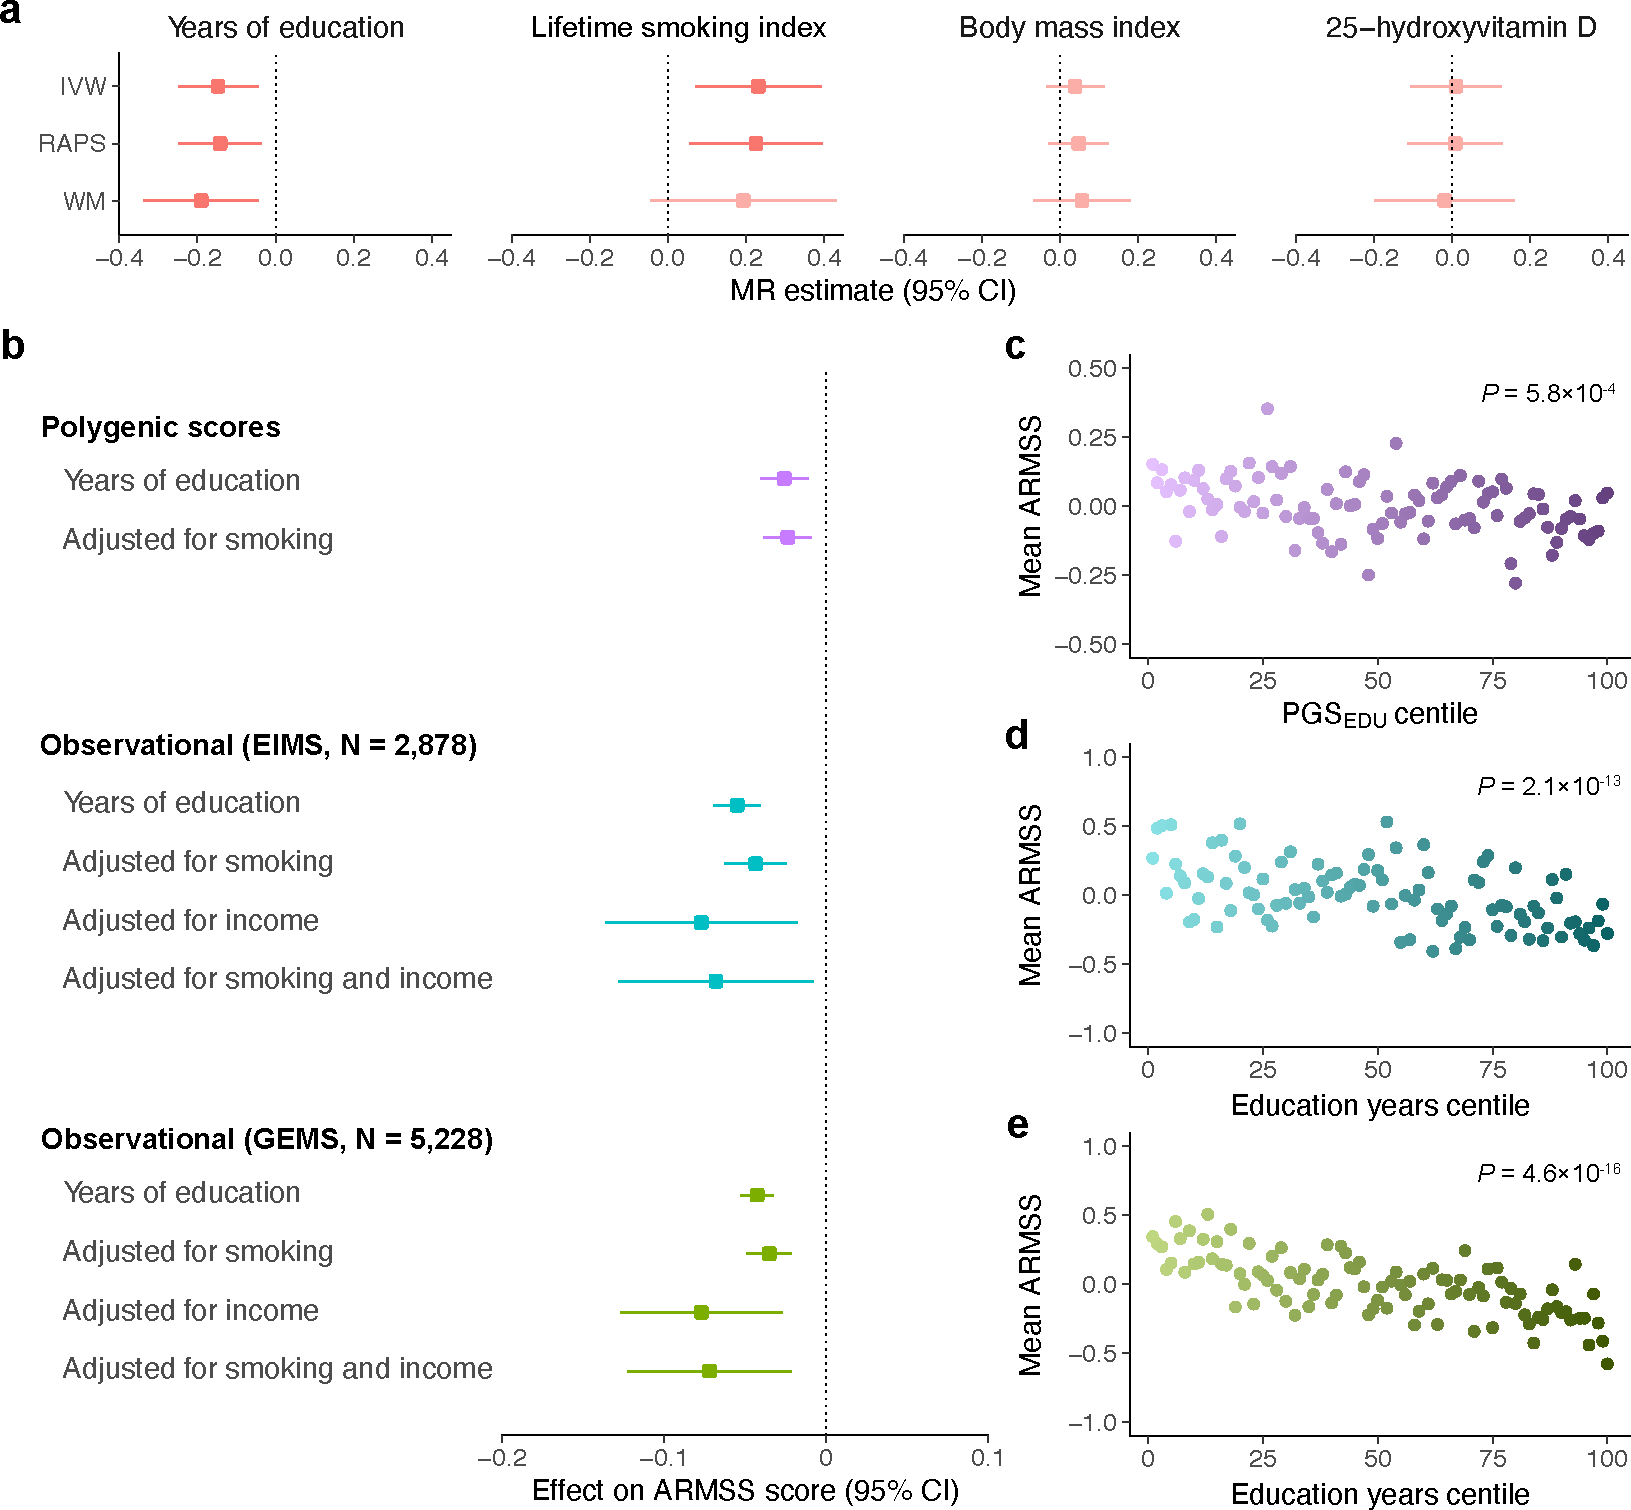
Multiple sclerosis (MS) is an autoimmune disease of the central nervous system (CNS) that results in significant neurodegeneration in the majority of those affected and is a common cause of chronic neurological disability in young adults1,2. Here, to provide insight into the potential mechanisms involved in progression, we conducted a genome-wide association study of the age-related MS severity score in 12,584 cases and replicated our findings in a further 9,805 cases. We identified a significant association with rs10191329 in the DYSF-ZNF638 locus, the risk allele of which is associated with a shortening in the median time to requiring a walking aid of a median of 3.7 years in homozygous carriers and with increased brainstem and cortical pathology in brain tissue. We also identified suggestive association with rs149097173 in the DNM3-PIGC locus and significant heritability enrichment in CNS tissues. Mendelian randomization analyses suggested a potential protective role for higher educational attainment. In contrast to immune-driven susceptibility3, these findings suggest a key role for CNS resilience and potentially neurocognitive reserve in determining outcome in MS.


Conflict of interest statement

Competing interests. T.O. has received compensation for advisory boards/lectures from Biogen, Novartis, Merck and Sanofi, as well as unrestricted MS research grants from the same companies, none of which are related to the current article. A.B. and his institution have received compensation for consultancy, lectures, and participation in clinical trials from Alexion, Biogen, Celgene, Merck, Novartis, Sandoz/Hexal, Sanofi, and Roche, all outside the current work. S.R.D. has received compensation for serving on advisory boards from Novartis, and institutional research grant funding from EMD Serono and Novartis, all outside the current work. M.F. is Editor-in-Chief of the Journal of Neurology, Associate Editor of Human Brain Mapping, Associate Editor of Radiology, and Associate Editor of Neurological Sciences; received compensation for consulting services and/or speaking activities from Alexion, Almirall, Bayer, Biogen, Celgene, Eli Lilly, Genzyme, Merck-Serono, Neopharmed Gentili, Novartis, Roche, Sanofi, Takeda, and Teva Pharmaceutical Industries; and receives research support from Biogen Idec, Merck-Serono, Novartis, Roche, Teva Pharmaceutical Industries, Italian Ministry of Health, Fondazione Italiana Sclerosi Multipla, and ARiSLA (Fondazione Italiana di Ricerca per la SLA). J.L.-S. received travel compensation from Biogen, Merck, Novartis; has been involved in clinical trials with Biogen, Novartis, Roche; her institution has received honoraria for talks and advisory board service from Biogen, Merck, Novartis, Roche, all outside the current work. M.J.F.-P. has received travel compensation from Merck outside the current work. A.G.K. has received speaker honoraria and Scientific Advisory Board fees from Bayer, BioCSL, Biogen-Idec, Lgpharma, Merck, Novartis, Roche, Sanofi-Aventis, Sanofi-Genzyme, Teva, NeuroScientific Biopharmaceuticals, Innate Immunotherapeutics, and Mitsubishi Tanabe Pharma, all outside of the current work. F.Z. has recently received research grants and/or consultation funds from Biogen, Ministry of Education and Research (BMBF), Bristol-Meyers-Squibb, Celgene, German Research Foundation (DFG), Janssen, Max-Planck-Society (MPG), Merck Serono, Novartis, Progressive MS Alliance (PMSA), Roche, Sanofi Genzyme, and Sandoz, all outside of the current work. B.D. has received consulting fees and/or funding from Biogen Idec, BMS, Sanofi-Aventis, and Teva. B.D. and A.G. have received consulting/travel fees and/or research funding from Novartis, Roche, and Merck, all outside the current work. SL received compensation for consulting services and speaker honoraria from Biogen Idec, Novartis, TEVA, Genzyme, Sanofi, and Merck, all outside the current work. S.B. has received honoraria from Biogen Idec, Bristol Meyer Squibbs, Merck Healthcare, Novartis, Roche, Sanofi Genzyme, and TEVA; his research is funded by the German Research Foundation (DFG), Hertie Foundation, and the Hermann and Lilly-Schilling Foundation. F.E. received compensation for consulting services and speaker honoraria from Novartis, Sanofi Genzyme, Almirall, Teva, and Merck-Serono. Jo.S. received consultancy and/or lecture fee from Biogen, Merck, Novartis, and Sanofi Genzyme, his institution received research funding by Biogen, GSK, Idorsia, and Merck, all outside the current work. B.H. has served on scientific advisory boards for Novartis; he has served as DMSC member for AllergyCare, Polpharma, Sandoz, and TG therapeutics; his institution received research grants from Regeneron and Roche for multiple sclerosis research. He holds part of two patents; one for the detection of antibodies against KIR4.1 in a subpopulation of patients with multiple sclerosis and one for genetic determinants of neutralizing antibodies to interferon. Ja.S. received speaker honoraria and a research grant for rare diseases from Sanofi Genzyme, and is a founder and minority shareholder of the University of Helsinki spin-off company VEIL.AI. J.L.M. has participated in advisory board meetings for Sanofi-Genzyme and received research funding from Genentech, Biogen Idec, and the Bristol-Myers Squibb Foundation. N.A.P. is currently an employee of Novartis Institutes for BioMedical Research (NIBR). Ká.S. and I.J. are employees of the biotechnology company deCODE genetics/AMGEN. Li.A. reports personal compensation for consulting and serving on steering committees or advisory boards for Biogen Idec, Novartis, Genentech, EMD Serono, and research funding from the Bristol-Myers Squibb Foundation, NMSS, Race to Erase MS, and NIH NINDS. P.C. reports consulting fees from Biogen, Nervgen, Idorsia, Avidea (now Vaccitech), and Disarm Therapeutics (now Lilly); research grant support from Genentech. A.R.C. reports personal compensation for participating as active speaker, consulting and serving on steering committees or advisory boards for Biogen Idec, Novartis, Genentech, EMD Serono, Bristol Myers Squib, Sanofi Genzyme, Banner Life Sciences, Alexion and Horizon. The remaining authors declare no competing interests related to this work.

Figures

Extended Data Fig. 1 |
Extended Data Fig. 1 |. Demographic characteristics by population and center.
a, Discovery population (n = 12,584). b, Replication population (n = 9,805). Bars represent the proportion of patients in each category. Centers are ordered as in the box plot legend (bottom right subpanel). Box plots show median, first, and third quartiles; whiskers represent the smallest and largest values within 1.5-times the interquartile range; outliers are depicted as dots. The countries corresponding to the abbreviations in the box plot legend are shown in Supplementary Table 1. ARMSS, age-related multiple sclerosis severity; EDSS, expanded disability status scale; Primary prog., primary progressive; yrs, years.
Extended Data Fig. 2 |
Extended Data Fig. 2 |. Principal component analysis of the discovery and replication populations.
MS cases were recruited from 13 countries for the discovery (a) and 8 for the replication (b). After removing population outliers, all remaining cases were of European ancestry. The first two principal components respectively captured the north-to-south and east-to-west gradients of European genetic structure. US and Canadian participants overlapped with those from other countries. Based on self-reported ancestry, East European and Ashkenazi Jewish individuals constituted the majority of the predominantly US subcluster located at the bottom right of the discovery population (a). The scree plots for our principal component analysis in the discovery (c) and replication (d) populations confirm that the first few principal components capture most of the variance attributable to the minimal population structure remaining after quality control.
Extended Data Fig. 3 |
Extended Data Fig. 3 |. Replication of MS severity variants by center.
a, Genome-wide significant lead variant rs10191329. b, Suggestive lead variant rs149097173. Forest plots show successful replication of the two variants with minimal heterogeneity between centers as indicated by the Cochran’s Q and I2 statistics (n = 9,805 participants). ARMSS scores are rank-based inverse-normal transformed. Error bars represent 95% CIs. ARMSS, age-related multiple sclerosis severity; CI, confidence interval.
Extended Data Fig. 4 |
Extended Data Fig. 4 |. Association of rs149097173 with longitudinal disability outcomes.
a, Adjusted mean EDSS scores over time by carrier status for rs149097173 predicted from LMM analysis. Shaded ribbons indicate the standard error of the mean over time; P value from LMM. b, Covariate-adjusted cumulative incidence of 24-week confirmed disability worsening for the same groups of individuals. c, Covariate-adjusted cumulative incidence of requiring a walking aid; carriers had a 2.2-year shorter median time to require a walking aid. HR and two-sided P values were obtained from Cox proportional hazards models using imputed allele dosage (b–c; Methods). Results were not significant after adjusting for multiple testing across two variants (see Fig. 3 for rs10191329 associations) and three outcomes (P < 0.05/6), although the latter are not expected to be independent. CI, confidence interval; HR, hazard ratio.
Extended Data Fig. 5 |
Extended Data Fig. 5 |. Tissue expression for nominated MS severity genes.
Gene expression profiles were obtained from GTEx (version 8). Transcripts were collapsed to the gene level and expressed in natural log-transformed transcript per million (TPM) units. DYSF, ZNF638, DNM3 and PIGC are expressed in the brain. Box plots show median, first, and third quartiles; whiskers represent the smallest and largest values within 1.5-times the interquartile range; outliers are depicted as dots. Bold x-axis labels identify CNS tissues. Colors represent tissue types as defined in GTEx.
Extended Data Fig. 6 |
Extended Data Fig. 6 |. Cell type expression profiles for nominated MS severity genes.
Single-cell RNA sequencing data from 25 human tissues and peripheral blood mononuclear cells were obtained from the Human Protein Atlas. Transcript expression levels were summarized per gene and reported as average normalized transcripts per million (nTPM) in 76 cell types. Asterisks mark cell type specificity for the gene, defined as at least fourfold higher expression in a cell type compared to the mean of others. We note that three of the genes show specificity for oligodendrocyte lineage cells. PIGC expression in brain neuronal and glial cells, missing here, is demonstrated in Extended Data Fig. 8. Colors represent cell type categories; bold x-axis labels identify neuronal and glial cell categories.
Extended Data Fig. 7 |
Extended Data Fig. 7 |. Cell type expression for PIGC in brain white matter tissue.
Single nuclear RNA expression from 4 progressive MS patients and 5 non-neurological controls confirms PIGC expression in neuronal and glial cells including oligodendrocyte lineage cells. COPs, committed oligodendrocyte precursors; ImOLGs, immune oligodendroglia; Oligo, oligodendrocyte; OPCs, oligodendrocyte precursor cells; Vasc, vascular.
Extended Data Fig. 8 |
Extended Data Fig. 8 |. Genetic correlations with MS severity.
Shared genetic contribution obtained from cross-trait LDSC. Colors correspond to genetic correlation (rg) estimates (blue, negative; red, positive). An asterisk indicates a correlation that is significantly different from zero, based on two-sided P values calculated using LDSC (*FDR < 0.05, **FDR < 0.01). Full results are in Supplementary Table 17. Aging-GIP1 was constructed using principal component analysis to capture GWASs of healthspan, father lifespan, mother lifespan, longevity, frailty, and self-rated health.
Extended Data Fig. 9 |
Extended Data Fig. 9 |. Association of individual MS susceptibility variants (n = 209) with longitudinal disability outcomes.
a, Distribution of P values from adjusted LMM analysis of EDSS change across all study visits. Distribution of two-sided P values from adjusted Cox proportional hazards analyses of (b) time to 24-week confirmed disability worsening and (c) time to require a walking aid. The dashed orange line represents the Bonferroni-corrected significance threshold adjusted for the number of susceptibility variants. d, Venn diagram of nominal associations (Punadjusted < 0.05) between individual MS susceptibility variants and all disability outcomes considered; no variant showed consistent association across three or more outcomes. The labels in this panel correspond to the following outcomes: ARMSS, association with ARMSS scores following rank-based inverse normal transformation; Disability worsening, time to 24-week confirmed disability worsening; Walking aid, time to require a walking aid (EDSS 6.0); EDSS rate, rate of EDSS change across all study visits.
Extended Data Fig. 10 |
Extended Data Fig. 10 |. MS susceptibility PGS and longitudinal disability outcomes.
a, Adjusted mean EDSS scores over time by PGS quartile predicted from LMM analysis. Shaded ribbons indicate the standard error of the mean over time; P value from LMM. b, Covariate-adjusted cumulative incidence of 24-week confirmed disability worsening comparing individuals in the highest versus those in the lowest quartile of MS susceptibility PGS. c, Covariate-adjusted cumulative incidence of requiring a walking aid for the same groups of individuals. HR and two-sided P values were obtained from Cox proportional hazards models using imputed allele dosage (b–c; Methods). Across all analyses, the MS susceptibility PGS had no influence on longitudinal outcomes.
Fig. 1 |
Fig. 1 |. Tissue and cell type heritability enrichment.
a, MS susceptibility from previous meta-analysis. b, MS severity from this study. While susceptibility associations display strong immunological lymphoid and myeloid enrichment, our analysis of MS severity uncovered significant enrichment exclusively in CNS tissues. Each point represents one of 205 tissues and cell types, grouped by color into 9 categories. Large circles are significant at a false discovery rate cutoff of 0.05 (dotted line). Full results including tissue and cell type labels are provided in Supplementary Tables 7 and 8.
Fig. 2 |
Fig. 2 |. Within-cases GWAS identifies a novel locus associated with MS severity.
a, Genome-wide association statistics obtained by linear regression of ARMSS scores. The −log10(P) are plotted against chromosomal position. The horizontal dashed line corresponds to the genome-wide significant threshold (P < 5×10⁻⁸) and the horizontal dotted line reflects the threshold for suggestive association (P < 5×10⁻⁶). The bold label indicates the lead genome-wide significant and replicated variant. Variants labeled in gray were not replicated. b, Locus Zoom plot for rs10191329 (DYSF-ZNF638 locus). c, Locus Zoom plot for rs149097173 (DNM3-PIGC locus). Top, −log10(P) from the GWAS for variants at each locus (left y-axis) with the recombination rate indicated by the blue line (right y-axis); bottom, gene positions. Colors represent LD (r2 values) with the lead variant. LD, linkage disequilibrium.
Fig. 3 |
Fig. 3 |. MS severity variant accelerates disability accumulation in longitudinal analysis.
a, Adjusted mean EDSS scores over time predicted from LMM analysis showed faster disability worsening in rs10191329 risk allele carriers. Shaded ribbons indicate the standard error of the mean over time; P value from LMM. b, Covariate-adjusted cumulative incidence of 24-week confirmed disability worsening in MS patients based on rs10191329 genotype. Similar to MS clinical trials, worsening was defined as an increase in EDSS by 1.0 if the baseline score was < 5.5 and by 0.5 if the baseline was ≥ 5.5. c, Covariate-adjusted cumulative incidence of requiring a walking aid for the same lead variant. Homozygous carriers had a 3.7-year shorter median time to require a walking aid. HR and two-sided P values were obtained from Cox proportional hazards models using imputed allele dosage (b–c; Methods). Left-censoring of participants with EDSS ≥ 6.0 at study entry resulted in different sample sizes for genotype groups in the time to walking aid analysis. CI, confidence interval; HR, hazard ratio.
Fig. 4 |
Fig. 4 |. Cortical lesion rate and brainstem lesion count are elevated in homozygous rs10191329 risk allele carriers.
a, Schematic representation of tissue sampling locations (created with BioRender.com). Demyelinating lesions were quantified on a brainstem section dissected in a consistent manner across individuals. Cortical lesions were identified on supratentorial tissue blocks targeted to macroscopic or MRI-visible MS lesions. b, Brain tissue section immunostained for the proteolipid protein marker of myelin (brown). A subpial cortical lesion characterized by loss of myelin is marked by an asterisk and delineated by the dotted white line. The solid white line separates normal-appearing gray matter (sparse brown) from white matter (dense brown). c, A lesion spanning gray and white matter in the brainstem of the same donor, marked by an asterisk and delineated from normal-appearing tissue by the dotted white line. Black scale bars indicate 0.5 mm. The donor was an A allele homozygote for rs10191329. d, Box plots show median, first, and third quartiles; whiskers represent the smallest and largest values within 1.5-times the interquartile range; outliers are depicted as dots. Two-sided P values were obtained from generalized linear models comparing lesion count in the cortex (offset by the relevant number of tissue blocks; n = 174 donors) and brainstem (n = 181 donors) across genotype groups adjusting for covariates; significant differences are marked with an asterisk. The displayed cortical lesion rate was calculated by dividing the number of lesions by the number of tissue blocks containing cortex.
Fig. 5 |
Fig. 5 |. Association of MS severity with educational attainment and smoking.
a, MR estimates for the effect of years of education (n = 765,283), lifetime smoking index (n = 462,690), body mass index (n = 681,275), and 25-hydroxyvitamin D (n = 441,291) on ARMSS scores; the lighter color represents nonsignificant results. b, Similarly, adjusted polygenic risk score (n = 12,584) and observational analyses of two MS cohorts (n = 2,878 and 5,228) demonstrated reduced MS severity with higher years of education in linear regression models. This effect persisted following adjustment for smoking and income. c, Mean ARMSS scores decreased with higher PGSEDU percentile. d, Similarly, higher percentile of recorded years of education associated with lower mean ARMSS scores in the EIMS cohort. e, Mean ARMSS scores decreased with higher percentile years of education in the GEMS cohort. P values were obtained from a regression of ARMSS scores on PGSEDU (c) or years of education (d-e), adjusted for baseline covariates. In the MR and observational analyses, point estimates (squares) reflect a 1-year increase in education, while polygenic score estimates are per standard deviation score increase. ARMSS, age-related multiple sclerosis severity score (rank-based inverse-normal transformed); IVW, inverse-variance weighted; PGSEDU, polygenic score for years of education; RAPS, robust adjusted profile score; WM, weighted median.

References

MAIN REFERENCES

    1. Thompson AJ, Baranzini SE, Geurts J, Hemmer B & Ciccarelli O Multiple sclerosis. Lancet 391, 1622–1636 (2018). - PubMed
    1. Walton C et al. Rising prevalence of multiple sclerosis worldwide: Insights from the Atlas of MS, third edition. Mult. Scler. 26, 1816–1821 (2020). - PMC - PubMed
    1. International Multiple Sclerosis Genetics Consortium. Multiple sclerosis genomic map implicates peripheral immune cells and microglia in susceptibility. Science 365, (2019). - PMC - PubMed
    1. Hauser SL & Cree BAC Treatment of Multiple Sclerosis: A Review. Am. J. Med. 133, 1380–1390.e2 (2020). - PMC - PubMed
    1. International Multiple Sclerosis Genetics Consortium et al. Genetic risk and a primary role for cell-mediated immune mechanisms in multiple sclerosis. Nature 476, 214–219 (2011). - PMC - PubMed

METHODS REFERENCES

    1. Kurtzke JF Rating neurologic impairment in multiple sclerosis: an expanded disability status scale (EDSS). Neurology 33, 1444–1452 (1983). - PubMed
    1. McCarthy S et al. A reference panel of 64,976 haplotypes for genotype imputation. Nat. Genet. 48, 1279–1283 (2016). - PMC - PubMed
    1. Das S et al. Next-generation genotype imputation service and methods. Nat. Genet. 48, 1284–1287 (2016). - PMC - PubMed
    1. Jiang L, Zheng Z, Fang H & Yang J A generalized linear mixed model association tool for biobank-scale data. Nat. Genet. 53, 1616–1621 (2021). - PubMed
    1. Aschard H, Vilhjálmsson BJ, Joshi AD, Price AL & Kraft P Adjusting for heritable covariates can bias effect estimates in genome-wide association studies. Am. J. Hum. Genet. 96, 329–339 (2015). - PMC - PubMed

Publication types

MeSH terms